
EUR/USD:
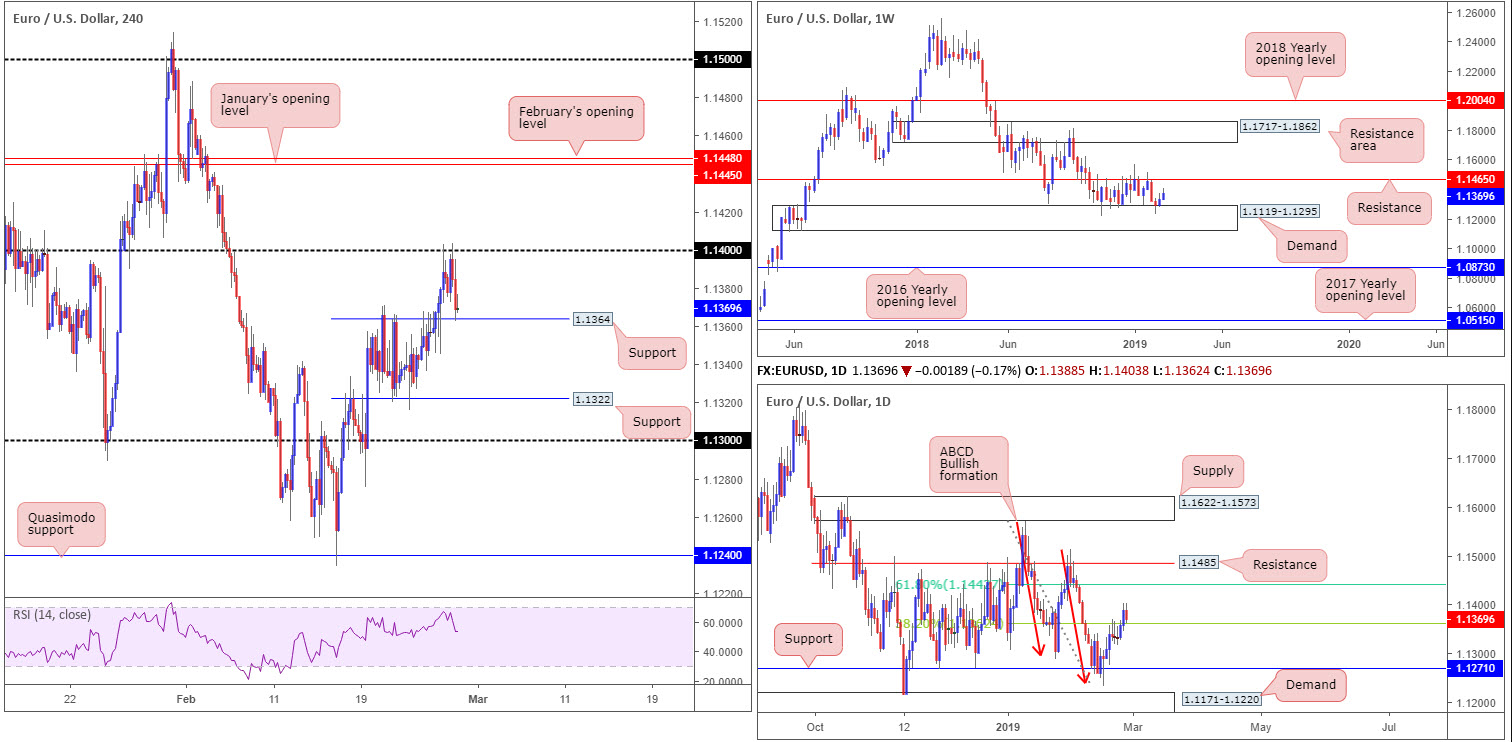
The value of the euro weakened against its US counterpart Wednesday, snapping a two-day bullish phase. A revival of USD bidding, driven by advancing US Treasury yields, weighed on the EUR/USD.
Fading its 1.14 handle on the H4 timeframe, the unit fell sharply towards nearby local H4 support pencilled in at 1.1364. Medium term, however, the pair remains entrenched within an uptrend, with a higher high expected to take shape beyond 1.14, potentially towards January and February’s opening levels at 1.1445 and 1.1448, respectively.
According to our technical studies, the H4 uptrend is reinforced by a weekly demand area coming in at 1.1119-1.1295, with the next upside objective not expected to enter the frame until we reach a weekly long-standing support/resistance at 1.1465.
The story over on the daily timeframe shows the candles recently broke above its 38.2% Fibonacci resistance value at 1.1362. This level, as highlighted in previous reports, is the first take-profit target for many traders long the daily ABCD bullish completion point (red arrows) around 1.1240. Above this barrier, we have the 61.8% Fibonacci resistance value at 1.1442 in the spotlight – considered the second take-profit target off the ABCD pattern.
Areas of consideration:
Having seen weekly buyers enter the fold from demand (1.1119-1.1295) and daily price exhibit scope to push for higher ground towards 1.1442, along with H4 price shaking hands with local support at 1.1364, the research team remains biased to the upside this week, despite yesterday’s decline.
With the above in mind, traders are urged to keep eyes on the current H4 support for possible long opportunities today. A failure of this area unlocks the door to H4 support pegged at 1.1322.
Whether you feel the evidence presented here is sufficient to pull the trigger without confirmation is down to the individual trader. For folks looking for additional confirmation, waiting for a H4 bullish candlestick pattern to develop off either 1.1364 or 1.1322 is an option. That way, not only have you additional confirmation buyers may be interested, you also have entry and stop parameters to work with based on the candlestick structure.
In terms of upside targets, watch for a break above 1.14. Above here we have the daily 61.8% Fibonacci resistance value mentioned above at 1.1442, followed closely by the monthly opening levels highlighted above around 1.1448/45.
Today’s data points: German Prelim CPI m/m; FOMC Member Clarida Speaks; US Advance GDP q/q; US Advance GDP Price Index q/q; Chicago PMI.
GBP/USD:
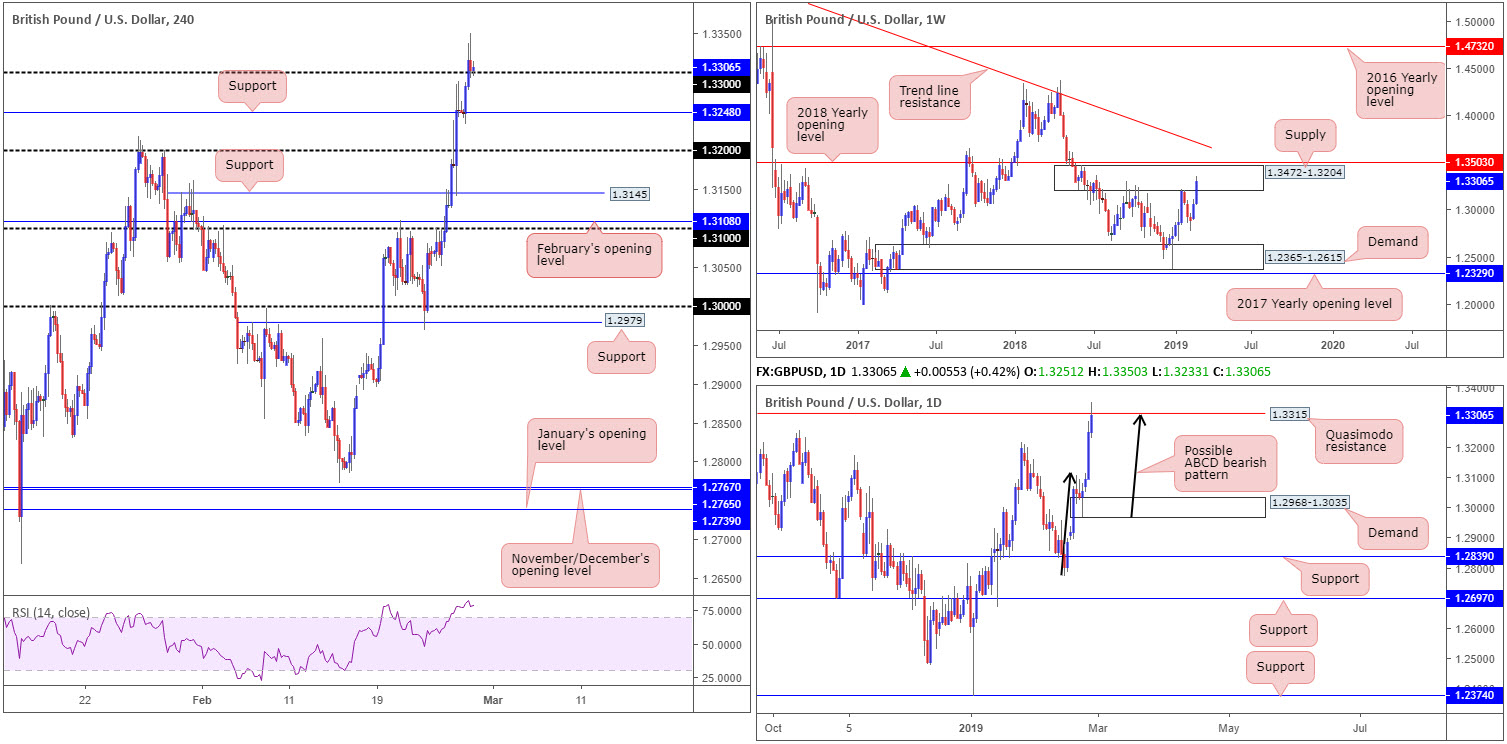
Following UK PM May’s concessions, which the market viewed as an indication a no-deal Brexit has diminished, cable set a fresh YTD high at 1.3350 Wednesday, firmly breaking through the 1.33 handle on the H4 timeframe. The next target on this scale has 1.34 eyed, which if 1.33 holds as support may be achieved today, according to the H4 trend and nearby structure. It might also be worth noting the H4 RSI indicator is seen testing deep overbought terrain.
Up 1.93% so far this week, the current weekly candle is seen invading supply territory pictured at 1.3472-1.3204, which happens to be positioned just south of the 2018 yearly opening level at 1.3503. In parallel with this, daily flow is crossing swords with a Quasimodo resistance level parked at 1.3315. Adding weight to a potential correction from here is the approach: an ABCD bearish formation (black arrows).
Areas of consideration:
Although sterling is trading with a reasonably strong upside bias on the H4 timeframe, with room seen to appreciate towards 1.34, traders are urged to tread carefully. As highlighted above, hefty higher-timeframe resistances are in motion.
For that reason, should we drop back beneath 1.33 and retest the underside of the number as resistance, a sell could be in store, targeting nearby H4 support at 1.3248 as the initial take-profit zone, followed closely by the 1.32 handle.
Today’s data points: FOMC Member Clarida Speaks; US Advance GDP q/q; US Advance GDP Price Index q/q; Chicago PMI.
AUD/USD:
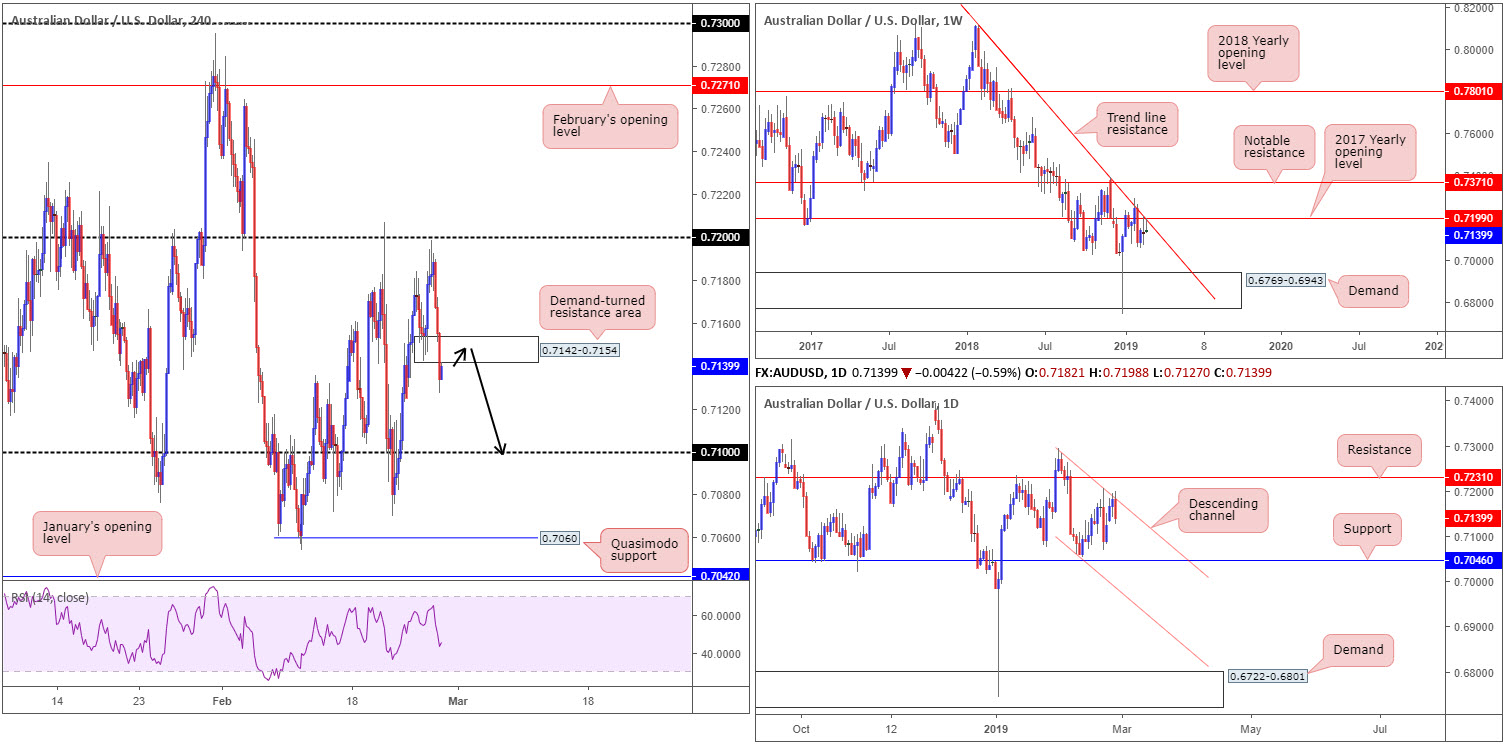
Leaving 0.72 unopposed by a pip, the Australian dollar recoiled against its US peer Wednesday, down 0.59% on the day.
The Australian seasonally adjusted estimate for total construction work done fell 3.1% to $51,092.3m in the December quarter, weighing on the AUD/USD in early trade. This, along with the US dollar index turning higher on the day, eventually pulled the pair beneath 0.7142-0.7154: a H4 demand-turned resistance area, and has exposed 0.71 as the next viable support on the H4 timeframe.
For traders who read Wednesday’s report you may recall the piece highlighting 0.72 as a major resistance. Besides offering resistance as a round number, 0.72 fuses with 0.7199 on the weekly timeframe: the 2017 yearly opening level, as well as merging trend line resistance (taken from the 2018 yearly high of 0.8135). Further adding weight to 0.72, nearby resistance on the daily timeframe is seen in the shape of a channel formation (taken from the high 0.7295).
It might also interest traders to note weekly price is trading in the shape of a bearish pin-bar pattern, while daily price concluded Wednesday by way of a bearish engulfing formation.
Areas of consideration:
Well done to any of our readers who managed to sell yesterday’s move.
The break of H4 demand mentioned above at 0.7142-0.7154 could perhaps offer an area of resistance today. A retest to the underside of this zone, backed by a supporting H4 bearish candlestick (entry and stop parameters can be defined according to the candlestick’s rules), has 0.71 in view as the initial port of call. Beyond here, though, eyes are on the H4 Quasimodo support at 0.7060 as the second take-profit target (positioned a few pips north of daily support priced in at 0.7046 (the next support on that scale).
Today’s data points: FOMC Member Clarida Speaks; US Advance GDP q/q; US Advance GDP Price Index q/q; Chicago PMI.
USD/JPY:
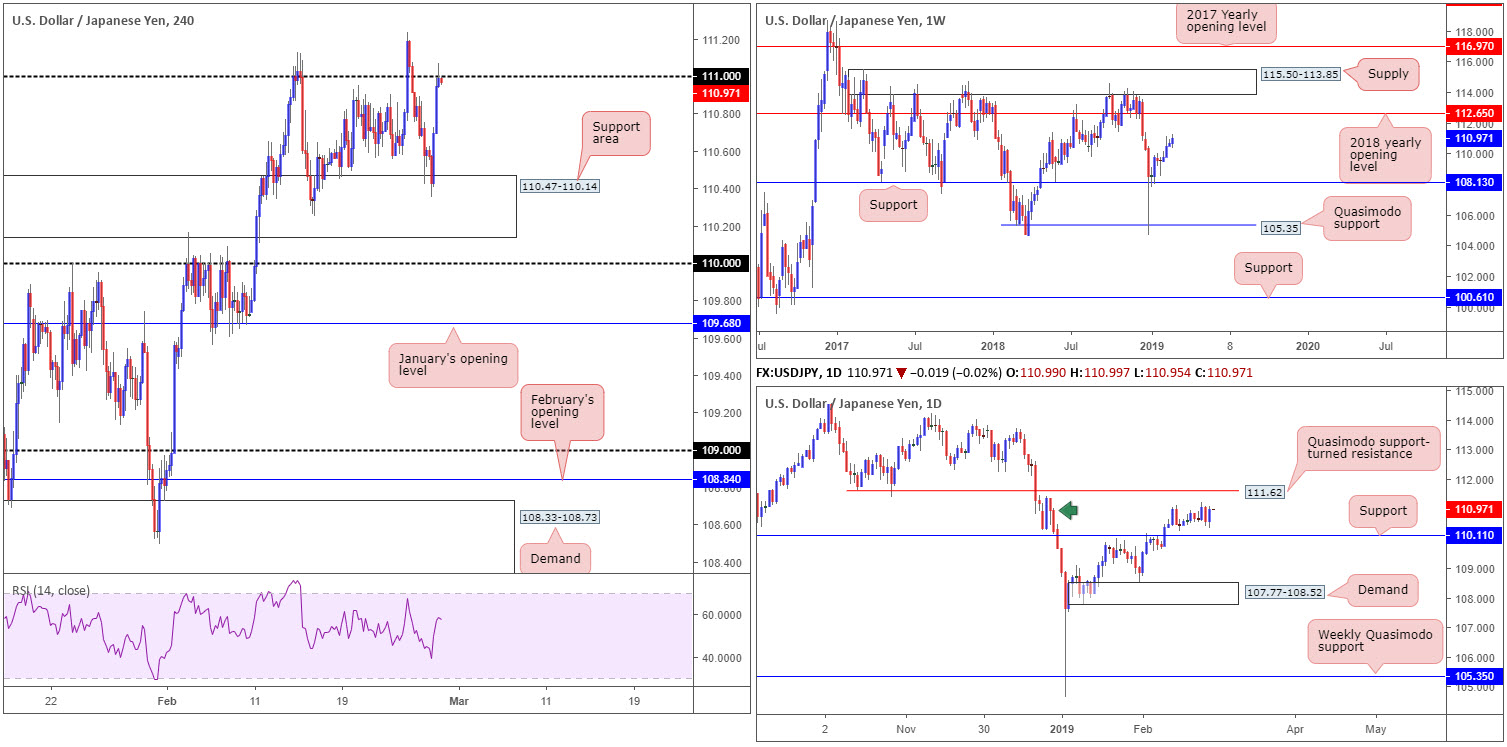
Robust US Treasury yields bolstered the USD/JPY Wednesday, up 0.37% on the day. In the form of two near-full-bodied H4 bullish candles, the pair rose from its H4 support area at 110.47-110.14 towards the underside of 111. Note a marginal breach of this number was observed to highs of 111.07, which is likely enough to have pulled in some stop-loss orders from those fading 111, and also trigger a portion of breakout buyers’ orders.
On a wider perspective, weekly flows suggest a relatively strong upside bias, with the 2018 yearly opening level at 112.65 in view as the next resistance. Structure on the daily timeframe has support located nearby at 110.11, a supply decorating the left side of the chart at 111.40-110.33 (green arrow) and a Quasimodo support-turned resistance at 111.62.
Areas of consideration:
With all three timeframes in view, the research team feels a break of 111 is on the cards.
A H4 close above 111 provides a foundation for buying towards 111.62, according to the overall picture. Traders have the choice of either entering long at the close of the breakout candle, or waiting and seeing if the market retests 111 as support. The latter is considered the more conservative route.
Should you favour a retest, drilling down to the lower timeframes is also an option to secure a tighter entry: a lower-timeframe candlestick signal off 111, for example.
Today’s data points: FOMC Member Clarida Speaks; US Advance GDP q/q; US Advance GDP Price Index q/q; Chicago PMI.
USD/CAD:
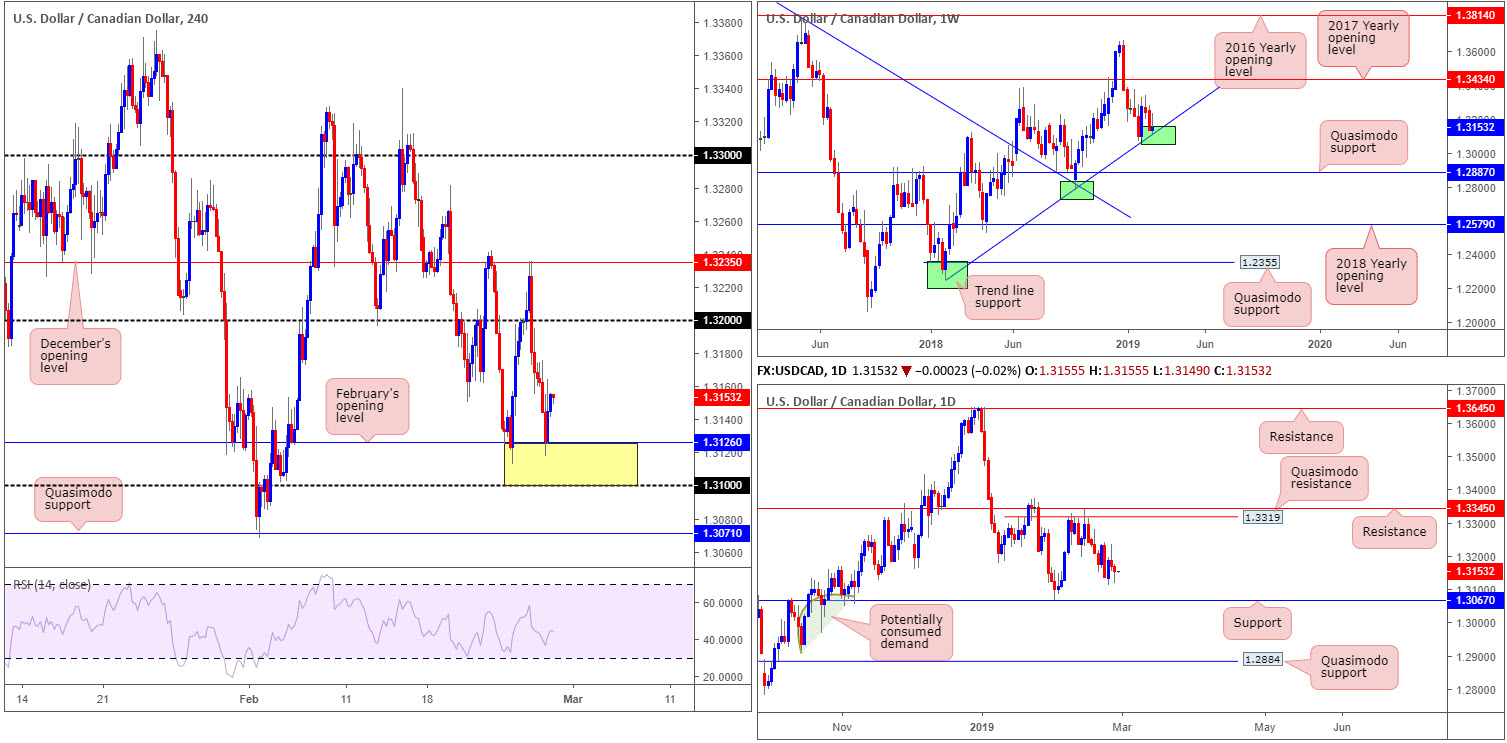
On a seasonally adjusted monthly basis, Canada’s CPI declined 0.1% in January, following a 0.2% increase in December. The shelter index (+0.5%) and the alcoholic beverages, tobacco and recreational cannabis index (+0.5%) reported the largest increases, while the transportation index (-0.7%) declined the most (statcan).
Wednesday’s inflation numbers triggered an immediate selloff to lows of 1.3118 (check M30 for a clearer view), though met strong opposition from February’s opening level at 1.3126 on the H4 timeframe. For folks who read Wednesday’s report you may recall the piece highlighting 1.31/1.3126 as a reasonably solid support area (yellow). The foundation, however, comes from the weekly timeframe offering support in the shape of a trend line (etched from the low 1.2247) and room to move higher on the daily timeframe to as far north as Quasimodo resistance coming in at 1.3319. It might also be worth noting daily price concluded Wednesday’s segment in the form of a bullish candlestick pattern.
Areas of consideration:
Well done to any of our readers who managed to secure a long position out of 1.31/1.3126 yesterday. Further buying from here will likely find itself back around the 1.32 neighbourhood. However, do bear in mind, we could potentially push much higher than this, given higher-timeframe structure.
Unless we retest 1.31/1.3126 today, the research team believes this to be a difficult market to buy at current price, despite the surrounding picture portending higher levels.
Today’s data points: FOMC Member Clarida Speaks; US Advance GDP q/q; US Advance GDP Price Index q/q; Chicago PMI; Canadian Current Account; Canadian RMPI m/m.
USD/CHF:
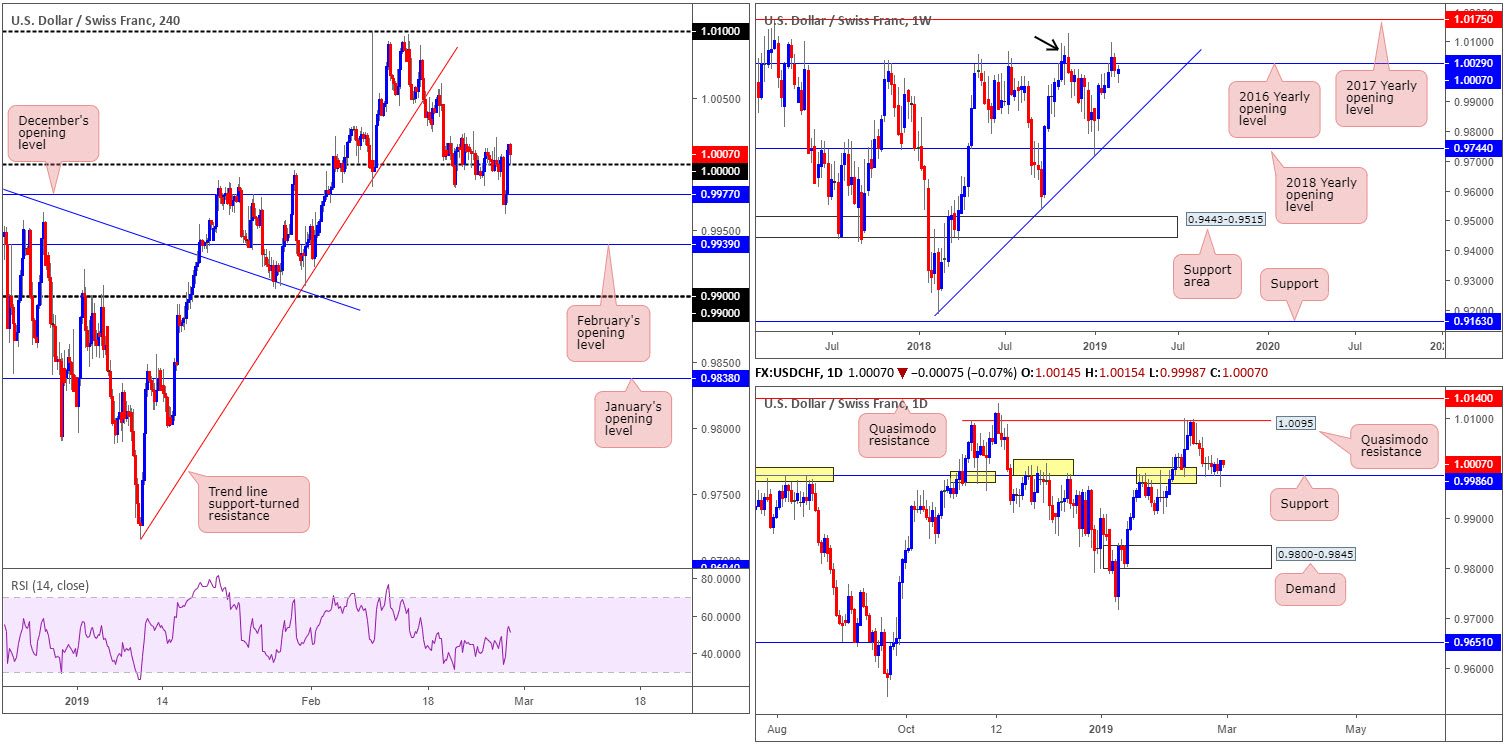
In recent sessions, the H4 candles dipped underneath 1.0000 (parity) and also marginally surpassed December’s opening level at 0.9977. Supported by a rising US Treasury market and daily support priced in at 0.9986 (the level’s history [yellow] is a prominent feature on its chart), buyers elbowed their way onto the platform and reclaimed 1.0000+ status into the closing bell.
In terms of where we stand on the weekly timeframe, not much has changed structurally speaking. Weekly buyers struggled to gain a foothold above its 2016 yearly opening level at 1.0029 last week, consequently clawing back prior week gains and breaking a three-week bullish run. As highlighted in the previous weekly briefing, the barrier’s history as a resistance may still draw in sellers as it did in November 2018 (black arrow).
Areas of consideration:
Both H4 and daily structure suggest a move higher could be in store, though weekly price trading from its 2016 yearly opening level at 1.0029 is intimidating.
As of current price, neither a long nor short is attractive at the moment.
Should we push for lower ground, as the weekly timeframe proposes, however, a H4 close beneath December’s opening level at 0.9977 that’s followed up with a retest as resistance (preferably in the shape of a H1 or H4 bearish candlestick pattern [entry/stop levels can be taken from this structure]) could be worthy of an intraday sell, targeting February’s opening level at 0.9939 and then 0.99.
Today’s data points: FOMC Member Clarida Speaks; US Advance GDP q/q; US Advance GDP Price Index q/q; Chicago PMI.
Dow Jones Industrial Average:
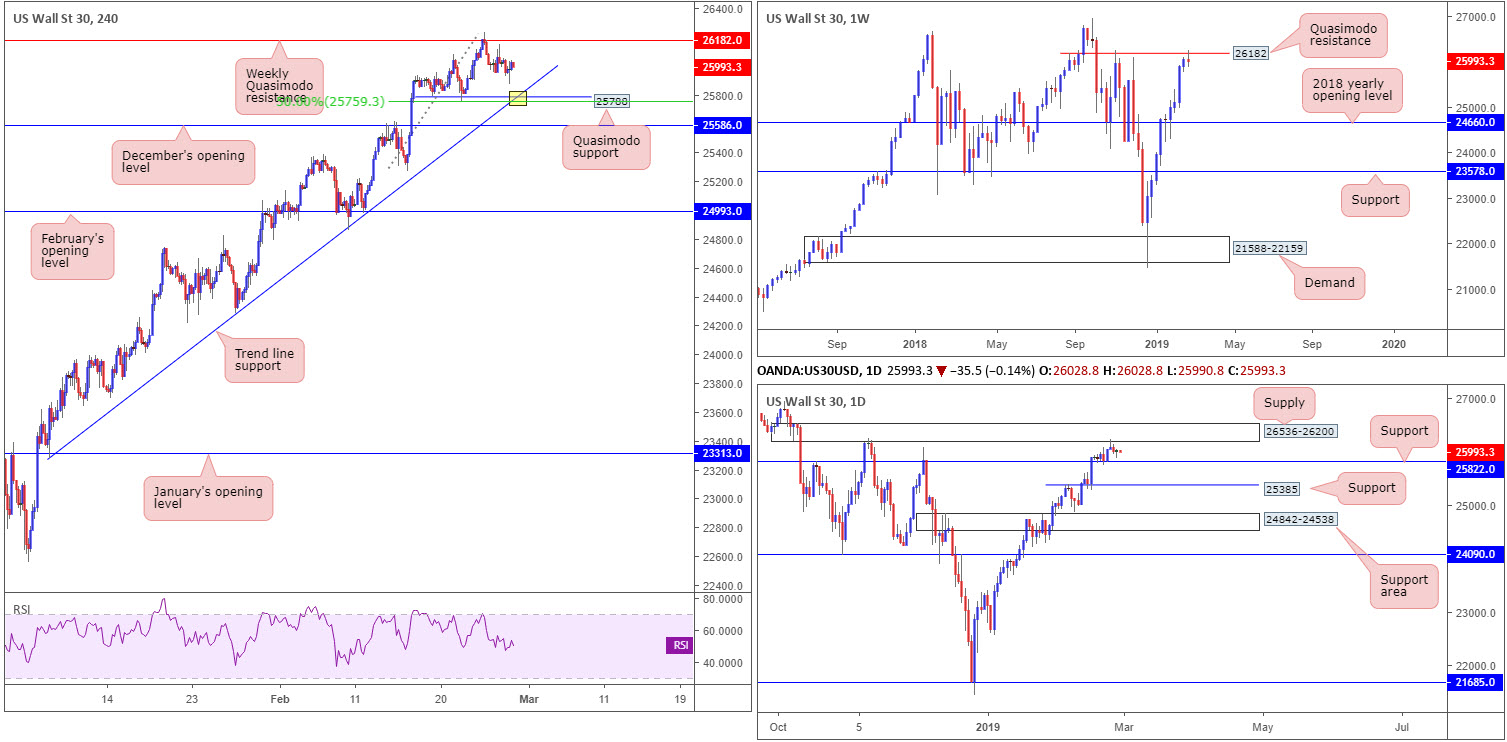
US equities concluded Wednesday’s segment unchanged (+0.03%).
The index is seen flipping between gains/losses amid the weekly Quasimodo resistance at 26182 and a H4 Quasimodo support at 25788, which happens to merge with a trend line support (extended from the low 23277).
From the top of the pile, nevertheless, weekly players are seen fading a Quasimodo resistance plotted at 26182 by way of a bearish pin-bar formation. Adding weight to the sellers’ position is daily price fading supply at 26536-26200 in the form of a bearish pin-bar candlestick pattern. The next downside target on the daily remains sited nearby around support at 25822.
Areas of consideration:
Traders who read Tuesday’s report may recall the piece underlining a possible sell, basing entry and risk levels off the daily bearish pin-bar pattern. Well done to any of our readers who remain short, as traders have more than a 1:1 risk/reward ratio to the daily support level mentioned above at 25822, which came close to being achieved yesterday.
Intraday movement may witness a reaction take shape off the H4 Quasimodo support mentioned above at 25788 at the point where it fuses with its aforementioned trend line support (yellow). Note 25788 also merges closely with a 50.0% support value at 25759 and is located just beneath daily support at 25822. For traders considering a long play off 25788, waiting for additional confirmation is recommended, as let’s bear in mind where we’re trading from on the weekly timeframe.
Today’s data points: FOMC Member Clarida Speaks; US Advance GDP q/q; US Advance GDP Price Index q/q; Chicago PMI.
XAU/USD (GOLD):
Outlook remains unchanged.
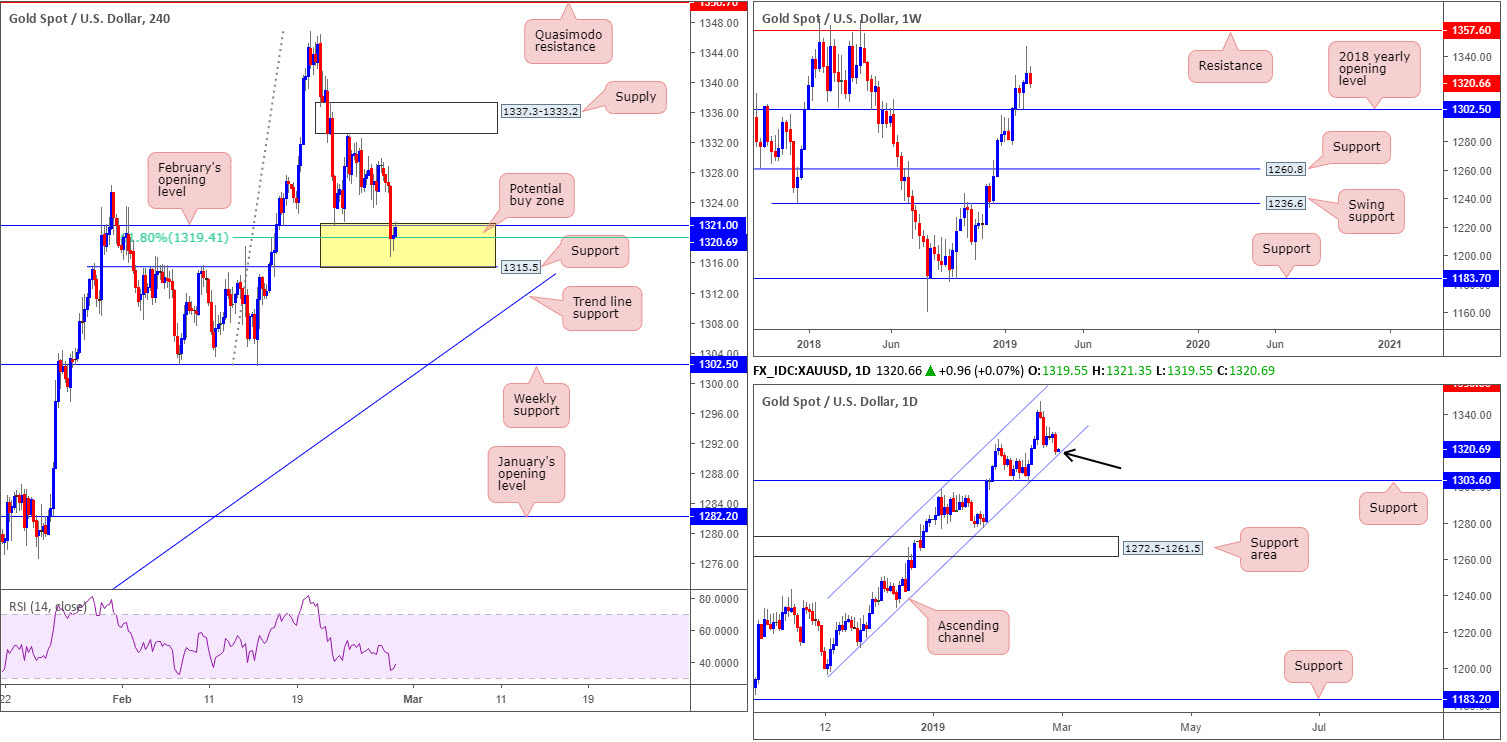
Having seen the greenback regain 96.00 to the upside Wednesday, this pressured the yellow metal lower, down 0.69% on the day.
Notable movement drawn out of the recent bout of selling is daily price shaking hands with channel support (extended from the low 1196.4). This long-term ascending channel has been in operation since November 2018. What’s also interesting is H4 action driving into a rather interesting area of support (yellow) at 1315.5/1321.0 (comprised of H4 support at 1315.5, the 61.8% H4 Fibonacci support value at 1319.4 and February’s opening level at 1321.0).
The combination of daily and H4 structure will likely entice buyers into the market today. The only grumble is weekly price shows room to press beyond the H4 buy zone towards its 2018 yearly opening level at 1302.5.
Areas of consideration:
With the above in mind, traders may find use in the yellow zone marked on the H4 timeframe at 1315.5/1321.0 as a possible buy zone today.
Despite 1315.5/1321.0 housing reasonably attractive confluence, do bear in mind, as highlighted above, weekly price shows room to potentially press beyond this area. For that reason, waiting for additional forms of confirmation to take shape out of the zone is recommended before pulling the trigger. One such example is a H4 bullish candlestick signal. An alternative to this is drilling down to the lower timeframes and trading a resistance-turned support setup.
The accuracy, completeness and timeliness of the information contained on this site cannot be guaranteed. IC Markets does not warranty, guarantee or make any representations, or assume any liability with regard to financial results based on the use of the information in the site.
News, views, opinions, recommendations and other information obtained from sources outside of www.icmarkets.com.au, used in this site are believed to be reliable, but we cannot guarantee their accuracy or completeness. All such information is subject to change at any time without notice. IC Markets assumes no responsibility for the content of any linked site. The fact that such links may exist does not indicate approval or endorsement of any material contained on any linked site.
IC Markets is not liable for any harm caused by the transmission, through accessing the services or information on this site, of a computer virus, or other computer code or programming device that might be used to access, delete, damage, disable, disrupt or otherwise impede in any manner, the operation of the site or of any user’s software, hardware, data or property.


