
Key risk events today:
German Prelim CPI m/m; US Final GDP q/q.
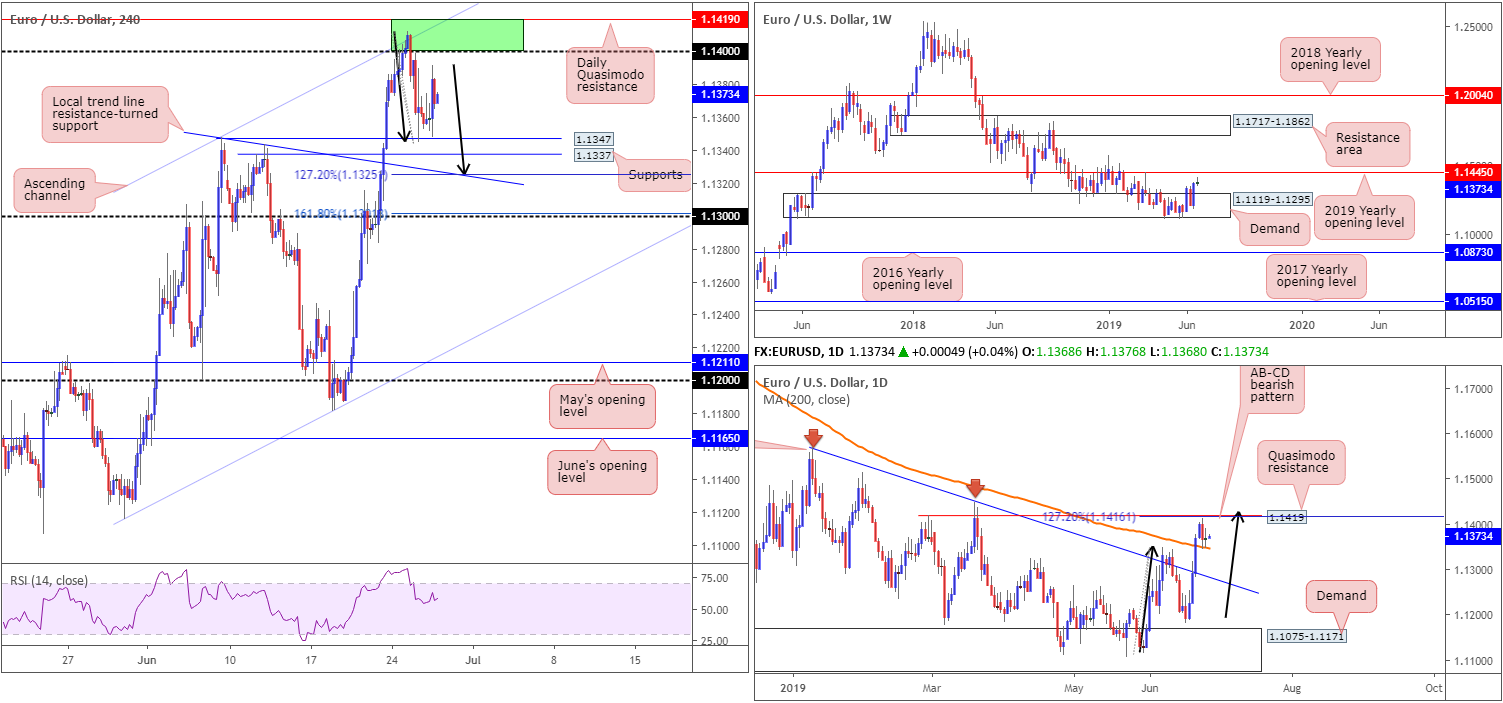
EUR/USD:
EUR/USD prices head into Asia Pac hours unchanged, by way of a clear-cut daily indecision candle. Macroeconomic data out of the US was largely ignored Wednesday – durable goods orders declined in May 1.3%, with core durable goods orders rising 0.3%. Technically speaking, the US dollar index, or DXY, remains hovering north of its 96.00 handle.
The general tone on the weekly timeframe remains a cautious one. Despite recovering strongly out of a long-standing demand at 1.1119-1.1295, nearby resistance is seen at 1.1445 (the 2019 yearly opening level) and the overall trend remains facing a southerly bearing since topping in 2018.
Daily movement, on the other hand, is sandwiched between a Quasimodo resistance at 1.1419 as well as a merging 127.2% AB=CD – black arrows – bearish pattern at 1.1416, and the 200-day SMA positioned close by at 1.1348ish.
A closer reading of price action on the H4 timeframe has the candles meandering between a collection of supports at 1.1337/1.1347 (as well as a nearby trend line resistance-turned support taken from the high 1.1347), and the round number 1.14, along with a channel resistance (extended from the high 1.1347). In addition to the H4 resistances mentioned, higher-timeframe structure adds additional weight here: daily Quasimodo resistance at 1.1419.
Areas of consideration:
There are two scenarios present this morning, according to our technical studies:
- Additional selling could bring about a H4 127.2% AB=CD completion (black arrows) at the H4 trend line resistance-turned support highlighted above (1.1325). This, given the close connection with the 200-day SMA on the daily timeframe, underscores a potential long opportunity with stop-loss placement best set beyond the 161.8% extension point at 1.1301.
- Another reaction from the H4 green resistance area at 1.1419/1.14 may develop should we push for higher ground, though traders are urged to wait for additional candlestick confirmation before pulling the trigger (entry/risk levels can be determined according to the candlestick’s structure) for two reasons. Firstly, the area has already been ‘used’ and secondly let’s remember the weekly timeframe shows room to press north towards 1.1445.
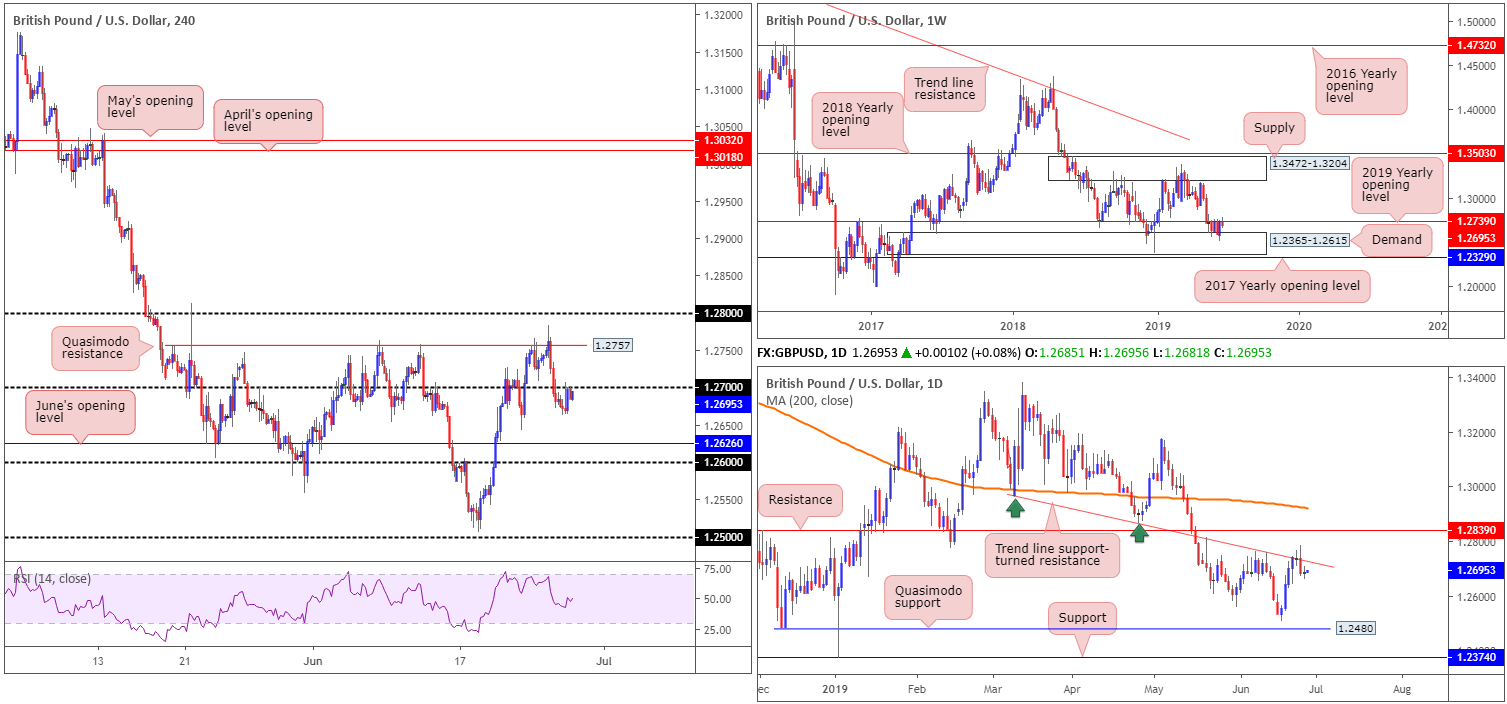
GBP/USD:
Outlook unchanged.
GBP/USD action Wednesday observed limited movement, hugging the underside of its 1.27 handle (H4) as traders await fresh impetus. For those who read previous reports may recall some readers are likely short the H4 Quasimodo resistance at 1.2757. This was largely due to its surrounding confluence: the daily trend line resistance extended from the low 1.2960 and the 2019 yearly opening level on the weekly timeframe at 1.2739.
As highlighted in Wednesday’s briefing, the next support target on the H4 timeframe can be seen at June’s opening level drawn from 1.2626, followed closely by the top edge of weekly demand at 1.2615 (the next downside target on the weekly timeframe) and then the 1.26 round number.
Areas of consideration:
Also taken from Wednesday’s briefing:
For folks short the GBP, reducing risk to breakeven and taking partial profits off the table might be an idea at this point. With a little help from 1.27 serving as resistance, however, the next take-profit target: June’s opening level at 1.2626 may enter the fold today.
In addition to the above, selling the retest of 1.27 could be an opportunity to pyramid the current short position from 1.2757, targeting the said H4 supports mentioned above. At this time, according to H4 candlestick structure, though, we have limited evidence sellers want to take things lower, therefore it may be best to sit tight and wait for a bearish candlestick formation to develop before committing additional funds.
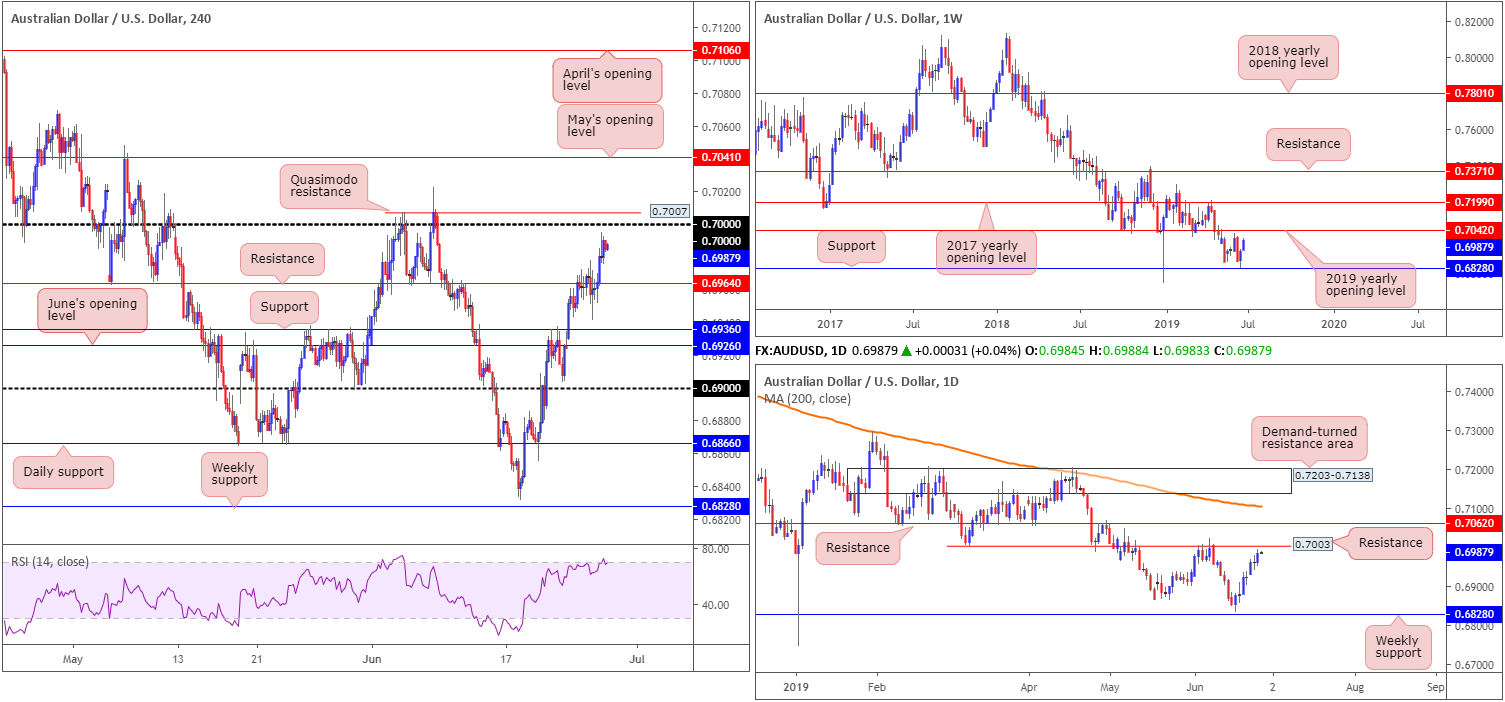
AUD/USD:
Outlook unchanged.
Comments from the US Treasury Secretary Mnuchin stating that before talks broke off, negotiators were 90% there on a deal, and with US President Trump, in a wide-ranging interview with Fox Business, confirming remarks from the Treasury Secretary, witnessed the Australian dollar extend gains vs. its US counterpart Wednesday.
Up 0.35%, the AUD/USD’s H4 candles settled just south of the key figure 0.70, shadowed closely by a Quasimodo resistance at 0.7007. What’s also notable from a technical perspective is the daily timeframe displays resistance parked at 0.7003. While a short from 0.70 is appealing, traders may also want to acknowledge our weekly timeframe analysis posted in Monday’s weekly briefing, suggesting we could potentially move beyond 0.70 to 0.7042:
Over the course of last week’s sessions, price action came within a couple of points of connecting with notable support pencilled in at 0.6828 (a level offering history as far back as mid-2003) before rotating higher. Adding more than 50 points, and likely sparking buyer interest, further upside could be on the cards this week, with an initial objective set at the 2019 yearly opening level 0.7042.
Areas of consideration:
A sell from 0.70 is certainly a possibility today, knowing we have the following confluence: a H4 Quasimodo resistance level at 0.7007 and a daily resistance at 0.7003. Although the threat of further upside beyond 0.70 is present on the weekly timeframe to 0.7042, a short from 0.70 remains valid.
Those concerned by weekly structure could opt to wait for additional confirmation before pulling the trigger, formed by way of a H4 or H1 bearish candlestick signal. Not only does the bearish candlestick signal identify seller intent, it also helps traders locate entry and risk levels to work with.
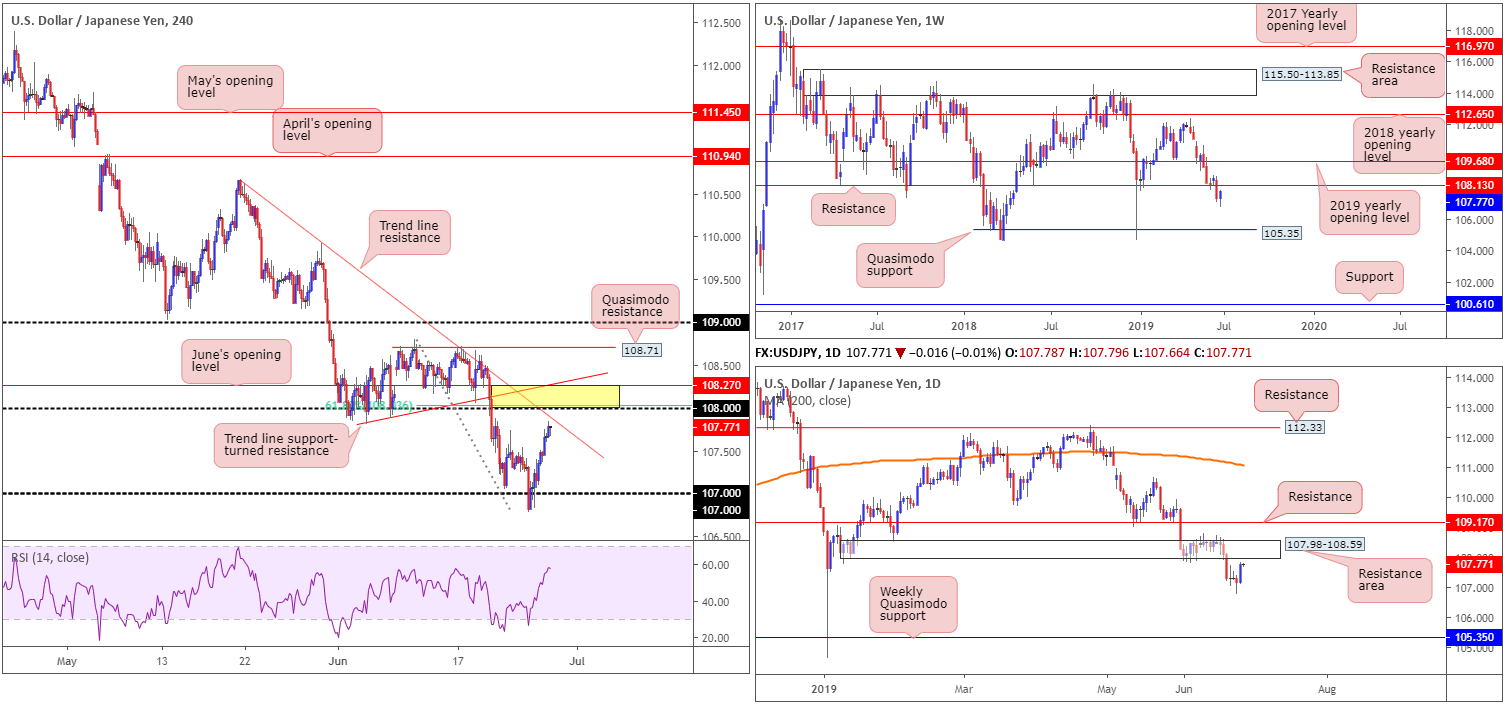
USD/JPY:
Outlook unchanged.
USD/JPY bulls entered an offensive phase Wednesday, boosted on the back of comments from US President Trump regarding trade with China and the 10-year US Treasury bond yield gaining traction to reveal strong risk appetite. As is evident from the H4 timeframe, price action settled just south of a trend line resistance extended from the high 110.67. Although a reaction could be observed from this angle today, focus remains on the H4 resistance area marked in yellow at 108.27/108 (comprised of June’s opening level at 108.27, a 61.8% Fibonacci resistance at 108.03, round number 108 and an intersecting trend line support-turned resistance (taken from the low 107.81).
What’s also notable regarding 108.27/108 is the underside of a daily resistance area at 107.98-108.59 provides higher-timeframe confluence, as does weekly resistance at 108.13.
Areas of consideration:
As highlighted in Wednesday’s briefing:
Having seen limited higher-timeframe support bolster the recent move higher, as well as a collection of H4 resistances present overhead, entering long in this market is a chancy move, according to our technical reading.
Although we may observe a rotation lower before reaching the H4 resistance area highlighted above at 108.27/108, this area has ‘sell me’ written all over it, given its confluence. Therefore, the main focus today will be at this zone for possible shorting opportunities. Stop-loss orders can be tucked above 108.27 by a couple of points with entry coming in at 108.
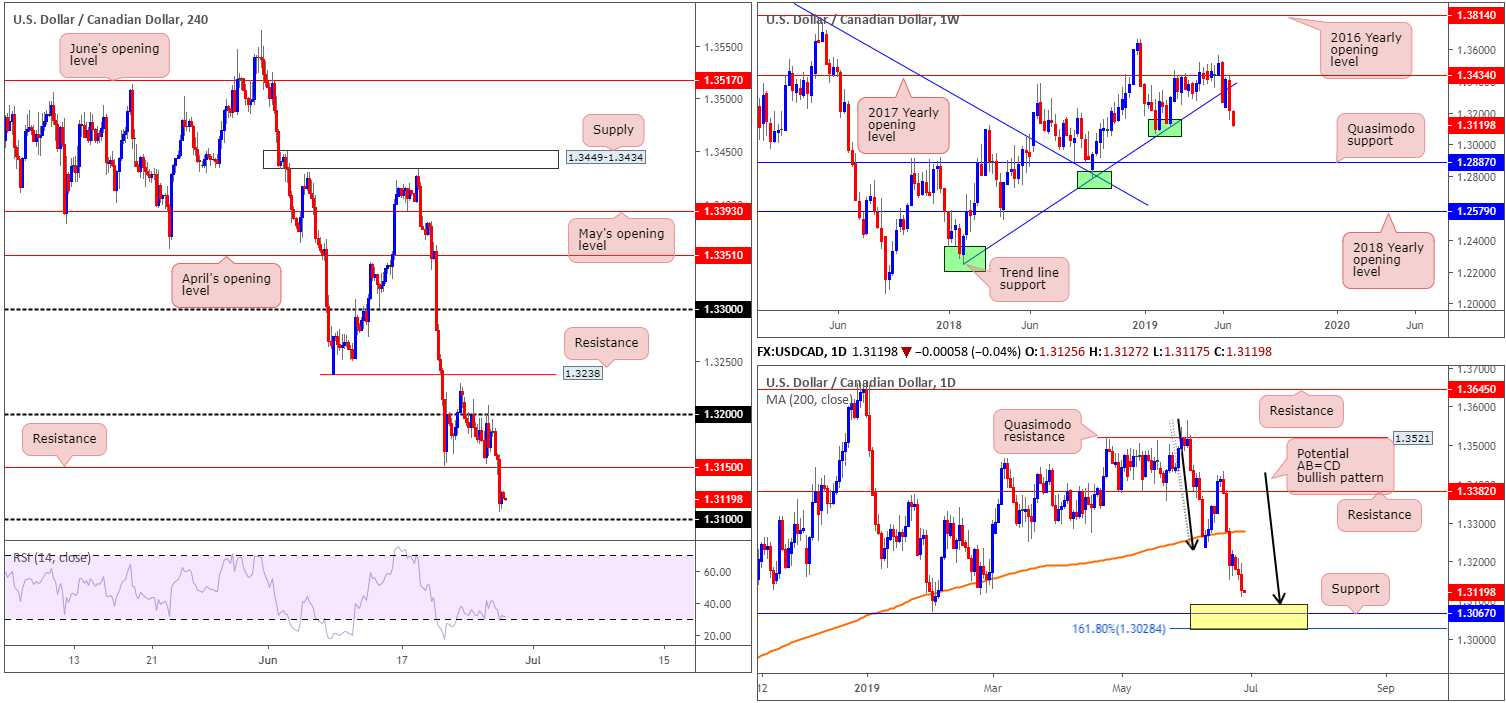
USD/CAD:
Oil markets moved decisively higher Wednesday on the back of some chunky drawdowns in US energy inventories. This increased demand for the Canadian dollar and, therefore, weighed on the USD/CAD pair. Down 0.33%, the H4 candles concluded the day bottoming just north of the 1.31 handle, after consuming support at 1.3150 (now acting resistance).
Higher-timeframe analysis, as highlighted in previous reports remains biased to the downside:
From the weekly timeframe, we can see that since coming within two points of the 2017 yearly opening level at 1.3434 (resistance), the pair reclaimed trend line support (extended from the low 1.2247) in strong fashion last week. Limited demand is visible to the left of current price, therefore the possibility of further downside this week is in store, targeting Quasimodo support at 1.2887.
A closer reading of price action on the daily timeframe recently observed a decisive close beneath the 200-day SMA and opened the door for a possible run to a support area fixed between 1.3028/1.3089 (yellow). Comprised of an AB=CD (black arrows) formation at 1.3089, a support at 1.3067 and a 161.8% Fibonacci extension at 1.3028 (forms part of the AB=CD structure), this area likely has enough confluence to hold price should we reach this far south this week.
Areas of consideration:
As a result of recent selling, focus shifts to the 1.31 handle as potential support today. However, the research team stress the importance of including the daily support area at 1.3028/1.3089 within your analysis. This area, as underlined above, consists of strong daily supportive structures and, therefore, offers a potential platform for buyers today.
Conservative traders threatened by the weekly timeframe suggesting lower prices may opt to wait and see if a reaction takes shape out of 1.3028/1.3089 and a H4 close forms above 1.31. This acts as confirmation buyers are interested in this zone and may take things higher from here and, thus could be a good opportunity to buy this market.
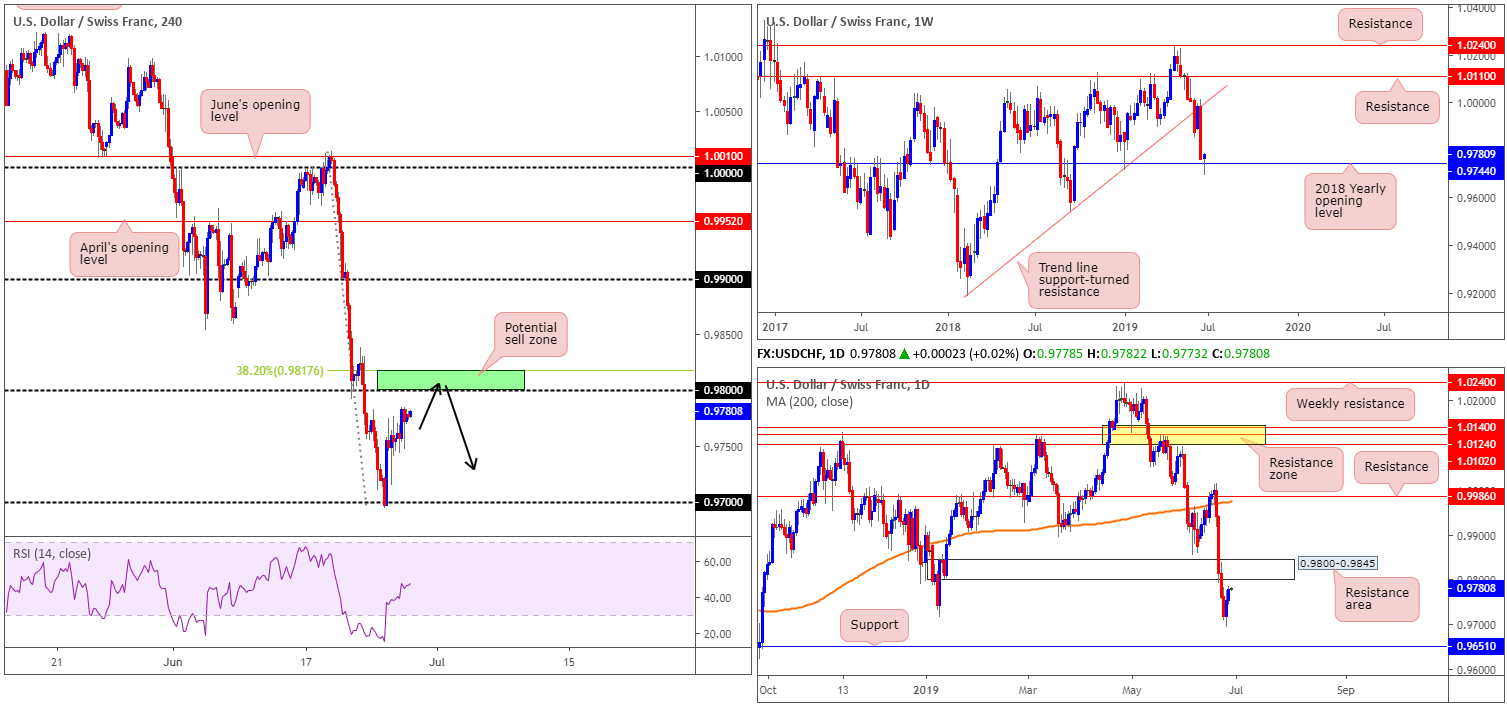
USD/CHF:
Outlook unchanged.
Improved risk sentiment undermined the Swiss franc’s safe-haven status Wednesday, though traders refrained from initiating aggressive positions ahead of Trump-Xi meeting later this week.
Up 0.24% and recording its second consecutive daily gain, the USD/CHF pair appears to be making some headway north of weekly support by way of a 2018 yearly opening level at 0.9744. However, while weekly players may be optimistic, daily structure reveals a possible hurdle lurks ahead in the shape of a resistance area coming in at 0.9800-0.9845.
What’s also of interest regarding the aforementioned daily resistance area is the 0.98 handle, which happens to merge closely with a 38.2% H4 Fibonacci resistance at 0.9817 (green zone).
Areas of consideration:
In light of the above reading, Wednesday’s outlook remains unchanged:
Although a short from 0.9817/0.98 (green zone on the H4 timeframe) is appealing, given the convergence of daily structure, weekly support re-entered the fight at 0.9744.
Does this mean a sell from 0.9817/0.98 is invalid? Definitely not. All it means is traders concerned by the threat of further upside materialising on the weekly timeframe may opt to wait and see how H4 action behaves once the noted sell zone enters the mix. A H4 bearish candlestick signal – think shooting star of engulfing formation – for example, not only identifies seller intent at an area of interest, it also provides entry and risk levels to trade with. Therefore, a short, in this case, would be high probability, potentially targeting 0.97.
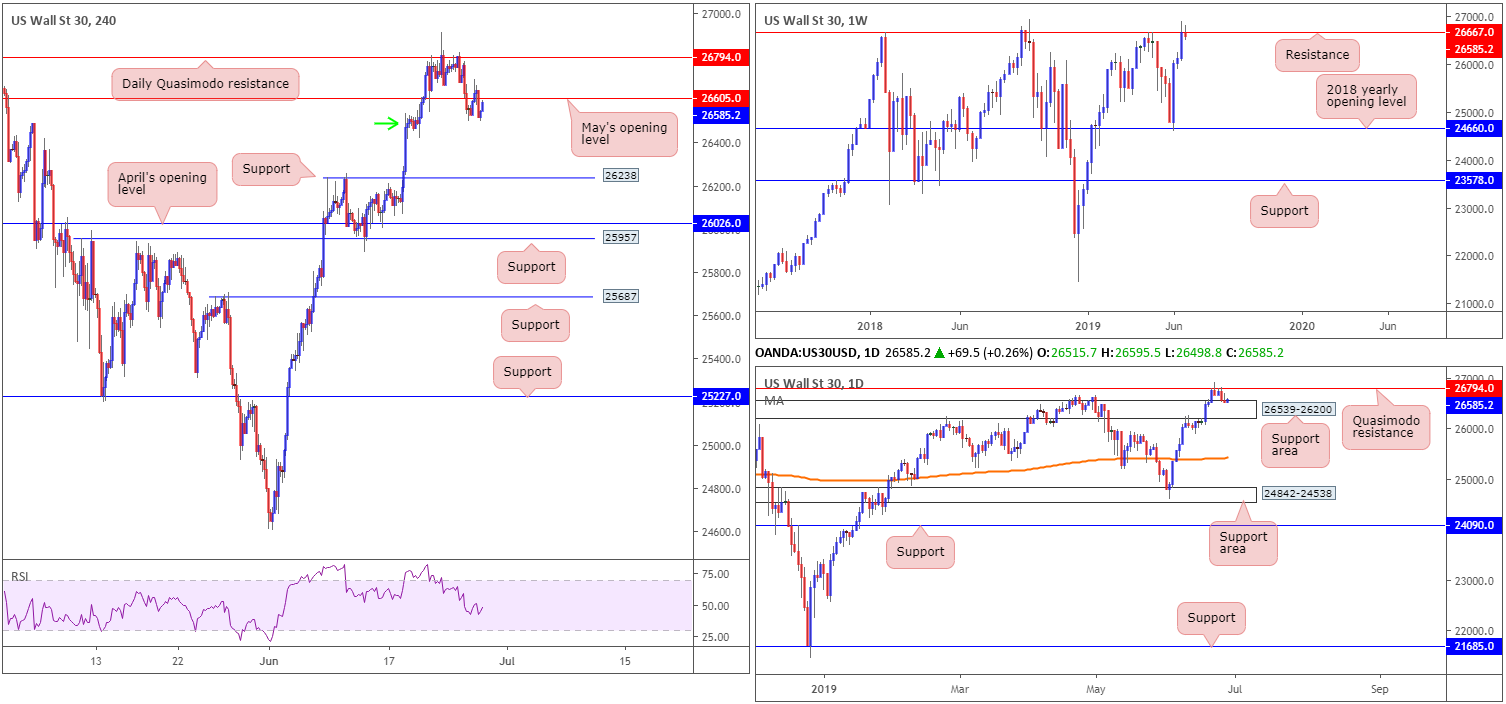
Dow Jones Industrial Average:
Outlook unchanged.
US equities closed slightly lower on Wall Street Wednesday after an early rally fuelled by optimism over the next round of trade talks between the US and China lost momentum towards the end of the day. The Dow Jones Industrial Average slipped 0.04%; the S&P 500 also declined 0.12% while the tech-heavy Nasdaq advanced 0.47%.
From a technical perspective, the DJIA remains beneath weekly resistance at 26667.Limited support is visible, therefore further selling on this timeframe could develop. Daily Quasimodo resistance at 26794 also held ground in recent trading, though appears somewhat hampered by a nearby daily support area coming in at 26539-26200.
A closer reading of price action on the H4 timeframe has the candles trading sub May’s opening level at 26605. According to our technical studies, sellers are struggling to press lower from here due to the aforementioned daily support area and local H4 demand coming in around 26540 (green arrow).
Areas of consideration:
As has been the case since the beginning of the week, our technical studies reveal a conflict of signals between timeframes at the moment. On the one hand, weekly sellers are attempting to potentially push lower below its resistance at 26667, though on the other hand, daily players are defending a support area at 26539-26200. In situations such as this the higher-timeframe structure usually takes precedence, but given the trend is strongly pointing north, selling based on weekly structure is a challenge.
Therefore, in similar fashion to Wednesday’s outlook, unless you’re comfortable trading against a potential opposing force, opting to remain on the sidelines until clearer price action is visible is still worth considering.
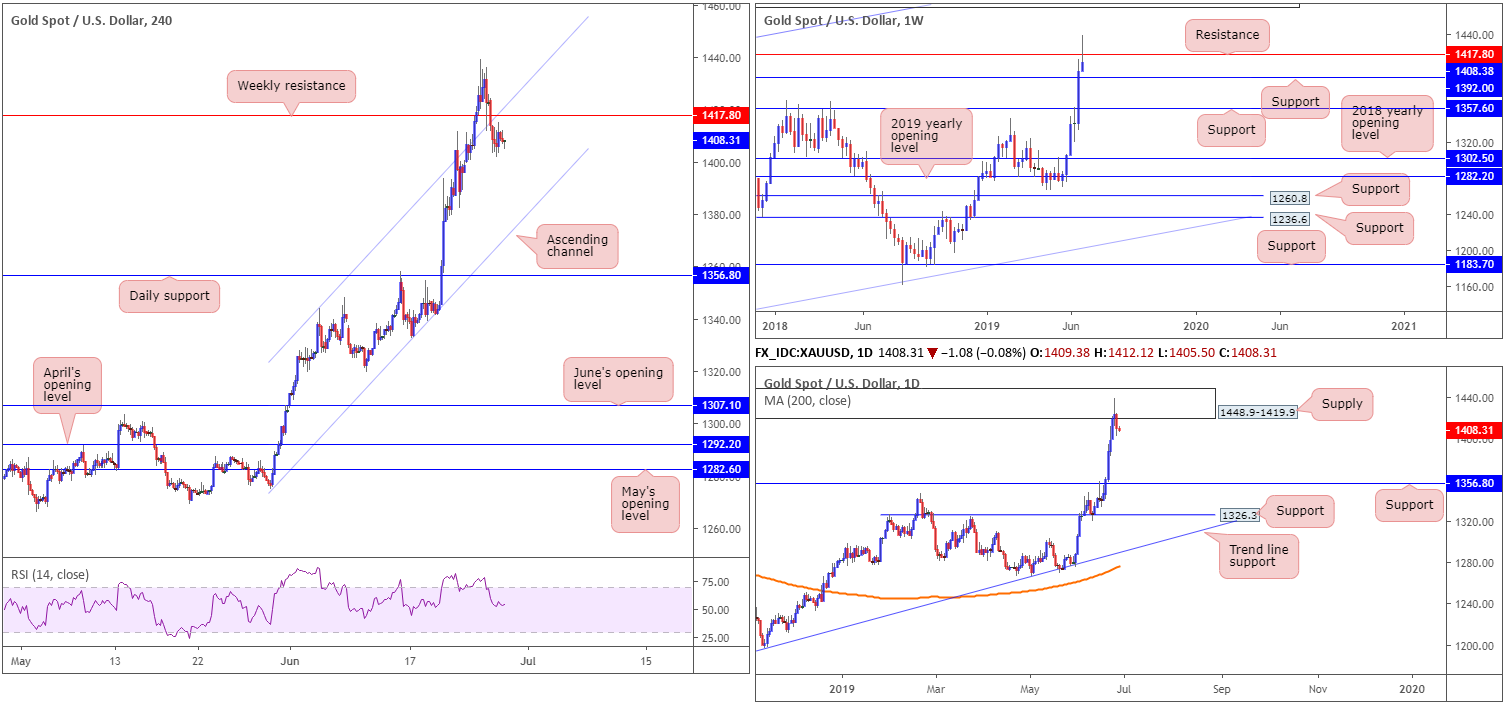
XAU/USD (GOLD):
Outlook unchanged.
Gold price movement, in $ terms, remained somewhat limited Wednesday as we headed into the close of trade. With that being the case, much of the following report will echo similar thoughts put forward in Wednesday’s briefing.
Weekly resistance at 1417.8, despite a recent move to highs at 1439.1, is seen holding ground, with the next downside hurdle set at weekly support drawn from 1392.0. The said weekly resistance also boasts a reasonably strong buffer zone on the daily timeframe by way of a supply at 1448.9-1419.9. Drawn from mid-2013, and holding price lower on two occasions since then, active sellers clearly inhabit this region, with a downside target set at support fixed from 1356.8.
On the H4 timeframe, traders can see the candles re-entered an ascending channel formation in recent hours, perhaps leading to follow-through selling towards channel support taken from the low 1274.8. Before reaching this far south, though, a break of the weekly support at 1392.0 would need to be seen.
Areas of consideration:
According to the above reading, further selling could be in store today. A retest at weekly resistance mentioned above at 1417.8 may be of interest to some traders today, targeting weekly support at 1392.0. Given the strong uptrend the yellow metal is in right now, however, it may be an idea to consider waiting for additional H4 candlestick confirmation to form before pulling the sell trigger (entry/risk levels can be determined according to the candlestick’s arrangement).
The accuracy, completeness and timeliness of the information contained on this site cannot be guaranteed. IC Markets does not warranty, guarantee or make any representations, or assume any liability with regard to financial results based on the use of the information in the site.
News, views, opinions, recommendations and other information obtained from sources outside of www.icmarkets.com.au, used in this site are believed to be reliable, but we cannot guarantee their accuracy or completeness. All such information is subject to change at any time without notice. IC Markets assumes no responsibility for the content of any linked site. The fact that such links may exist does not indicate approval or endorsement of any material contained on any linked site.
IC Markets is not liable for any harm caused by the transmission, through accessing the services or information on this site, of a computer virus, or other computer code or programming device that might be used to access, delete, damage, disable, disrupt or otherwise impede in any manner, the operation of the site or of any user’s software, hardware, data or property.


