Waiting for lower timeframe confirmation is our main tool to confirm strength within higher timeframe zones, and has really been the key to our trading success. It takes a little time to understand the subtle nuances, however, as each trade is never the same, but once you master the rhythm so to speak, you will be saved from countless unnecessary losing trades. The following is a list of what we look for:
- A break/retest of supply or demand dependent on which way you’re trading.
- A trendline break/retest.
- Buying/selling tails/wicks – essentially we look for a cluster of very obvious spikes off of lower timeframe support and resistance levels within the higher timeframe zone.
- Candlestick patterns. We tend to stick with pin bars and engulfing bars as these have proven to be the most effective.
We typically search for lower-timeframe confirmation between the M15 and H1 timeframes, since most of our higher-timeframe areas begin with the H4. Stops are usually placed 1-3 pips beyond confirming structures.
EUR/USD:
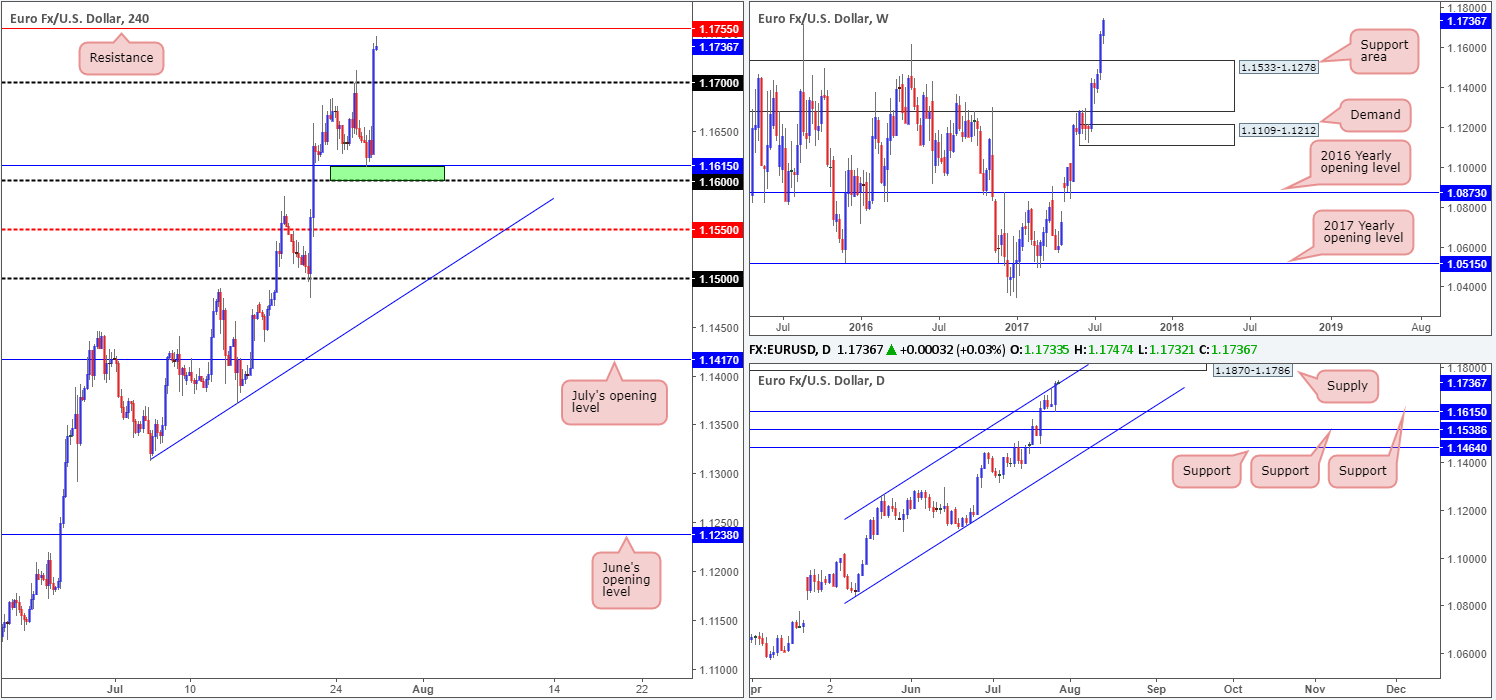
For those who read Wednesday’s report you may recall our team highlighting the green H4 area at 1.16/1.1615 as a potential buy zone. The area comprised of a psychological band at 1.16, a H4 38.2% Fib support level at 1.1606 pegged from the low 1.1479 and a daily support at 1.1615.
As can be seen from the chart the zone responded beautifully, and was made stronger after the Federal Reserve decided to leave interest rates unchanged, as expected. With offers likely cleared from 1.17, we’re likely going to be crossing swords with H4 resistance at 1.1755 sometime today.
Also of particular interest, daily price ended the day marginally closing above the upper channel resistance line extended from the high 1.1263, and chalked in a reasonably strong-looking bullish candle. In the event that this move has cleared the majority of offers here, the next area of interest can be seen around a supply zone located nearby at 1.1870-1.1786.
Our suggestions: As price is nearing the underside of a major daily supply right now, we feel upside momentum may begin to diminish. In fact, we would refrain from taking any long positions at this time given that the unit is now only inches away from the noted H4 resistance which happens to sit only thirty pips beneath the current daily supply. Therefore, at least for the time being, our desk will remain on the sidelines.
Data points to consider: US Core durable goods numbers and US Weekly unemployment claims at 1.30pm GMT+1.
Levels to watch/live orders:
- Buys: Flat (stop loss: N/A).
- Sells: Flat (stop loss: N/A).
GBP/USD:
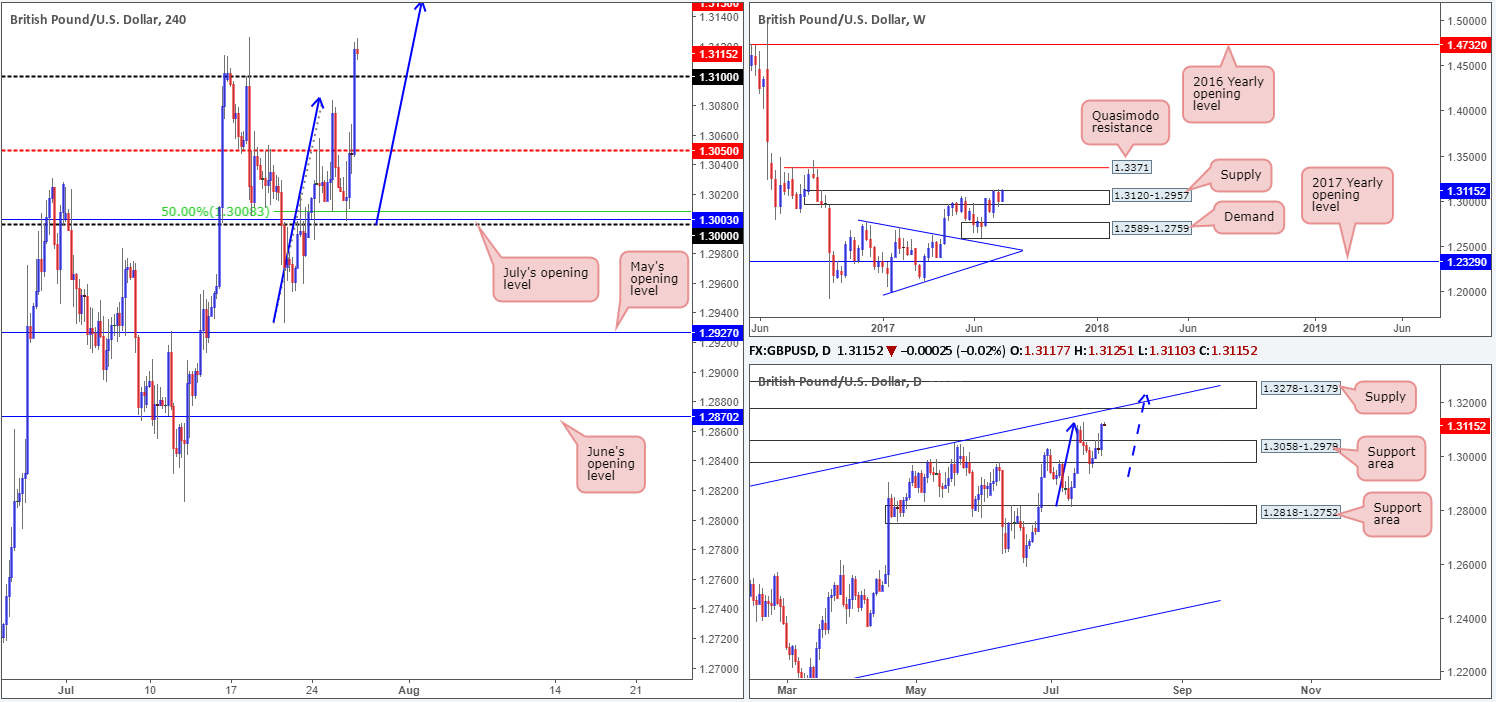
During the course of Wednesday’s sessions, the GBP/USD retested the 1.30 neighborhood and was met by strong buying pressure (influenced by the Fed’s decision to leave interest rates unchanged). In yesterday’s report, we placed 1.30 under the spotlight given that it fused nicely with July’s opening level at 1.3003 and a 50.0% support at 1.3008 taken from the low 1.2932. Well done to any of our readers who managed to jump in on this move.
With H4 price now clear above the 1.31 handle, we feel it’s reasonable to assume that the mid-level number 1.3150 will likely be the next target in the firing range today. What’s also notable here is the approach: there is a nice-looking AB=CD bearish formation taking shape which terminates at exactly 1.3150 (see blue arrows).
Over on the bigger picture, the weekly candles remain trading around the upper edge of a supply zone pegged at 1.3120-1.2957, suggesting weakness in the sellers’ camp right now. On the other side of the field, however, the daily chart shows price action to be trading from a support area coming in at 1.3058-1.2979. What’s also interesting on this scale is the potential AB=CD bearish pattern that completes within the supply zone marked at 1.3278-1.3179 that converges with a channel resistance line drawn from the high1.2774.
Our suggestions: Although we believe a bounce will be seen from 1.3150 today, the market will likely look to strive to reach the 1.3180 mark since this price level represents the underside of the said DAILY supply and channel resistance line, which could, if it falls within your trading parameters, be a nice zone to look for shorts.
Data points to consider: US Core durable goods numbers and US Weekly unemployment claims at 1.30pm GMT+1.
Levels to watch/live orders:
- Buys: Flat (stop loss: N/A).
- Sells: 1.3180 region ([waiting for a H4 bear candle to form – preferably a full, or near-full-bodied candle – before pulling the trigger is advised] stop loss: ideally beyond the candle’s wick).
AUD/USD:
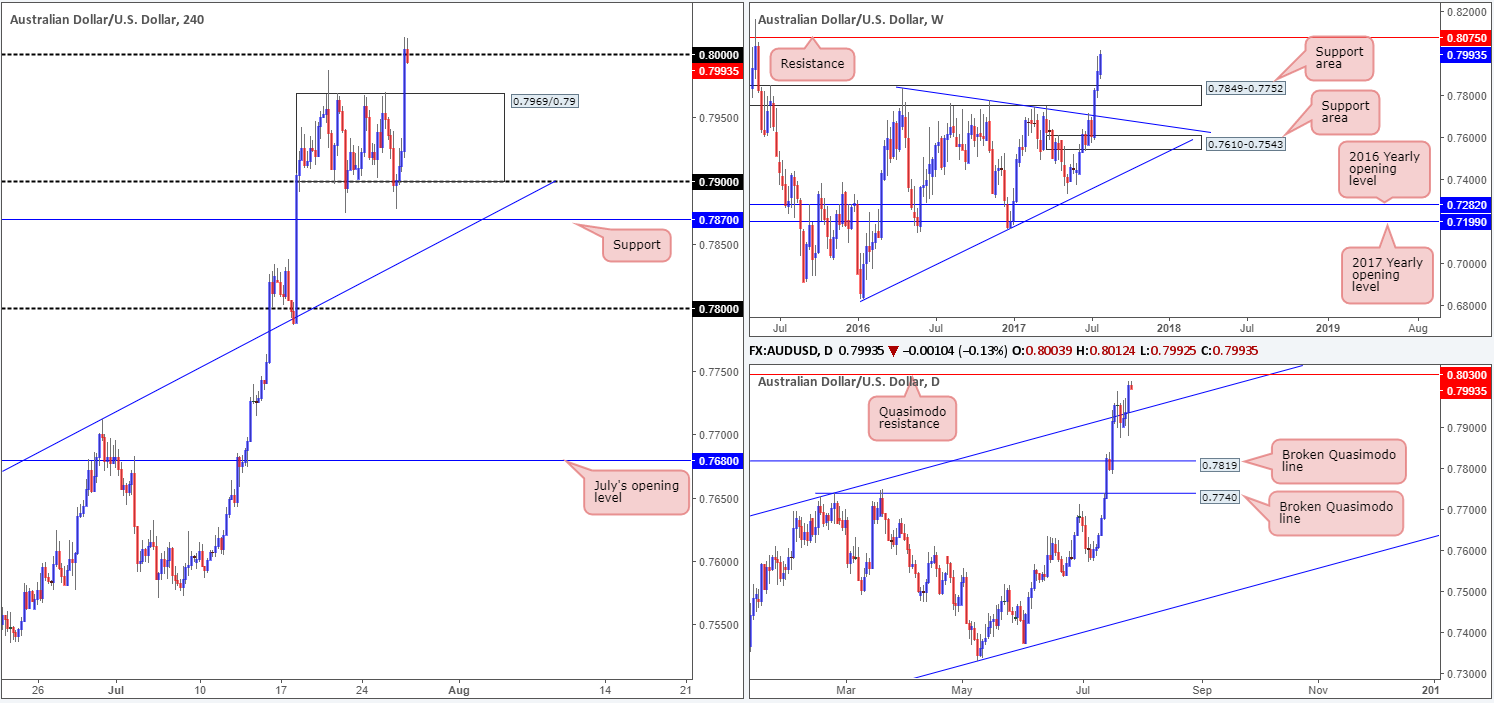
In recent trading, the commodity currency rallied to the upside following the Fed’s decision to leave interest rates unchanged. The move lifted H4 price out of its range at 0.7969/0.79, and is now seen aggressively challenging the large psychological band 0.80.
Weekly action on the other hand, shows there’s space for the unit to advance up to resistance marked at 0.8075. Down on the daily timeframe, nevertheless, the candles have now relocated above the channel resistance line taken from the high 0.7732, and opened up the possibility of a move being seen towards a nearby Quasimodo resistance at 0.8030.
Our suggestions: With 0.80 being a watched number in the market, there was likely a truckload of stop-loss orders (buy stops) triggered above this number in recent hours. This may be enough liquidity for the big boys to sell this market back down to the top edge of the H4 range at 0.7969. However, this is not something our team would feel comfortable trading, due to the room seen to advance higher on the bigger picture.
Ultimately, we have decided to wait and see if price can drive north into the 0.8075/0.8030 area (weekly resistance/daily Quasimodo resistance) and then go about looking to sell this market (a slightly different outlook from Wednesday).
Data points to consider: US Core durable goods numbers and US Weekly unemployment claims at 1.30pm GMT+1.
Levels to watch/live orders:
- Buys: Flat (stop loss: N/A).
- Sells: 0.8075/0.8030 ([waiting for a H4 bear candle to form – preferably a full, or near-full-bodied candle – before pulling the trigger is advised] stop loss: ideally beyond the candle’s wick)
USD/JPY:
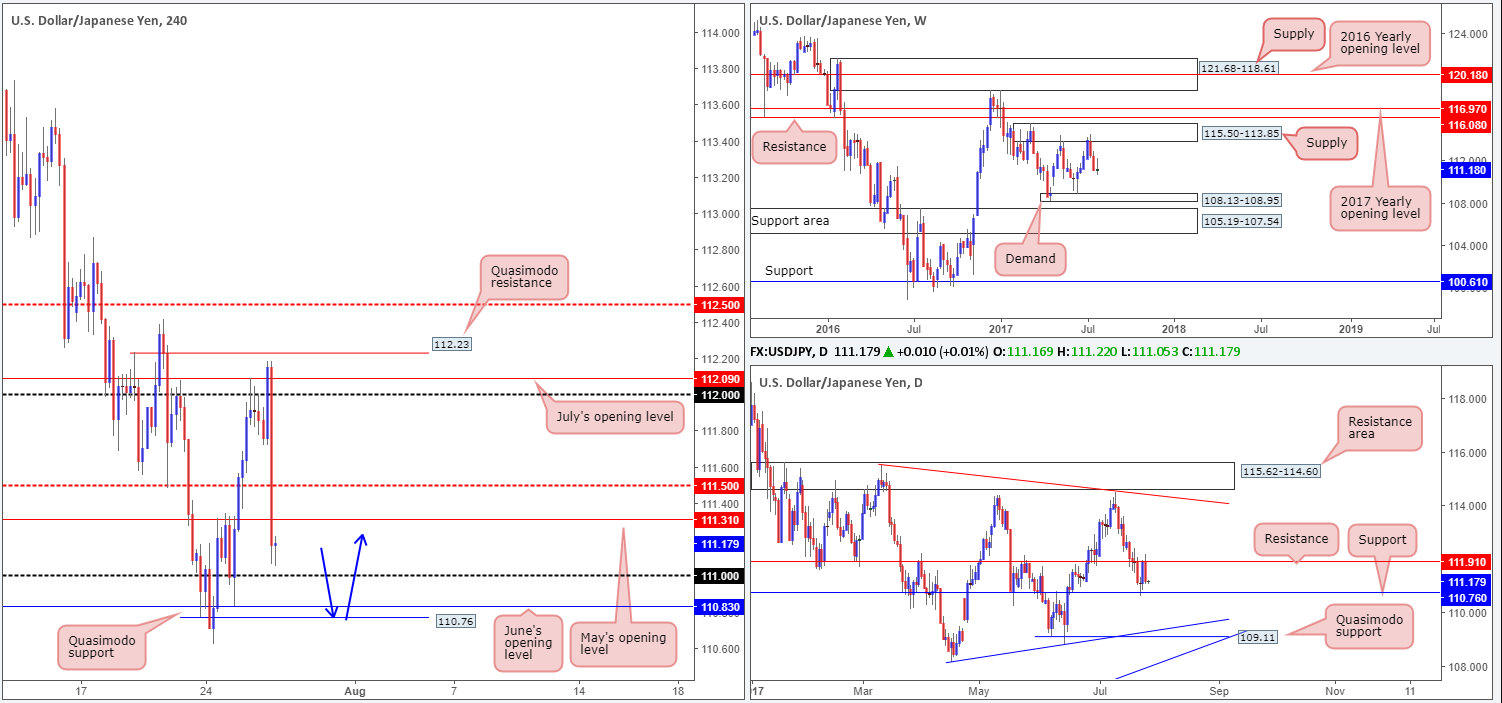
Beginning this morning’s report with a look at the weekly timeframe, we can see that the unit is ranging between supply at 115.50-113.85 and demand at 108.13-108.95. Along similar lines, daily price is also seen sandwiched between support coming in at 110.76 and resistance at 111.91.
Looking across to the H4 candles, the market failed to generate much follow through buying above July’s opening level at 112.09 yesterday, and went on to aggressively trade lower. The move, influenced by the Fed’s decision to leave interest rates unchanged, saw price take out multiple H4 supports, before ending the day closing just ahead of the 111 handle.
Our suggestions: On account of the above notes, this is how we are looking at this market right now. The 111 handle will likely possess willing buyers who will place stops 10-20 pips beneath this number. Below 111 is June’s opening level at 110.83, shadowed closely by a Quasimodo support at 110.76. Take note that this Quasimodo also aligns perfectly with the current daily support. So, given the stops (sell stops from both buyers looking to long 111 and also sellers looking to sell the breakout) planted beneath 111, we feel the big boys will breach 111 today and look to attack the 110.76 neighborhood for a trade long. The only grumble we have here, of course, is the fact that weekly price provides little support until we reach the 108.95 region. Despite this, we still feel the odds of a bounce being seen from the 110.76 level is relatively high.
Therefore, we have placed a pending buy order at 110.77, with a stop pegged below the Quasimodo apex at 110.60. With this position requiring a 17-pip stop and the first take-profit target being set at 111, this gives us over one times our risk to the first target on this trade.
Data points to consider: US Core durable goods numbers and US Weekly unemployment claims at 1.30pm GMT+1.

Levels to watch/live orders:
- Buys: 110.77 ([pending order] stop loss: 110.60).
- Sells: Flat (stop loss: N/A).
USD/CAD:
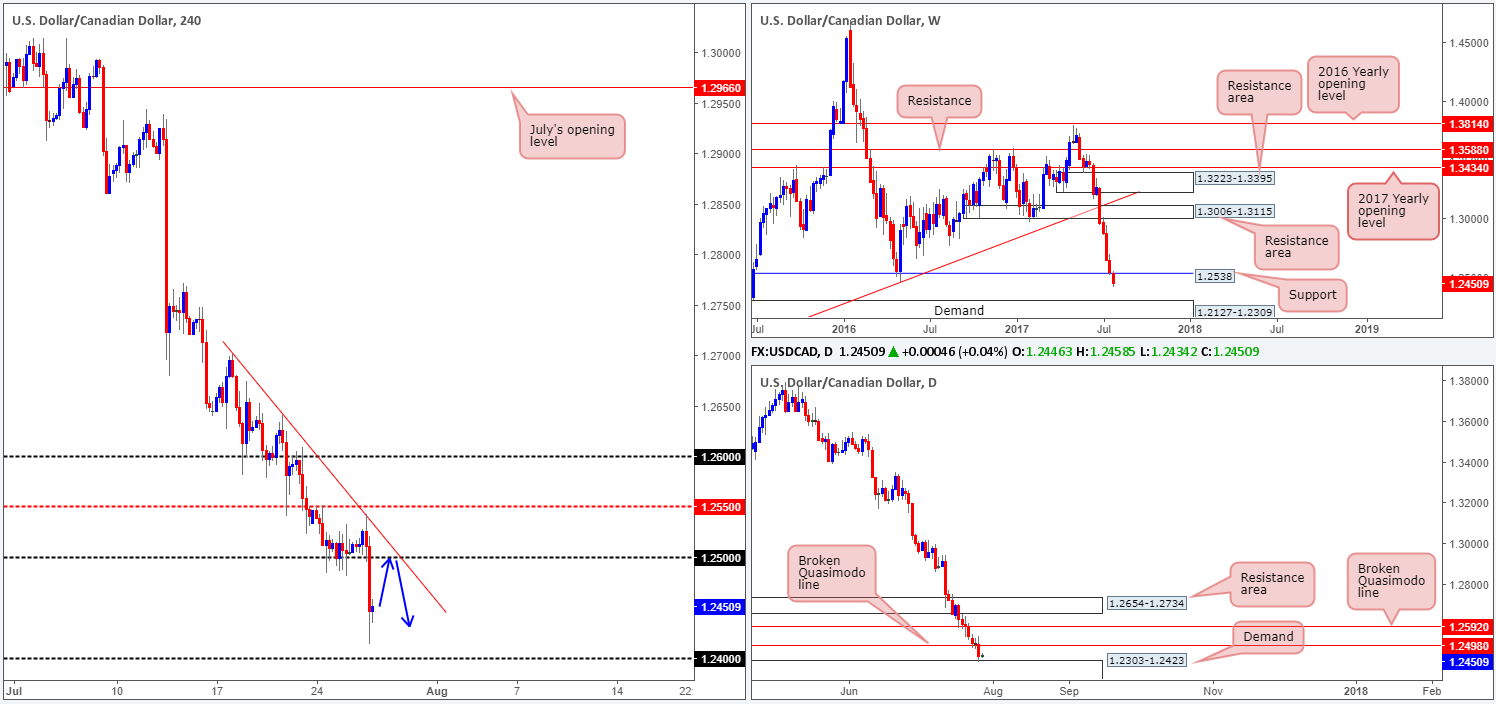
Following the FOMC statement, the USD/CAD fell sharply. The move erased bids from the 1.25 handle and went on to clock a fresh low of 1.2413 on the day. Why price found support ahead of 1.24 is likely due to the fact that daily price connected with the top edge of a demand base coming in at 1.2303-1.2423. Despite this, the bulls appear incredibly weak on the weekly timeframe at the moment. The weekly support at 1.2538 has put up little to no fight so far, therefore allowing the unit to trade a considerable distance below it!
Our suggestions: The strength of the current downtrend – coupled with the noted weekly support showing no signs of bullish intent – does not really instill much confidence for those wishing to long from the aforesaid daily demand area.
With this in mind, today’s spotlight will firmly be focused on 1.25 for a possible sell trade. 1.25 is not only a watched psychological number in this market, it is also a level that converges with a H4 trendline resistance extended from the high 1.2701 and a daily broken Quasimodo line at 1.2498.
Data points to consider: US Core durable goods numbers and US Weekly unemployment claims at 1.30pm GMT+1.
Levels to watch/live orders:
- Buys: Flat (Stop loss: N/A).
- Sells: 1.25 region ([waiting for a H4 bear candle to form – preferably a full, or near-full-bodied candle – before pulling the trigger is advised] stop loss: ideally beyond the candle’s wick).
USD/CHF:
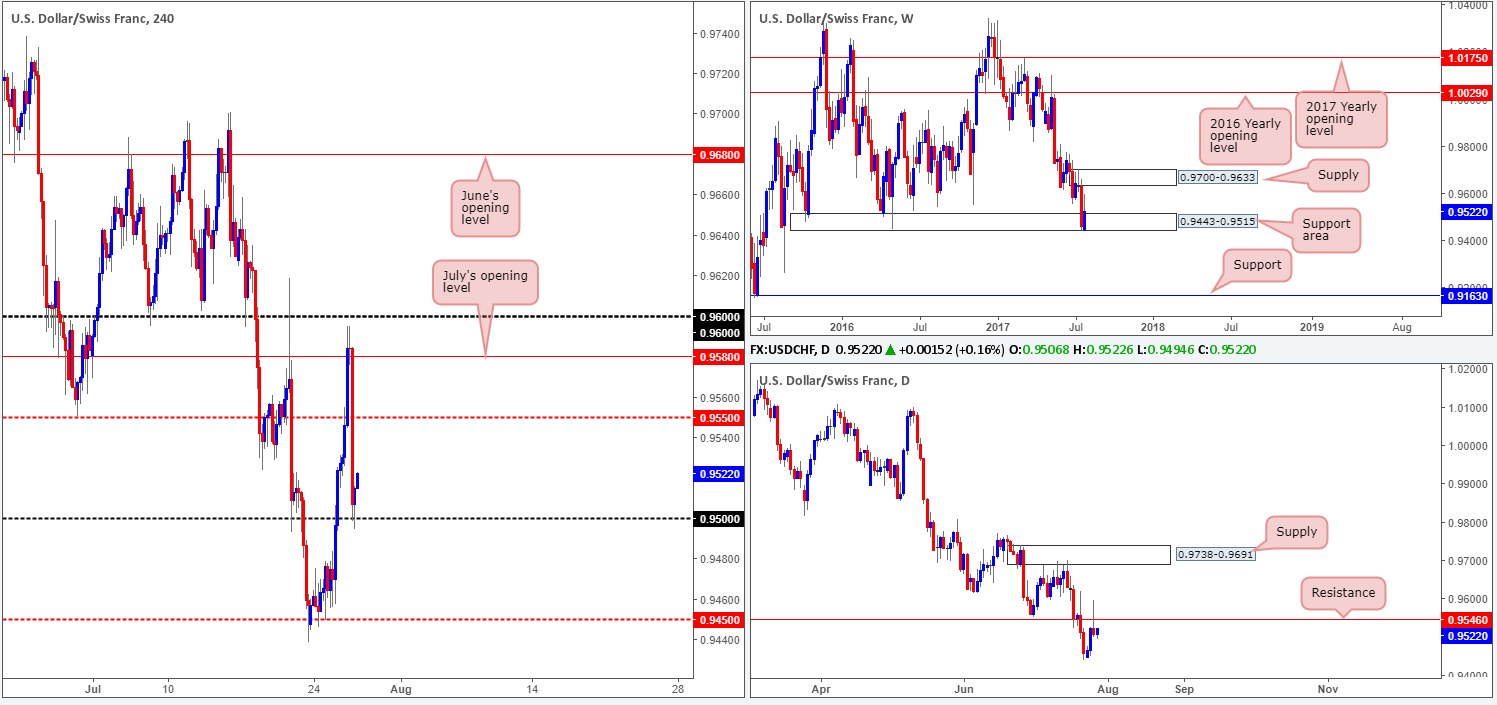
H4 price failed to sustain gains beyond July’s opening level at 0.9580 on Wednesday, after the Fed decided to leave interest rates unchanged. In one fell swoop, the H4 mid-level support at 0.9550 was aggressively taken out, leaving price free to challenge the 0.95 handle, which, for now, is holding firm.
Yesterday’s sharp move to the downside helped form a beautiful-looking daily selling wick, which, as you can see, pierced resistance at 0.9546. To a lot of traders, this will be a sell signal! However, until price has cleared the 0.96 handle, and also (for you long-term traders) the major weekly support area at 0.9443-0.9515, selling this market is difficult, in our humble opinion.
Our suggestions: Buying from 0.95, although you will be trading in-line with potential weekly flow, is challenging given the nearby daily resistance and selling wick. And, as we’ve already mentioned, selling is problematic given the 0.95 level and current weekly support area.
As far as we can see, technical elements are mixed at the moment, leaving us with little choice but to remain on the sidelines for now.
Data points to consider: US Core durable goods numbers and US Weekly unemployment claims at 1.30pm GMT+1.
Levels to watch/live orders:
- Buys: Flat (stop loss: N/A).
- Sells: Flat (stop loss: N/A).
DOW 30:
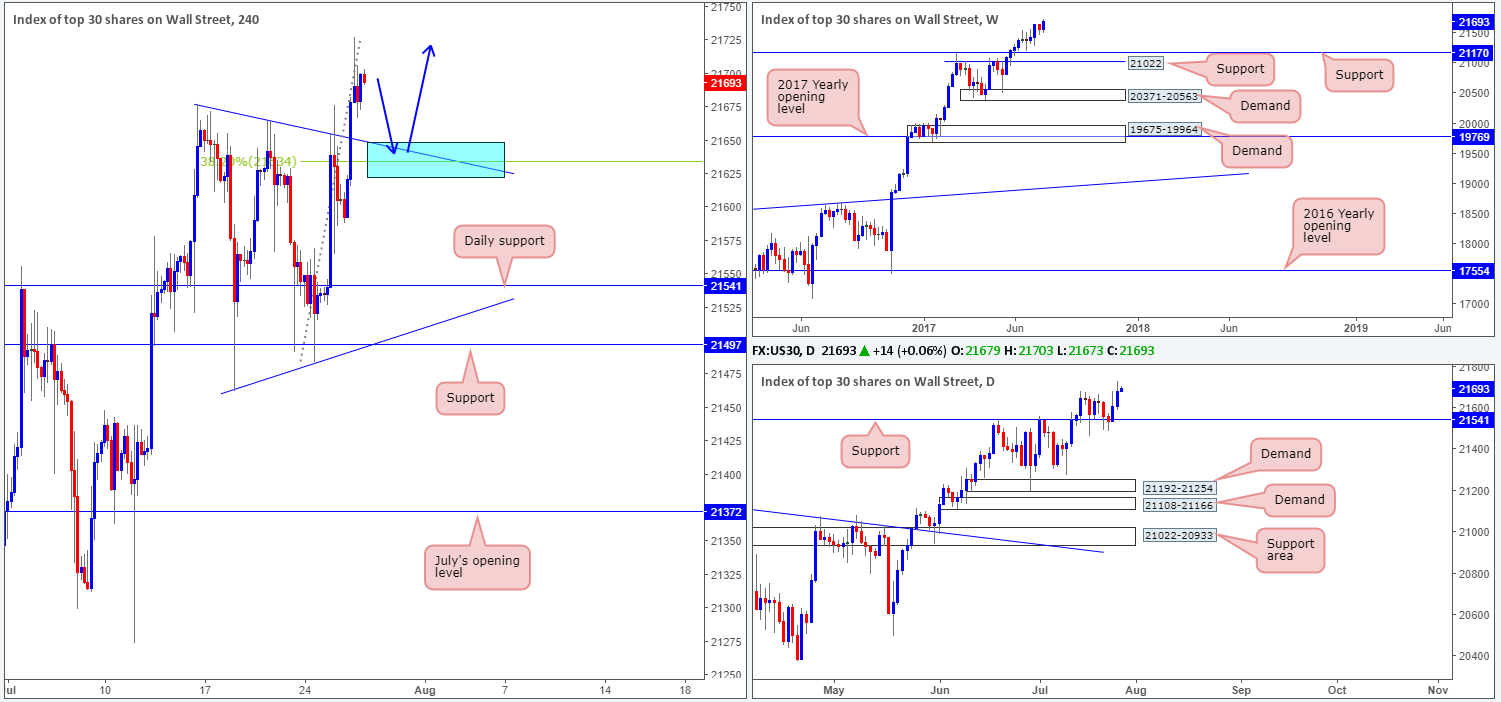
As was noted in Wednesday’s report, we have seen the US equity market chalk up a potential H4 bullish pennant formation (21677/21462) over the past few weeks. Yesterday’s action, however, pushed to the upside and clocked a fresh all-time high of 21727, consequently breaking the top edge of the said pennant pattern. We also mentioned in yesterday’s analysis that a breakout to the upside would be a valid buy signal, but would not be a move we’d consider trading until the unit has retested the broken pennant edge (the blue area) as support. Of particular interest here is that the pennant edge also aligns nicely with a H4 38.2% Fib support at 21633.
Our suggestions: Should the H4 candles retest the pennant edge today (as per the blue arrows) and print a full, or near-full-bodied H4 bull candle, this would be enough for us to enter into a long position with stops pegged below the H4 bull candle’s tail.
Data points to consider: US Core durable goods numbers and US Weekly unemployment claims at 1.30pm GMT+1.
Levels to watch/live orders:
- Buys: Watch for H4 price to retest the current H4 pennant upper edge ([waiting for a full, or near-full-bodied H4 bull candle to form following the retest is advised] stop loss: ideally beyond the candle’s tail).
- Sells: Flat (stop loss: N/A).
GOLD:
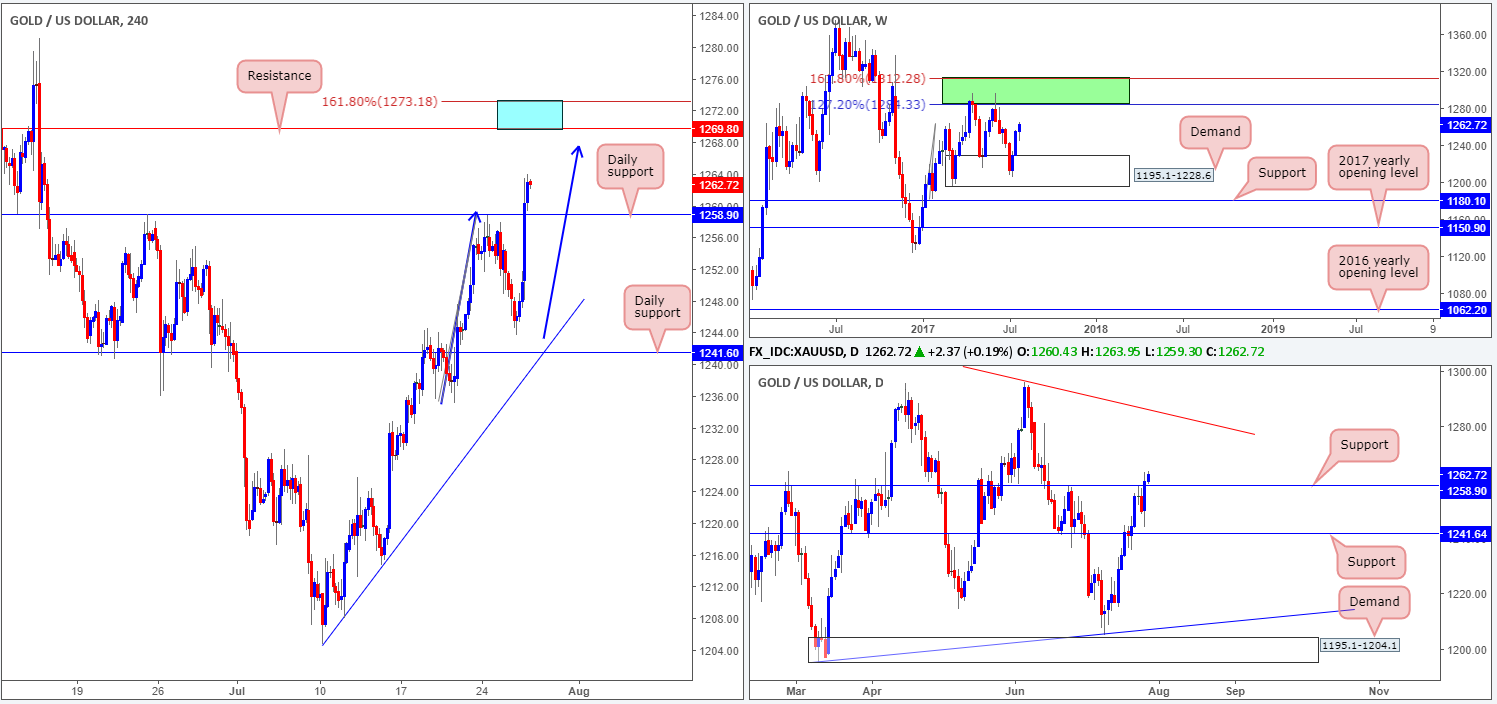
Across the board we saw the US dollar plummet on Wednesday after the Fed decided to keep interest rates unchanged. This lifted the appeal to own gold and thus raised the metal’s price, consequently breaking through a daily resistance line at 1258.9. What this also achieved was potentially clearing the path north up to H4 resistance at 1269.8, which is located nearby a H4 AB=CD (see blue arrows) 161.8% Fib ext. point at 1273.1.
While 1273.1/1269.8 appears to be a relatively strong-looking sell zone (blue area), one always has to take into account where he/she is on the bigger picture. Weekly price shows room to advance all the way back up to an area comprised of two Fibonacci extensions 161.8/127.2% at 1312.2/1284.3 taken from the low 1188.1 (green zone). By the same token, the daily candles also now show space to extend up to a trendline resistance taken from the high 1337.3.
Our suggestions: A bounce from 1273.1/1269.8 will likely take shape should price connect with it today. How much of a bounce though is difficult to judge, given the bigger picture showing that the bulls currently have the upper hand. Personally, we will not be trading short from this barrier. Even with additional candle confirmation, we feel the risk is too great here.
Levels to watch/live orders:
- Buys: Flat (stop loss: N/A).
- Sells: Flat (stop loss: N/A).


