
DXY:
The DXY instrument is currently showing a bearish overall momentum. It’s predicted that the price could potentially make a bearish reaction off the 1st resistance and drop to the 1st support level.
The 1st support is located at 100.39 and is seen as good due to its quality as a pullback support and its position at the 61.80% Fibonacci retracement level.
The 2nd support level is found at 100.03 and is considered beneficial as it acts as an overlap support and is positioned at the 78.60% Fibonacci retracement level.
Regarding resistance levels, the 1st resistance stands at 101.65 and is notable for being a swing high resistance and positioned at the 50% Fibonacci retracement level.
The 2nd resistance level is at 101.98 and is recognized for its quality as a pullback resistance and its position at the 61.80% Fibonacci retracement level.

EUR/USD:
The EURUSD instrument is currently showing a bullish overall momentum. It’s anticipated that the price could potentially drop further to the 1st support level in the short term before bouncing from there and rising to the 1st resistance.
The 1st support is located at 1.1096 and is considered favourable due to its quality as a pullback support and its position at the 38.20% Fibonacci retracement level.
The 2nd support level is found at 1.1011 and is recognized for being an overlap support and its position at the 61.80% Fibonacci retracement level.
Regarding resistance levels, the 1st resistance stands at 1.1096 and is notable for being a pullback resistance, as well as its position at the 38.20% Fibonacci retracement level.
The 2nd resistance level is at 1.1172 and is seen as strong due to its quality as a pullback resistance and its position at the 61.80% Fibonacci retracement level.

EUR/JPY:
The EUR/JPY instrument is currently demonstrating a bearish overall momentum. This bearish sentiment is attributed to the price breaking below an ascending support line, signaling the potential for a bearish move.
It is anticipated that the price could potentially undergo a bearish break off the 1st support level, leading to a subsequent drop towards the 2nd support level.
The 1st support level, situated at 155.21, is considered significant as it represents an overlap support and is positioned at the 61.80% Fibonacci retracement level.
The 2nd support level, located at 153.45, holds significance as a swing low support, coinciding with the 50% Fibonacci retracement level.
On the other hand, resistance levels are also observed. The 1st resistance, found at 156.77, is noteworthy for being an overlap resistance.
Lastly, the 2nd resistance level at 157.96 is recognized as a pullback resistance.

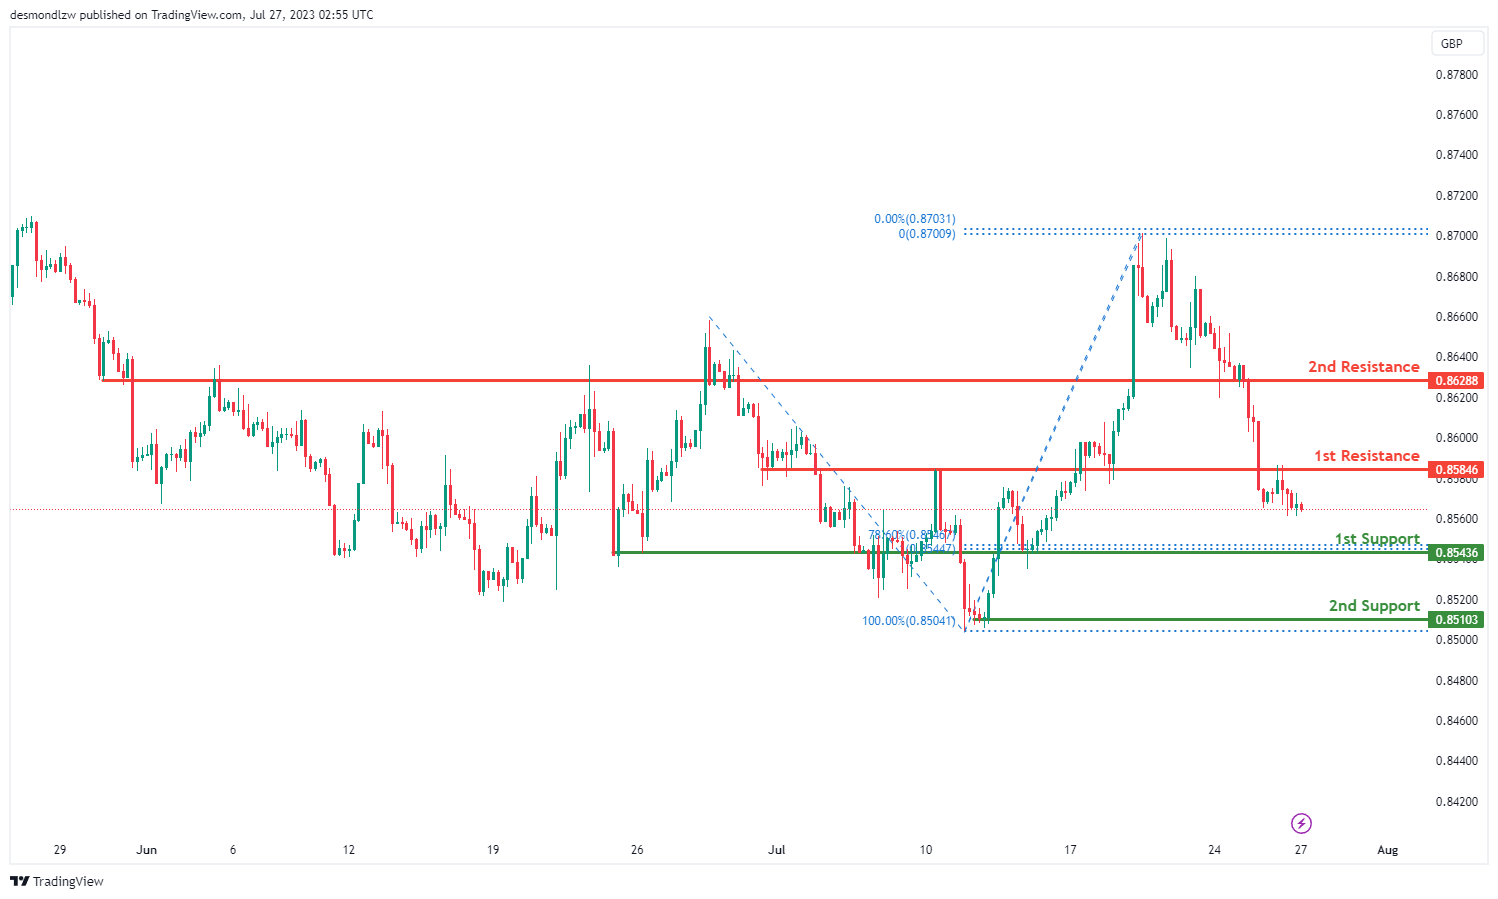
EUR/GBP:
The EUR/GBP instrument is currently demonstrating a bearish overall momentum.
It is anticipated that the price could potentially make a bearish continuation towards the 1st support level.
The 1st support is situated at 0.8543, and it is considered significant as it represents an overlap support and is positioned at the 78.60% Fibonacci retracement level.
The 2nd support level is located at 0.8510 and is recognized as a multi-swing low support, adding to its importance.
Regarding resistance levels, the 1st resistance stands at 0.8584 and is significant for being an overlap resistance.
The 2nd resistance level at 0.8628 is recognized as a pullback resistance, further reinforcing its significance in the current market dynamics.
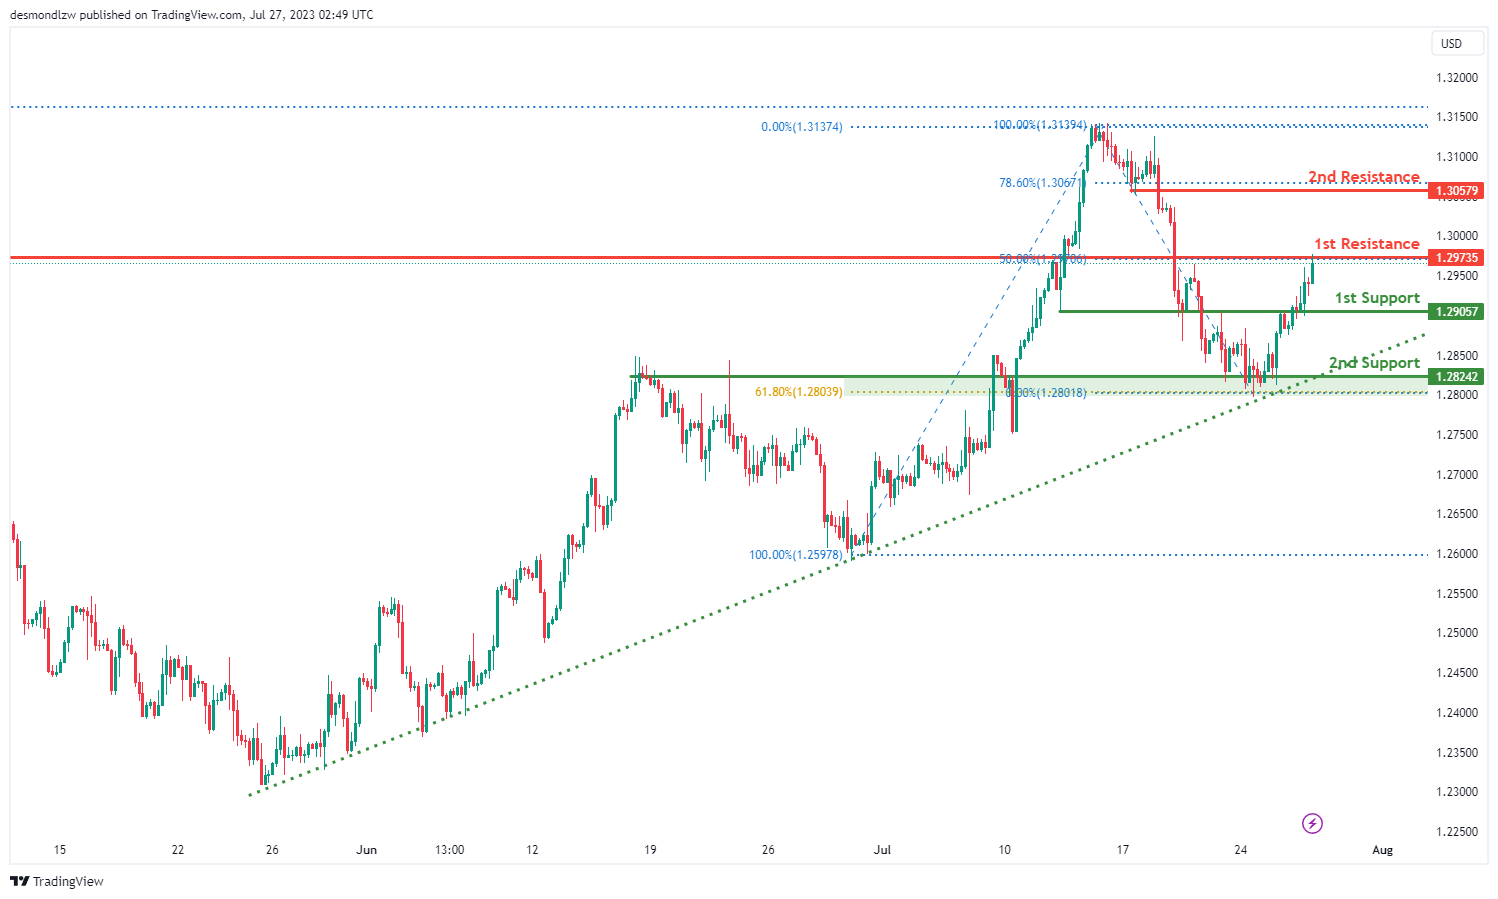
GBP/USD:
The GBP/USD instrument is currently showing a bearish overall momentum. However, factors contributing to the momentum suggest a possible bullish scenario as the price is above a major ascending trend line, indicating the potential for further bullish momentum.
It is predicted that the price could potentially make a bearish reaction off the 1st resistance level and drop to the 1st support level.
The 1st support is located at 1.2905 and is considered significant as it represents an overlap support.
The 2nd support level is found at 1.2824 and is recognized as an overlap support, further strengthened by its position at the 61.80% Fibonacci retracement level.
Regarding resistance levels, the 1st resistance stands at 1.2973 and is considered important for being a pullback resistance, as well as its position at the 50% Fibonacci retracement level.
The 2nd resistance level at 1.3057 is recognized as a pullback resistance and is further reinforced by its position at the 78.60% Fibonacci retracement level.
GBP/JPY:
The GBP/JPY instrument is currently showing a bearish overall momentum. Contributing to this momentum is the fact that the price is below a major descending trend line, suggesting that further bearish momentum is likely.
It is predicted that the price could potentially make a bearish break off the 1st support level and drop towards the 2nd support level.
The 1st support is located at 180.62 and is considered good as it represents a pullback support.
The 2nd support level is found at 179.76 and is recognized as a multi-swing low support, adding to its significance.
Regarding resistance levels, the 1st resistance stands at 182.40 and is considered important as it represents a multi-swing high resistance.
The 2nd resistance level, also at 182.40, is recognized as a multi-swing high resistance and is further reinforced by its positioning at the 61.80% Fibonacci projection level.

USD/CHF:
The USD/CHF instrument is currently showing a bearish overall momentum.
It is anticipated that the price could potentially make a bearish continuation towards the 1st support level.
The 1st support is situated at 0.8569 and is considered significant as it represents a multi-swing low support.
The 2nd support level is found at 0.8525 and is recognized as being at the 127.20% Fibonacci extension level, further adding to its importance.
Regarding resistance levels, the 1st resistance stands at 0.8626 and is seen as a pullback resistance.
The 2nd resistance level at 0.8696 is considered significant as it represents a multi-swing high resistance, reinforcing its importance in the current market dynamics.

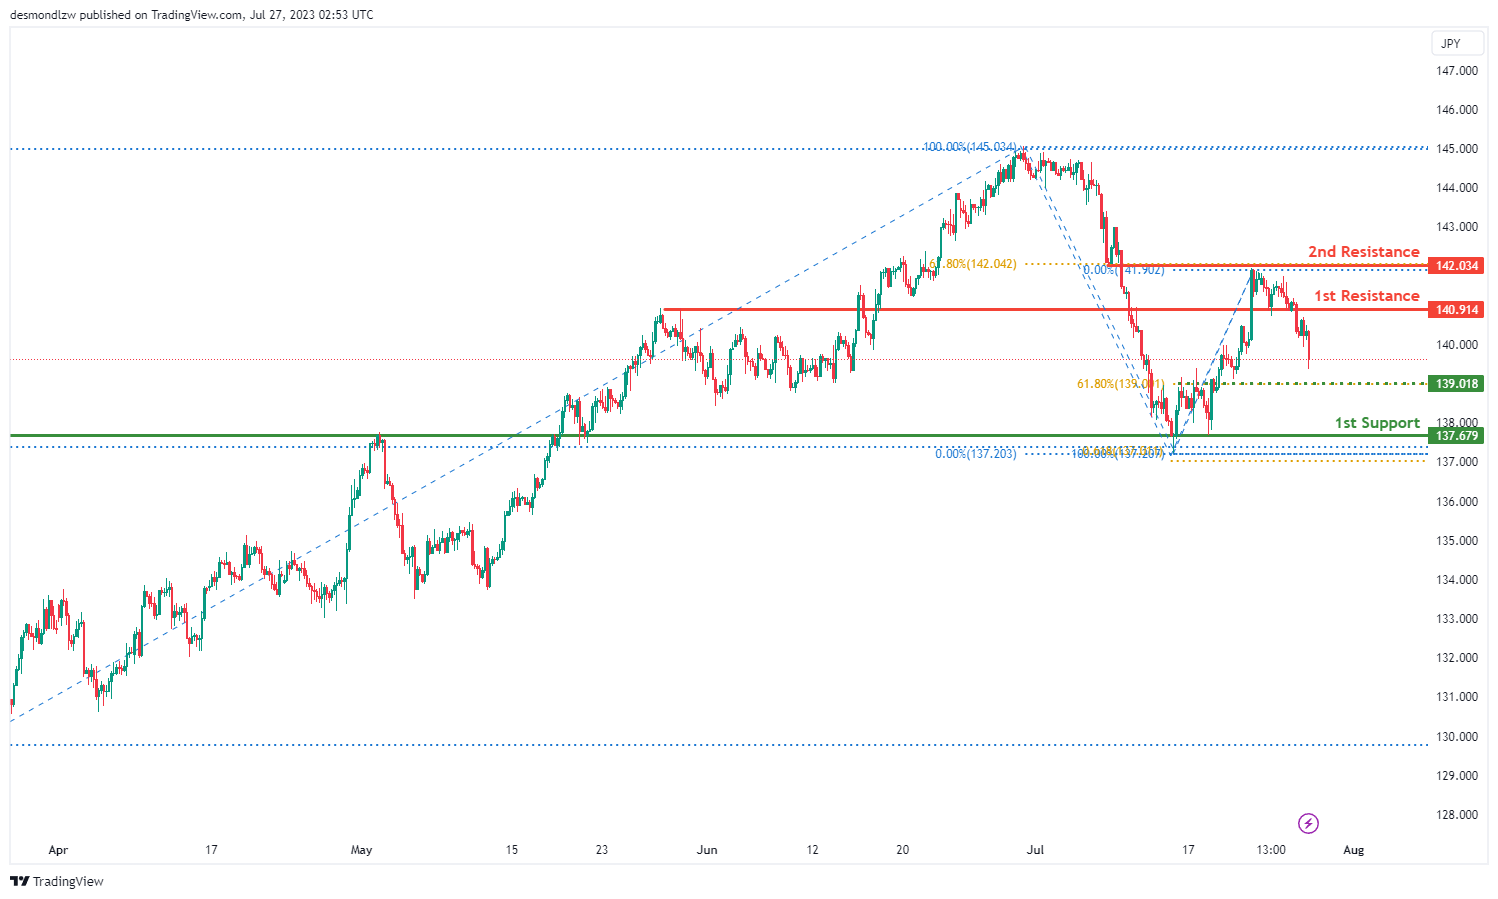
USD/JPY:
The USD/JPY instrument is currently showing a bearish overall momentum.
It is anticipated that the price could potentially make a bearish continuation towards the 1st support level.
The 1st support is located at 137.67 and is considered significant as it represents an overlap support and is positioned at the 61.80% Fibonacci projection level.
An intermediate support level is found at 139.01, which is recognized as a pullback support and is positioned at the 61.80% Fibonacci retracement level.
Regarding resistance levels, the 1st resistance stands at 140.91 and is considered important as it represents a pullback resistance.
The 2nd resistance level at 142.03 is significant as it represents an overlap resistance and is further reinforced by its position at the 61.80% Fibonacci retracement level.
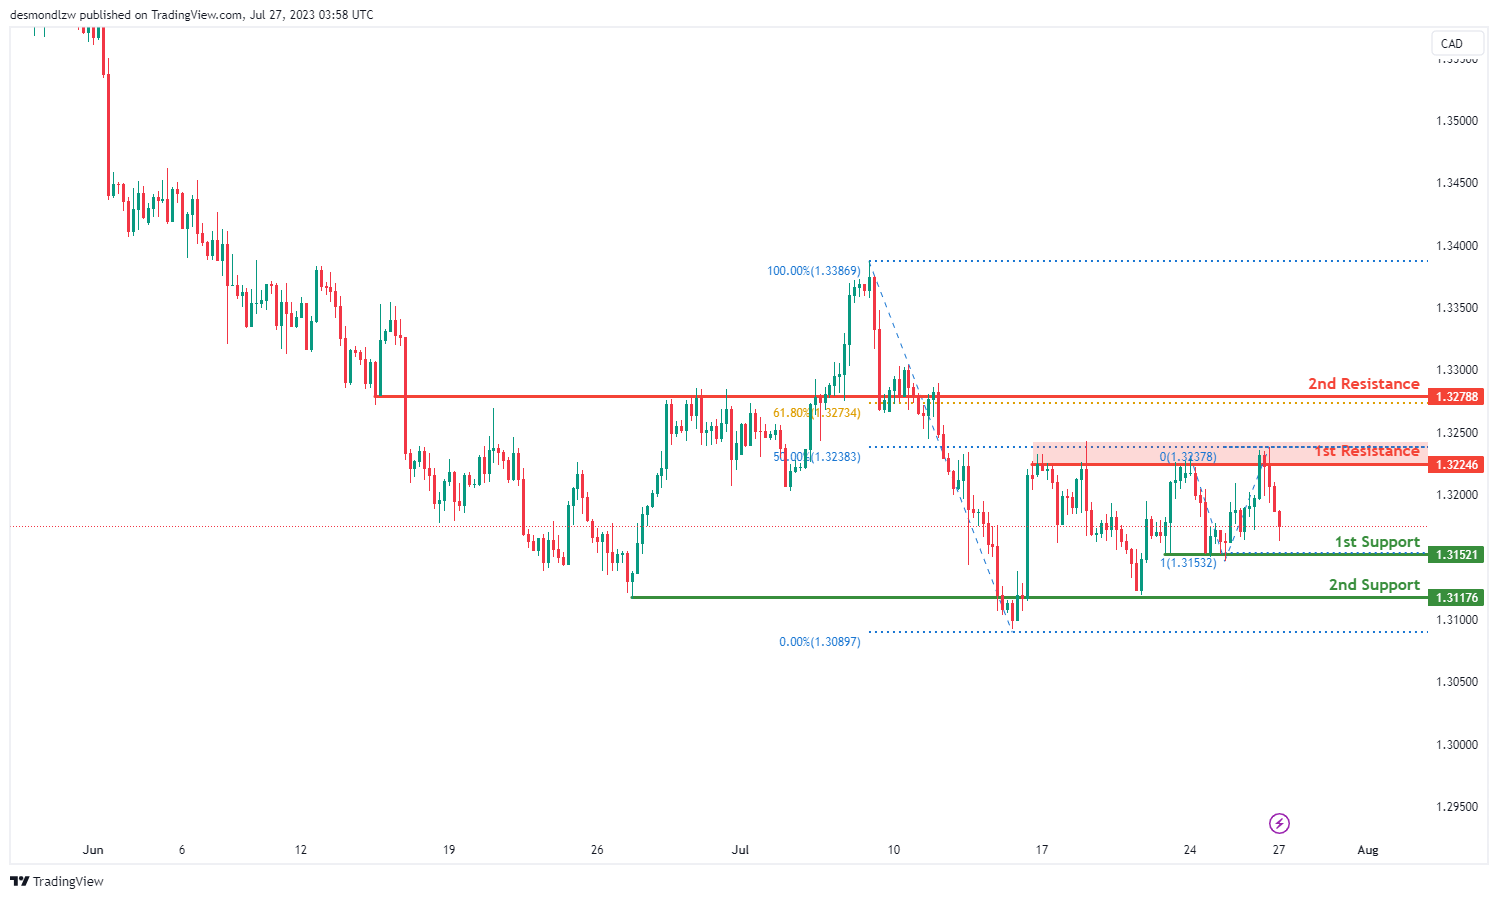
USD/CAD:
The USD/CAD chart demonstrates a bearish momentum, suggesting the potential for further downward movement.
There is a possibility of a bearish continuation towards the 1st support level at 1.3152. This support level holds significance as it represents a pullback support that coincides with the 100.00% Fibonacci projection level. In addition, the 2nd support level at 1.3118 is characterized as an overlap support.
To the upside, the 1st resistance at 1.3225 is identified as an overlap resistance that coincides with the 50.00% Fibonacci retracement level. Additionally, the 2nd resistance at 1.3279 is also recognized as an overlap resistance coinciding with the 61.80% Fibonacci retracement level.
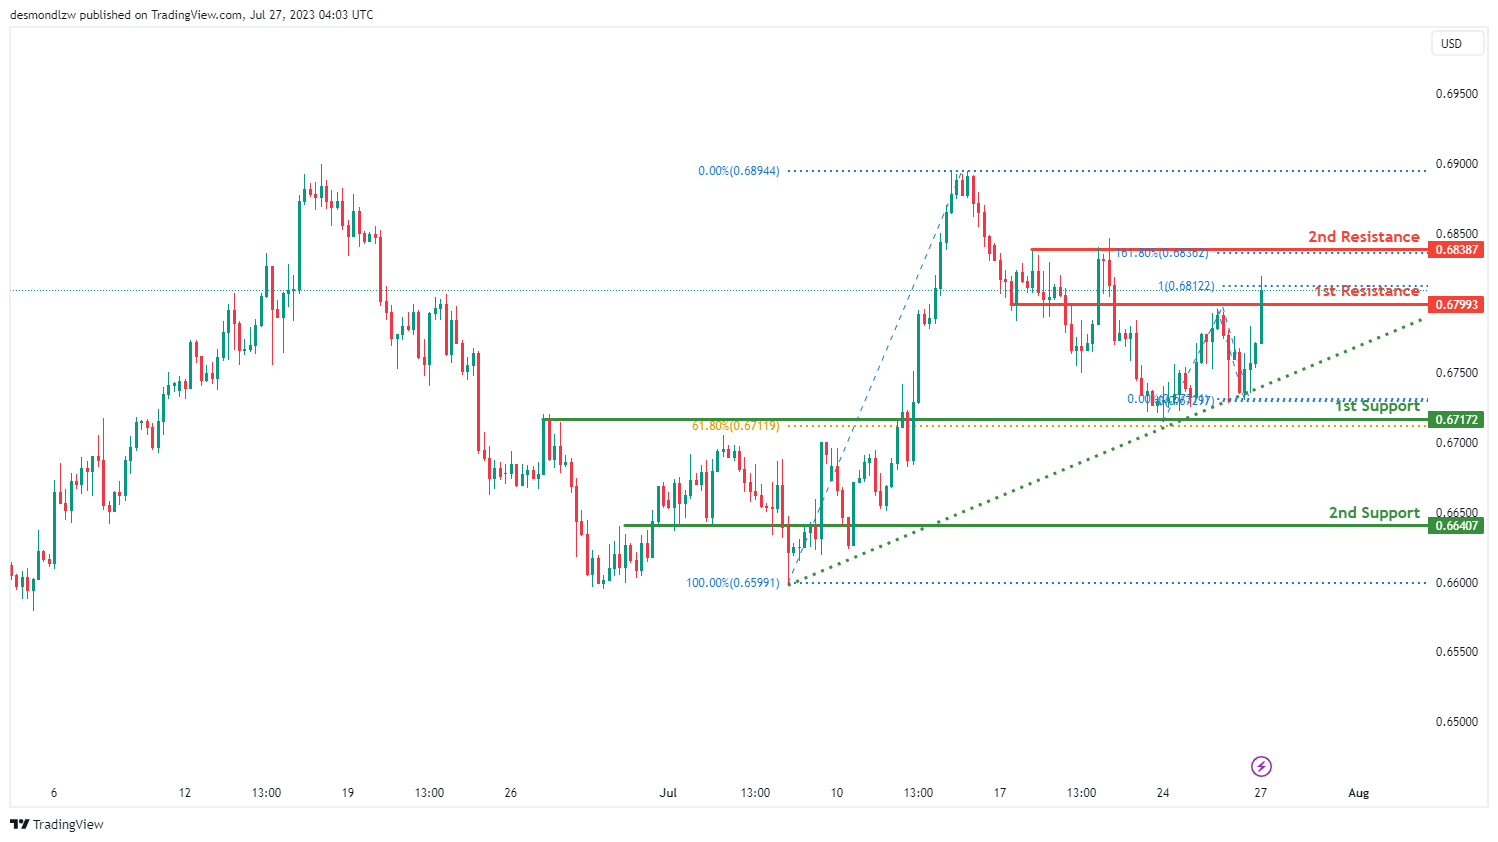
AUD/USD:
The AUD/USD chart exhibits strong bullish momentum with high confidence, indicating a potential continuation of the uptrend after breaking through the 1st resistance at 0.6799.
There is a likelihood of a bullish continuation towards the 2nd resistance level at 0.6839, which is a pullback resistance that coincides with both the 161.80% Fibonacci extension level.
On the downside, the 1st support at 0.6717 is recognized as an overlap support and aligns with the 61.80% Fibonacci retracement level.
Further downward movement may encounter another barrier at the 2nd support level of 0.6641. This support is identified as an overlap support level.
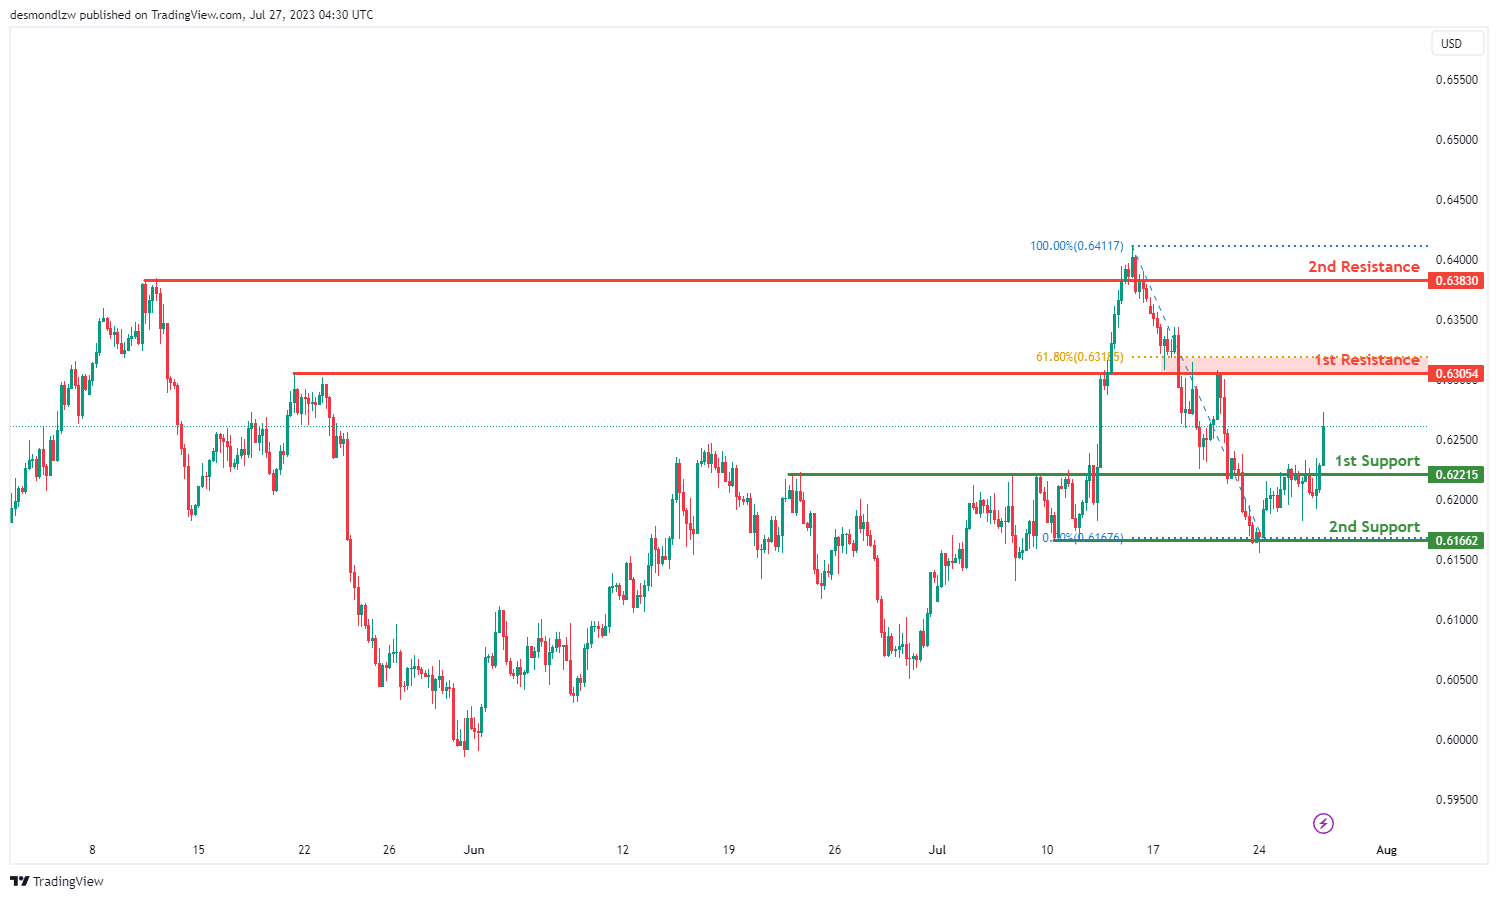
NZD/USD
The NZD/USD instrument is currently showing a bullish overall momentum.
It is predicted that the price could potentially make a bullish continuation towards the 1st resistance level.
The 1st support is located at 0.6221 and is considered significant as it represents a pullback support.
The 2nd support level is found at 0.6166 and is recognized as a multi-swing low support.
Regarding resistance levels, the 1st resistance stands at 0.6305 and is considered important as it represents an overlap resistance.
The 2nd resistance level at 0.6383 is also significant as it represents a pullback resistance, further reinforcing its importance in the current market dynamics.
With the bullish momentum of the chart, the price is likely to continue its upward movement towards the resistance levels, providing potential trading opportunities for bullish traders.
DJ30:
The DJ30 instrument is currently exhibiting a bullish overall momentum.
It is anticipated that the price could potentially make a bullish continuation towards the 1st resistance level.
The 1st support is located at 35395.02 and is considered significant as it represents an overlap support.
The 2nd support level is found at 35209.49 and is recognized as another overlap support.
Regarding resistance levels, the 1st resistance stands at 35724.86 and is considered important as it represents a pullback resistance.
The 2nd resistance level at 36137.16 is also significant as it represents another pullback resistance, further reinforcing its importance in the current market dynamics.
Additionally, there is an intermediate support level at 35520.18, which is recognized as a pullback support, adding to its significance in the overall chart analysis.

GER30:
The GER30 instrument is currently showing a bullish overall momentum.
It is predicted that the price could potentially make a bullish continuation towards the 1st resistance level.
The 1st support is located at 15998.61 and is considered significant as it represents an overlap support.
The 2nd support level is found at 15849.53 and is recognized as a pullback support.
Regarding resistance levels, the 1st resistance stands at 16248.78 and is considered important as it represents a multi-swing high resistance.
The 2nd resistance level at 16355.36 is also significant as it represents a multi-swing high resistance, further reinforcing its importance in the current market dynamics

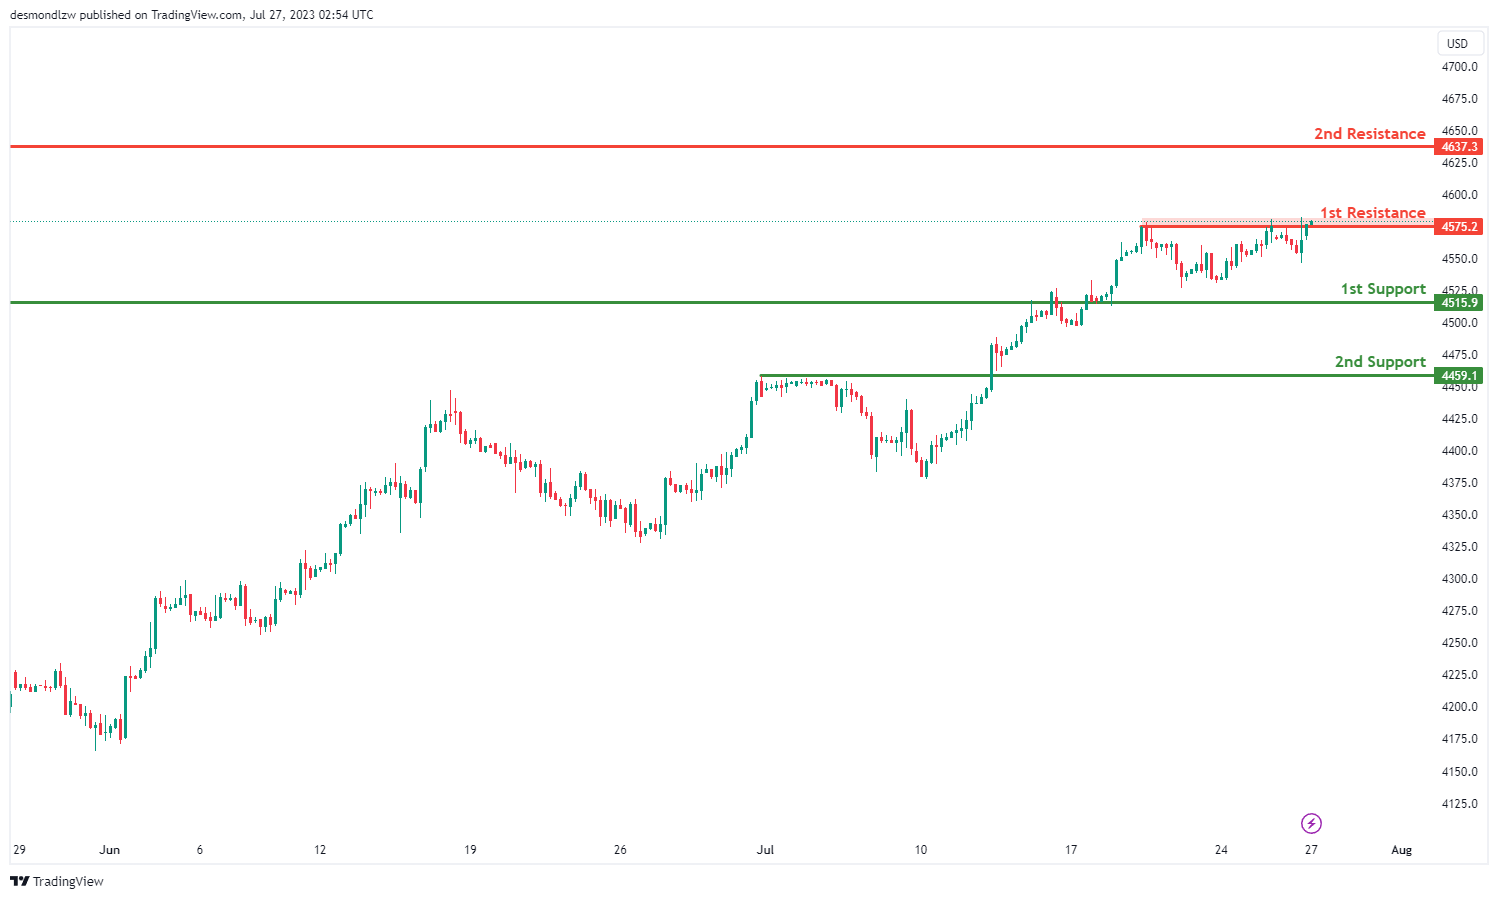
US500
The US500 instrument is currently displaying a bullish overall momentum.
It is anticipated that the price could potentially make a bullish break through the 1st resistance level and rise towards the 2nd resistance level.
The 1st support is located at 4515.9 and is considered significant as it represents a pullback support.
The 2nd support level is found at 4459.1 and is recognized as an overlap support.
Regarding resistance levels, the 1st resistance stands at 4575.2 and is considered important as it represents a multi-swing high resistance.
The 2nd resistance level at 4637.2 is also significant as it represents a multi-swing high resistance, further reinforcing its importance in the current market dynamics.
BTC/USD:
The BTC/USD instrument is currently showing a bearish overall momentum.
It is anticipated that the price could potentially make a bearish continuation towards the 1st support level.
The 1st support is situated at 28427 and is considered significant as it represents a pullback support.
The 2nd support level is found at 27456 and is also recognized as a pullback support.
Regarding resistance levels, the 1st resistance stands at 29610 and is considered important as it represents an overlap resistance.
The 2nd resistance level at 30431 is significant as it represents a multi-swing high resistance.
Additionally, there is an intermediate support level at 29002, which is recognized as a multi-swing low support, further adding to its significance.

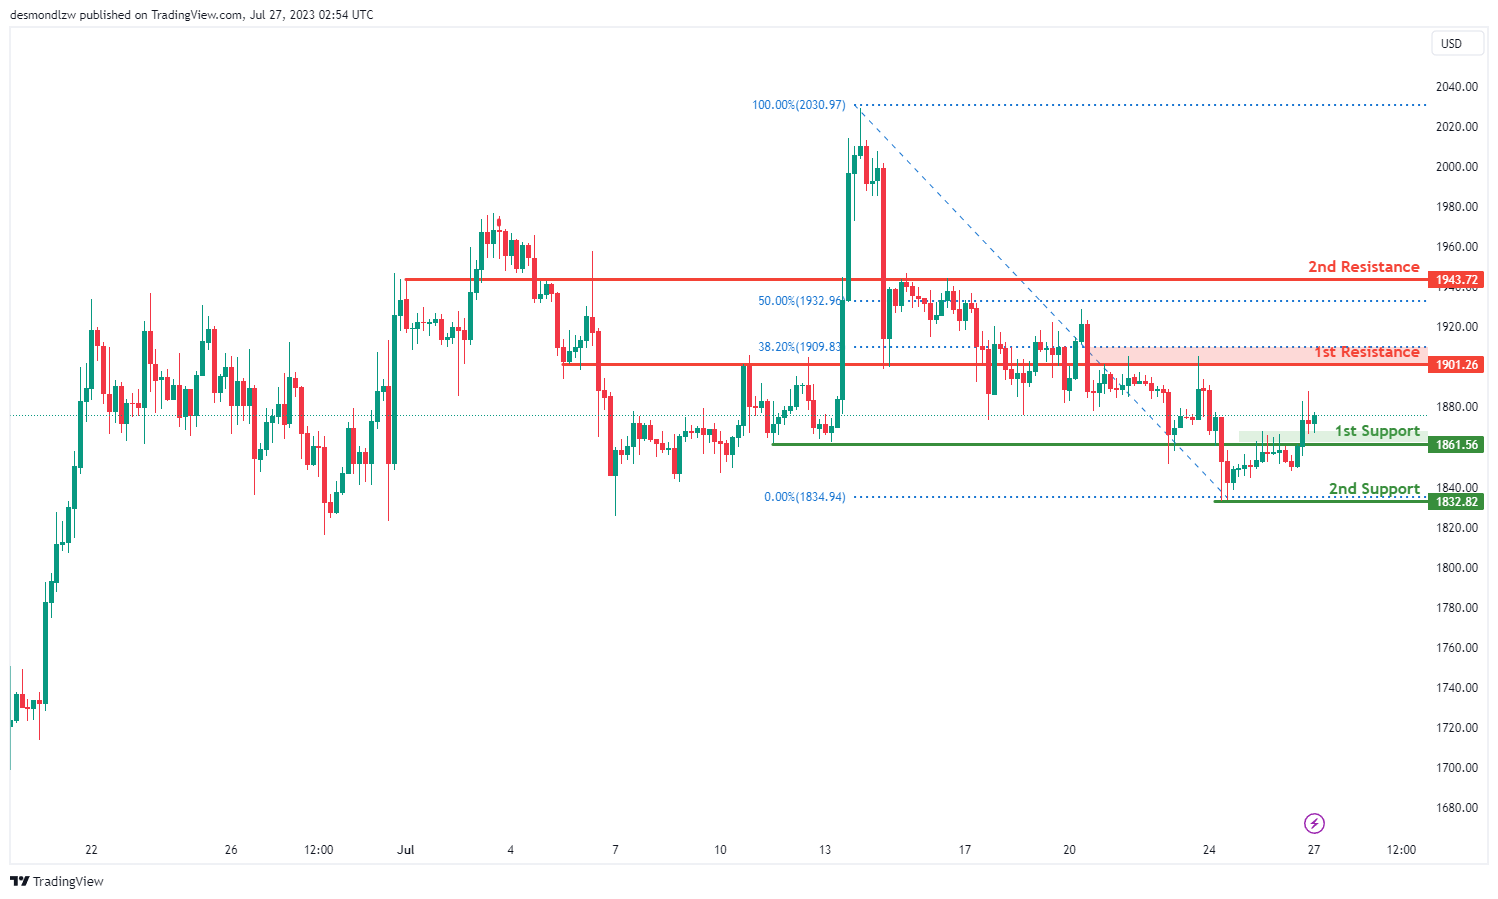
ETH/USD:
The ETH/USD instrument is currently exhibiting a bullish overall momentum.
It is predicted that the price could potentially make a bullish continuation towards the 1st resistance level.
The 1st support is located at 1861.56 and is considered significant as it represents a pullback support.
The 2nd support level is found at 1832.82 and is recognized as a swing low support.
Regarding resistance levels, the 1st resistance stands at 1901.26 and is considered important as it represents an overlap resistance and is positioned at the 38.20% Fibonacci retracement level.
The 2nd resistance level at 1943.72 is significant as it represents an overlap resistance and is further reinforced by its position at the 50% Fibonacci retracement level.
WTI/USD:
The WTI/USD chart shows a bullish momentum with a potential scenario for a bullish continuation towards the 1st resistance at 80.14, which is an overlap resistance that coincides with a confluence of Fibonacci levels namely the 78.60% retracement and 61.80% projection levels. Additionally, the 2nd resistance at 81.62 serves as another key area, which is also an overlap resistance that coincides with the 78.60% Fibonacci retracement level.
On the downside, the 1st support at 78.49 is a pullback support that also aligns with the 23.60% Fibonacci retracement level. Further downward movement may find support at the 2nd support level of 76.65, which is an overlap support that corresponds with the 23.60% Fibonacci retracement level. Furthermore, price is trading above an ascending trend line.

XAU/USD (GOLD):
The XAU/USD instrument is currently displaying a bullish overall momentum.
It is predicted that the price could potentially make a bullish continuation towards the 1st resistance level.
The 1st support is located at 1967.08 and is considered significant as it represents an overlap support.
The 2nd support level is found at 1953.30, which is recognized as an overlap support and is positioned at both the 38.20% Fibonacci retracement level and the 38.20% Fibonacci retracement level, indicating a Fibonacci confluence.
Regarding resistance levels, the 1st resistance stands at 1985.73 and is considered important as it represents a multi-swing high resistance.
The 2nd resistance level at 2006.41 is significant as it represents a pullback resistance.
An intermediate resistance level is found at 1979.00, recognized as a pullback resistance and positioned at both the 78.60% Fibonacci retracement level and the 61.80% Fibonacci projection level, indicating a Fibonacci confluence.

The accuracy, completeness and timeliness of the information contained on this site cannot be guaranteed. IC Markets does not warranty, guarantee or make any representations, or assume any liability regarding financial results based on the use of the information in the site.
News, views, opinions, recommendations and other information obtained from sources outside of www.icmarkets.com, used in this site are believed to be reliable, but we cannot guarantee their accuracy or completeness. All such information is subject to change at any time without notice. IC Markets assumes no responsibility for the content of any linked site.
The fact that such links may exist does not indicate approval or endorsement of any material contained on any linked site. IC Markets is not liable for any harm caused by the transmission, through accessing the services or information on this site, of a computer virus, or other computer code or programming device that might be used to access, delete, damage, disable, disrupt or otherwise impede in any manner, the operation of the site or of any user’s software, hardware, data or property.


