
Key risk events today:
Australia Private Capital Expenditure q/q; Canada Current Account; US Prelim GDP q/q; US Unemployment Claims; Fed Chair Powell Speaks; US Pending Home Sales m/m; BoC Gov. Macklem Speaks; Jackson Hole Symposium.
(Previous analysis as well as outside sources – italics).
EUR/USD:
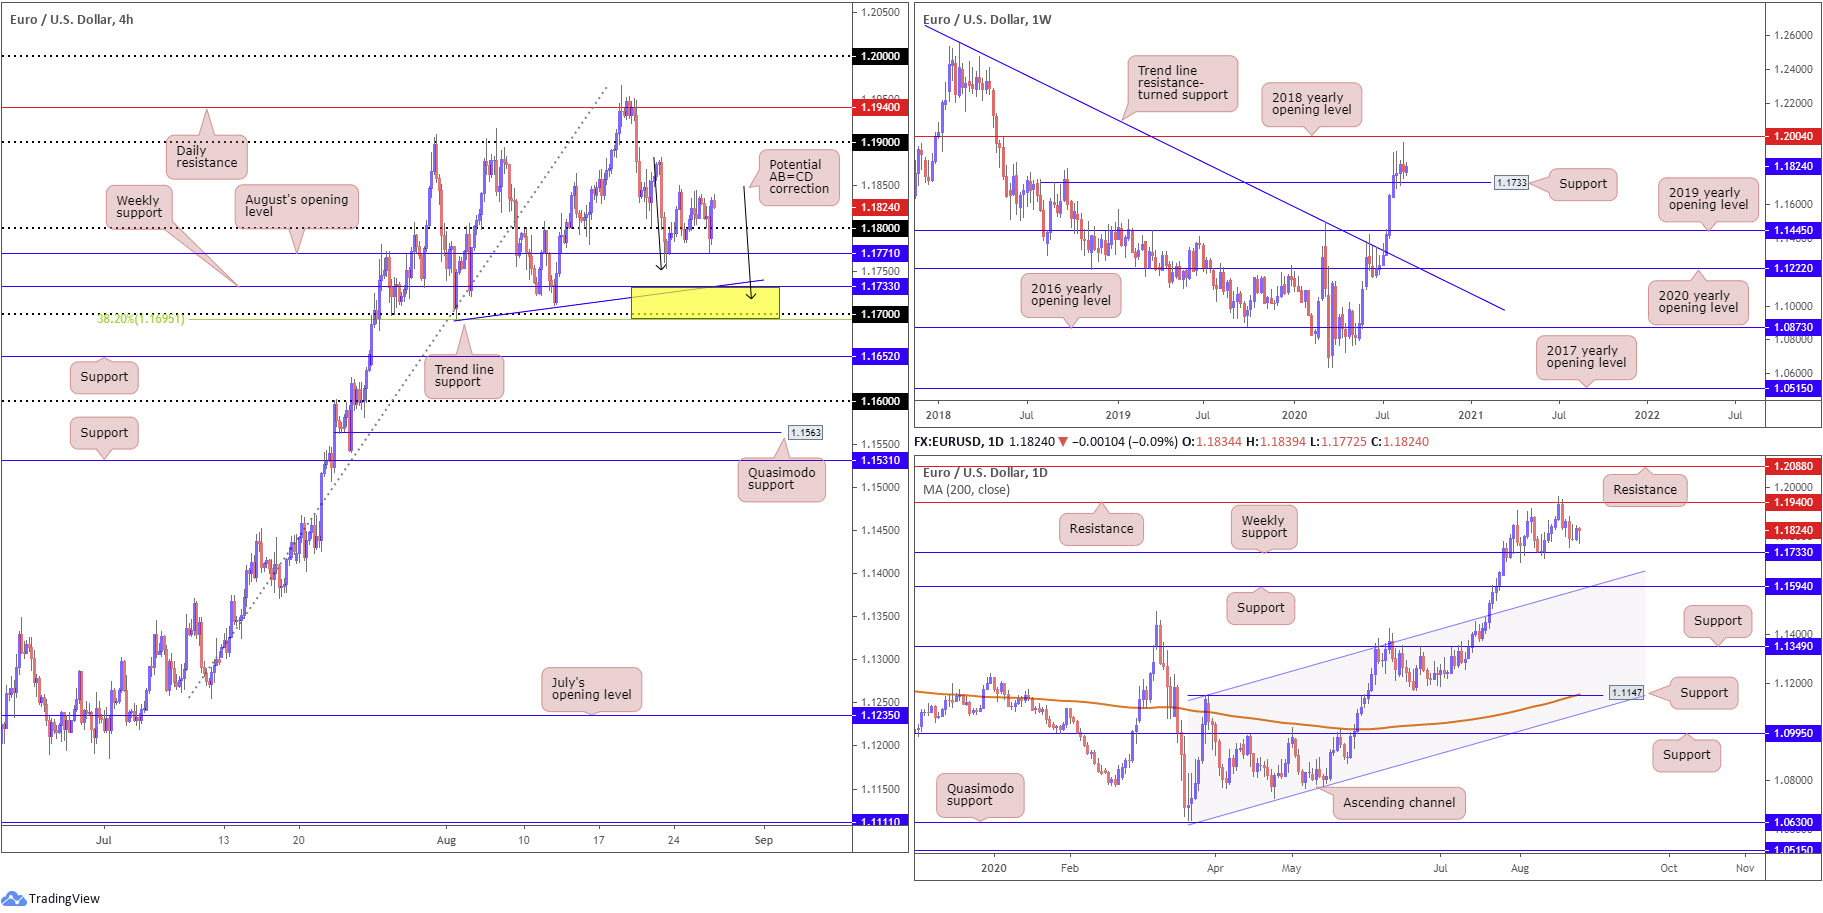
EUR/USD traded mixed on Wednesday, though finished considerably off worst levels into the European close. 1.18, as you can see, survived another downside attempt on the H4, missing August’s opening level at 1.1771 by only a handful of pips. To the upside, we can see last Friday’s peak at 1.1882 in place as potential resistance, followed by the 1.19 handle.
Given we ended mostly unchanged Wednesday, much of the following will echo thoughts put forward in recent analysis.
Assuming we eventually reconnect with 1.1771 on the H4, dipping to weekly support at 1.1733 may be in the offing. Based on the H4 timeframe, there are a number of technical elements that support the current weekly level, such as trend line support, extended from the low 1.1695, a possible AB=CD correction (black arrows) at 1.1716, the round number 1.17 and a 38.2% Fibonacci retracement ratio plotted at 1.1695.
Technical structure on the weekly timeframe:
Having the US dollar index mildly snap an eight-week bearish phase, EUR/USD curled south of the 2018 yearly opening level at 1.2004 last week, also modestly snapping an eight-week bullish phase.
Support at 1.1733, a prior Quasimodo resistance level, therefore, is now back on the radar, which may be of interest to buyers, considering the recent break of trendline resistance (July 13), extended from the high 1.2555. A 1.1733 breach, on the other hand, unlocks a possible bearish theme towards the 2019 yearly opening level at 1.1445.
Technical structure on the daily timeframe:
Resistance at 1.1940 was brought to attention during mid-week trade last week, putting an end to a six-day bullish phase. Deprived of notable support, Friday headed lower and concluded the week within striking distance of weekly support mentioned above at 1.1733. Breaking 1.1733 on the daily timeframe may witness sellers strengthen their grip and approach support coming in at 1.1594, a level fusing with channel resistance-turned support, taken from the high 1.1147.
Areas of consideration:
Outlook unchanged.
While August’s opening level at 1.1771 or even the 1.18 band on the H4 may continue to contain downside today, the more prominent area of support, as underscored in Monday’s technical briefing, rests between the 1.1695/1.1733 region (yellow). Not only does the zone gift appealing H4/weekly confluence (see above), the current trend in this market points north.
GBP/USD:
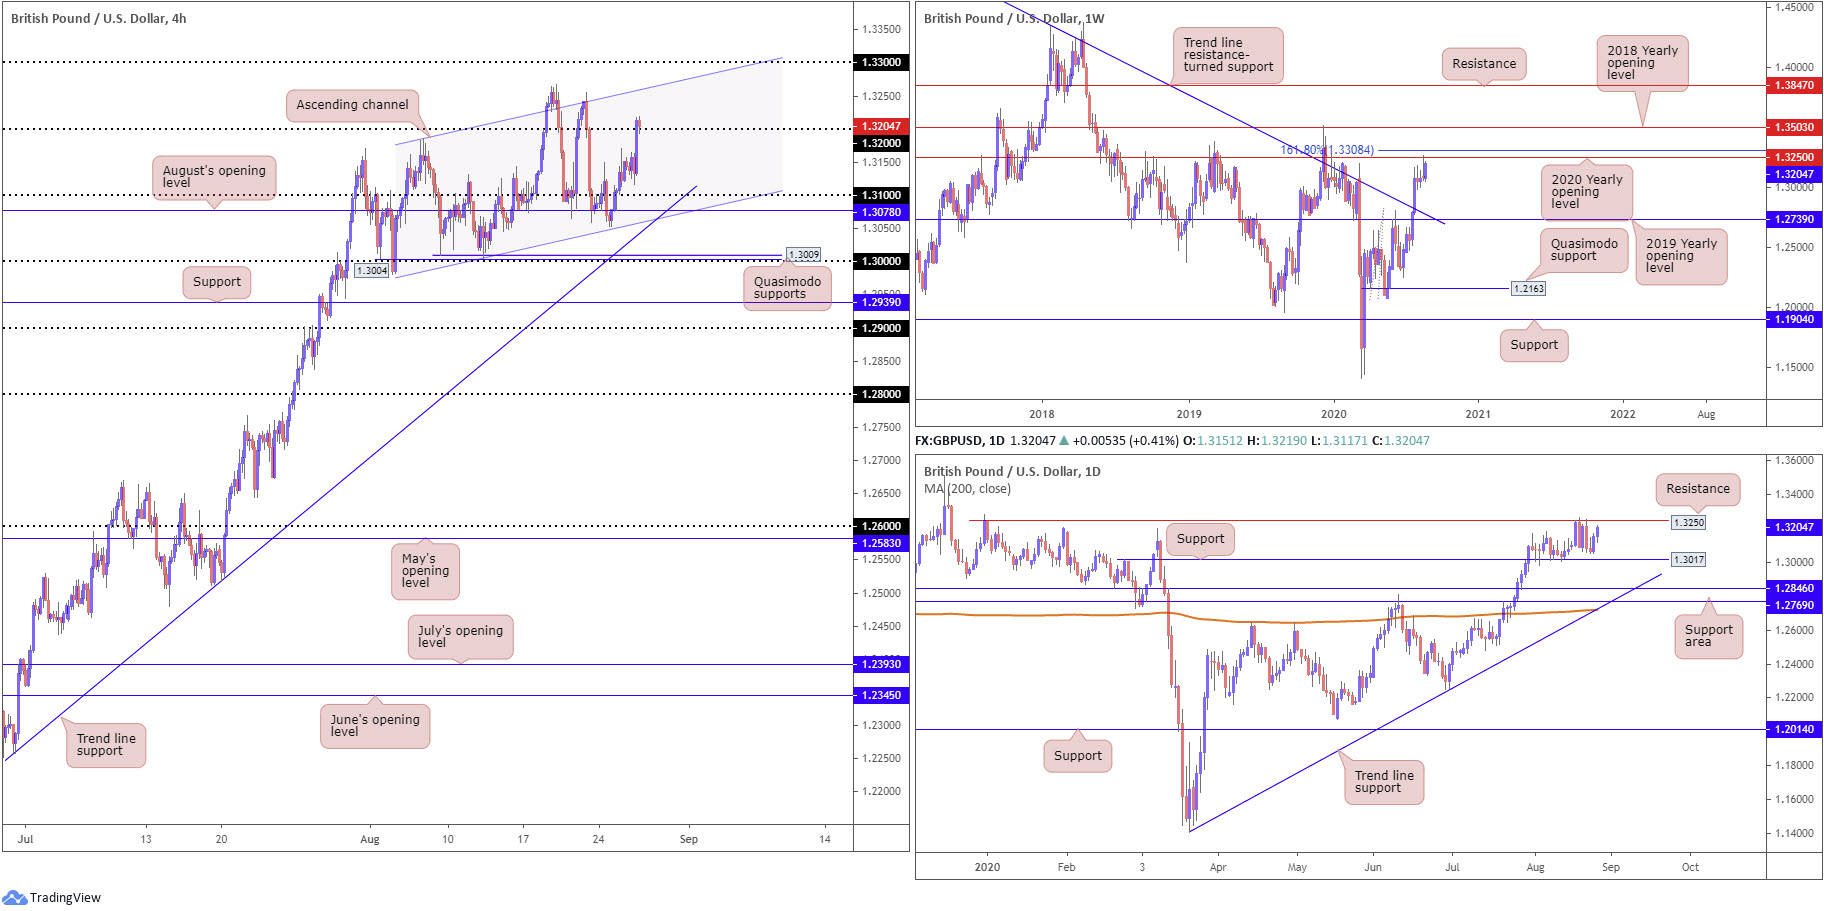
Sterling latched onto a healthy bid Wednesday as the DXY struggled to sustain gains despite upbeat data. Up nearly 1%, GBP/USD on the H4 timeframe extended through 1.32 and clocked fresh peaks at 1.3219. Current movement is seen retesting the round number, which may serve as possible support heading into fresh trading as breakout signals emerge.
Overall, the H4 candles are seen encased within an ascending channel, extended from 1.3005/1.3185. An advance from 1.32 today is likely to connect with channel resistance, though clearing the line has 1.33 to target.
The story on the higher timeframes has weekly price toying with space just south of the 2020 yearly opening level at 1.3250, a level sited just under a 161.8% Fibonacci extension point at 1.3308. This follows last week’s gravestone doji candlestick formation. Also worth remembering is the July 27 trend line resistance (1.5930) break.
A closer reading of price action on the daily timeframe shows the unit closing in on resistance at 1.3250, a barrier sharing the same space with resistance on the weekly timeframe, the 2020 yearly opening level. To the downside, the spotlight shines towards a support marked at 1.3017, a prior Quasimodo resistance level, followed by an area of support between 1.2769/1.2846. This, as you can see, is also closely positioned with trend line support, taken from the low 1.1409, and a 200-day SMA (orange – 1.2720).
Areas of consideration:
For those who read Wednesday’s technical briefing you may recall the following (italics):
Sellers have so far been reasonably slow to respond off the 1.3250 higher timeframe resistance, perhaps intimidated by the current uptrend and neighbouring daily support at 1.3017.
Also having seen H4 candles make their way back above 1.31, intraday buyers may seek bullish scenarios today, targeting the 1.32 handle. Conservative players are likely watching for a 1.31 retest to emerge before pulling the trigger.
Upside, according to chart studies, reveals additional buying could be seen today, at least until we shake hands with 1.3250. Therefore, the 1.32 retest may be of interest for buyers today.
AUD/USD:
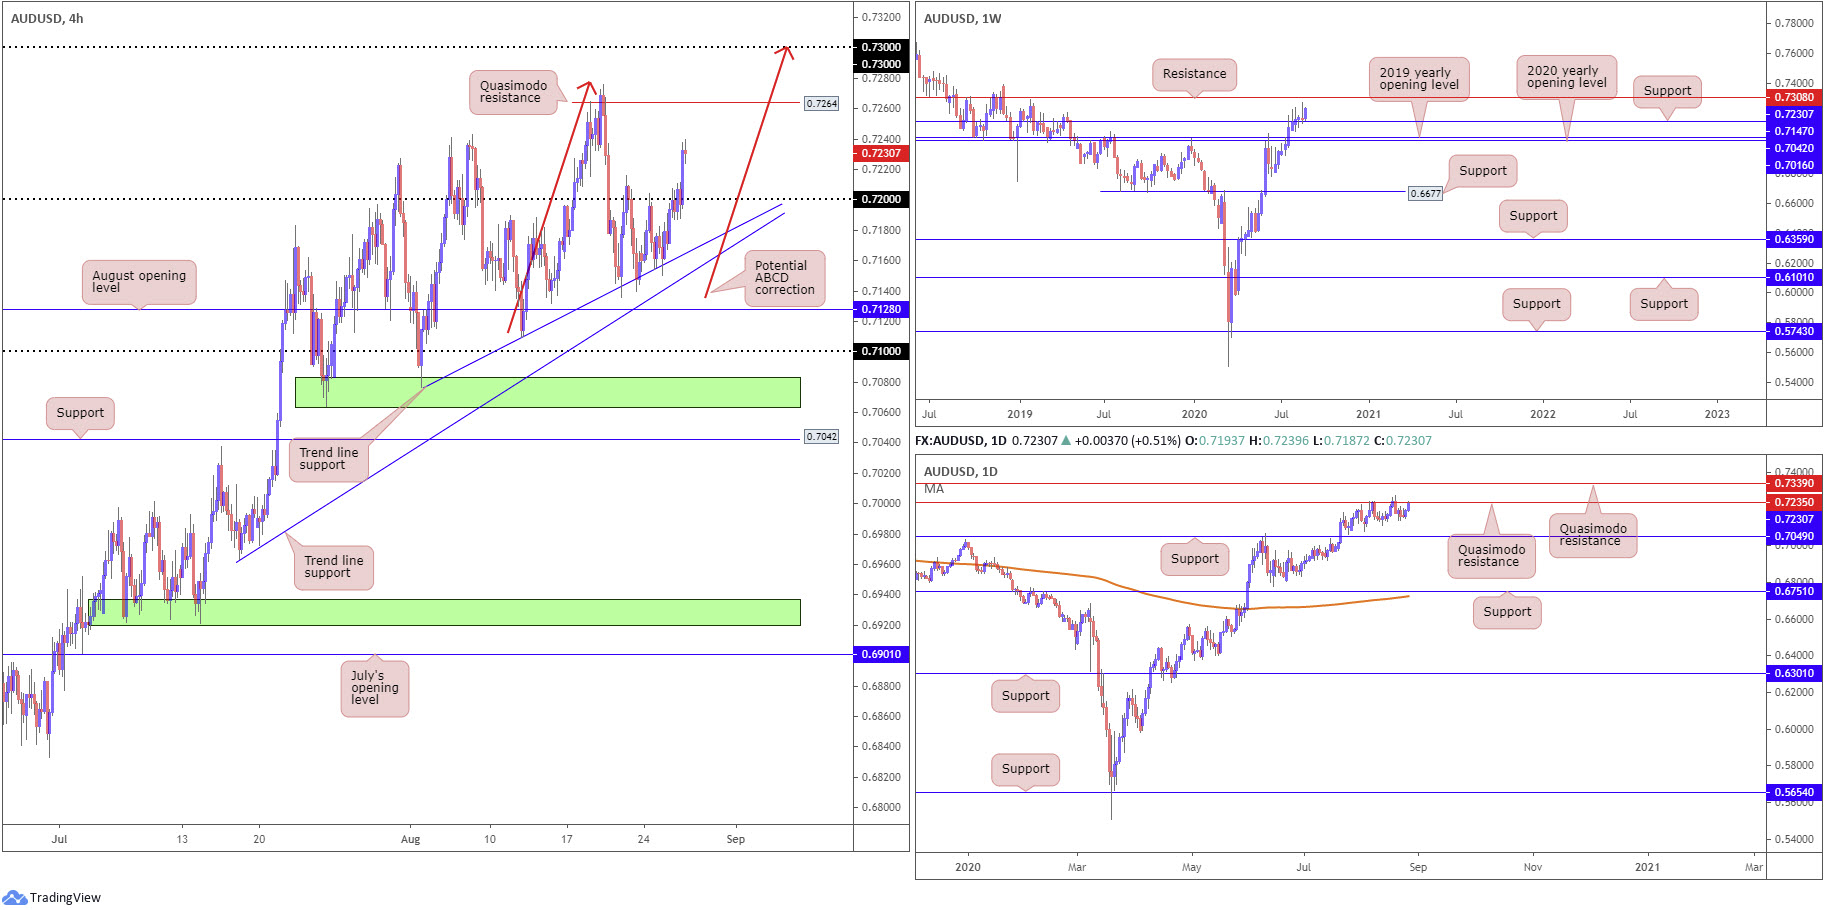
Wednesday also saw the Australian dollar take advantage of the greenback’s inability to sustain any lasting momentum.
The key observation on the H4 timeframe right now is the recent break of 0.72, a move that potentially sets the stage for a run to H4 Quasimodo resistance at 0.7264, with a break perhaps clearing to 0.73. Note also that this psychological level comes with potential ABCD (red arrows) bearish structure.
As aired in Wednesday’s analysis, however, Quasimodo resistance at 0.7235 on the daily timeframe, which recently welcomed price action, could hinder upside, despite the immediate trend facing northbound. On the other hand, we have support coming in at 0.7147, based on the weekly timeframe, clearly aiding bullish momentum at the moment, with the chart exhibiting scope to as far north as resistance at 0.7308.
Areas of consideration:
With daily Quasimodo resistance at 1.3250 in play, this may deter further buying in this market, short term. What it may also do is put forward a 0.72 retest on the H4 today, with buyers likely to try and defend the round number on the back of weekly price suggesting we could be heading for the 0.73ish region.
USD/JPY:
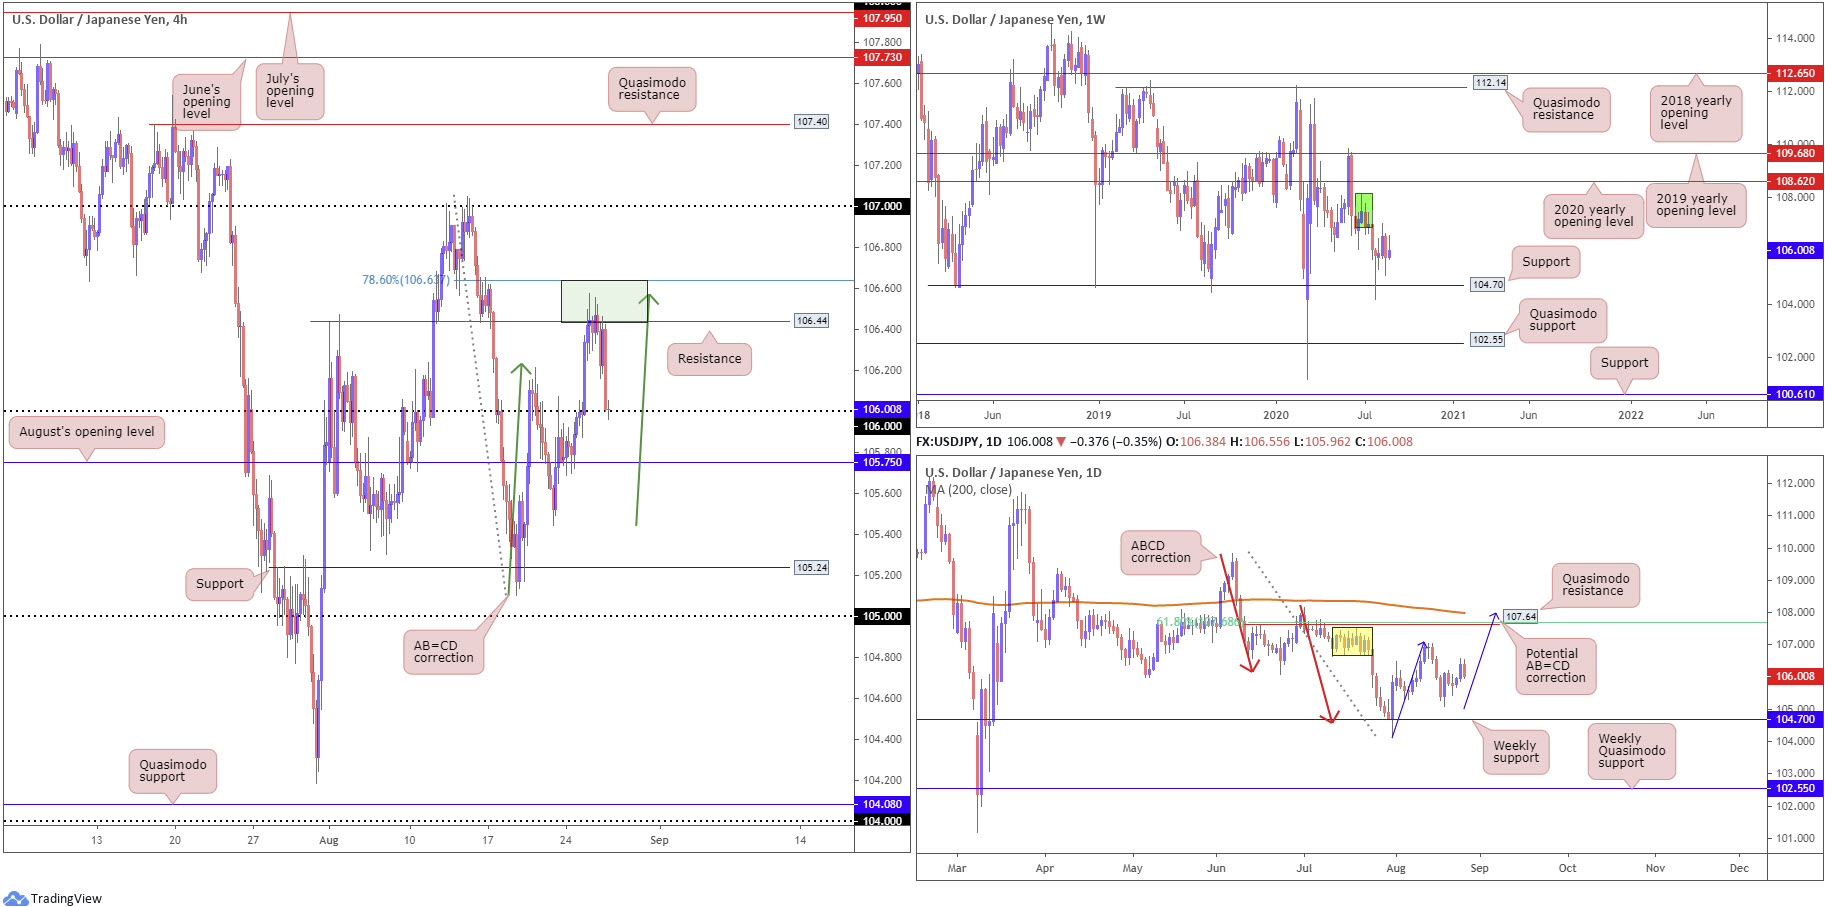
In line with the US dollar index retaking 93.00 to the downside, despite optimistic data, USD/JPY tumbled from an area of H4 resistance between 106.64/106.44 (light green), made up of resistance at 106.44, AB=CD resistance (green arrows) at 106.57 and a 78.6% Fibonacci retracement ratio at 106.64.
H4 activity is currently settled at 106, with buyers yet to show much enthusiasm. August’s opening level at 105.75 rests as the next port of call under 106, with a break potentially stirring moves to support at 105.24.
From the weekly timeframe, we can see supply remains prominent at 108.16-106.88 (dark green) after price made its way off support at 104.70 at the end of July. The 2020 yearly opening level at 108.62 may enter view should additional upside take over.
From the daily timeframe, however, the August 19 recovery from 105.10 (ahead of weekly support mentioned above at 104.70) may, despite recent selling, represent the beginnings of a D-leg to a possible AB=CD bearish correction (blue arrows) at 108.00. Serving nearby the AB=CD structure, traders will also find Quasimodo resistance positioned nearby at 107.64, along with a 61.8% Fibonacci retracement ratio at 107.68 and the 200-day SMA (orange – 107.99).
Areas of consideration:
For those who read Wednesday’s technical briefing you may recall the following (italics):
The resistance area on the H4 between 106.64/106.44 (green), as you can see, is currently attracting sellers. This area, as stated in recent reports, represented an upside target for longs north of 106 and may contain enough energy to swerve things back to 106.
Longer-term traders, however, are still likely watching for more bullish momentum to form, perhaps completing the AB=CD configuration on the daily timeframe.
Going forward, 106 offers limited confluence as a support, therefore breaking to August’s opening level at 105.75 could be in store today which may interest intraday sellers. Breaking 105.75 could also extend losses, targeting H4 support at 105.24.
USD/CAD:
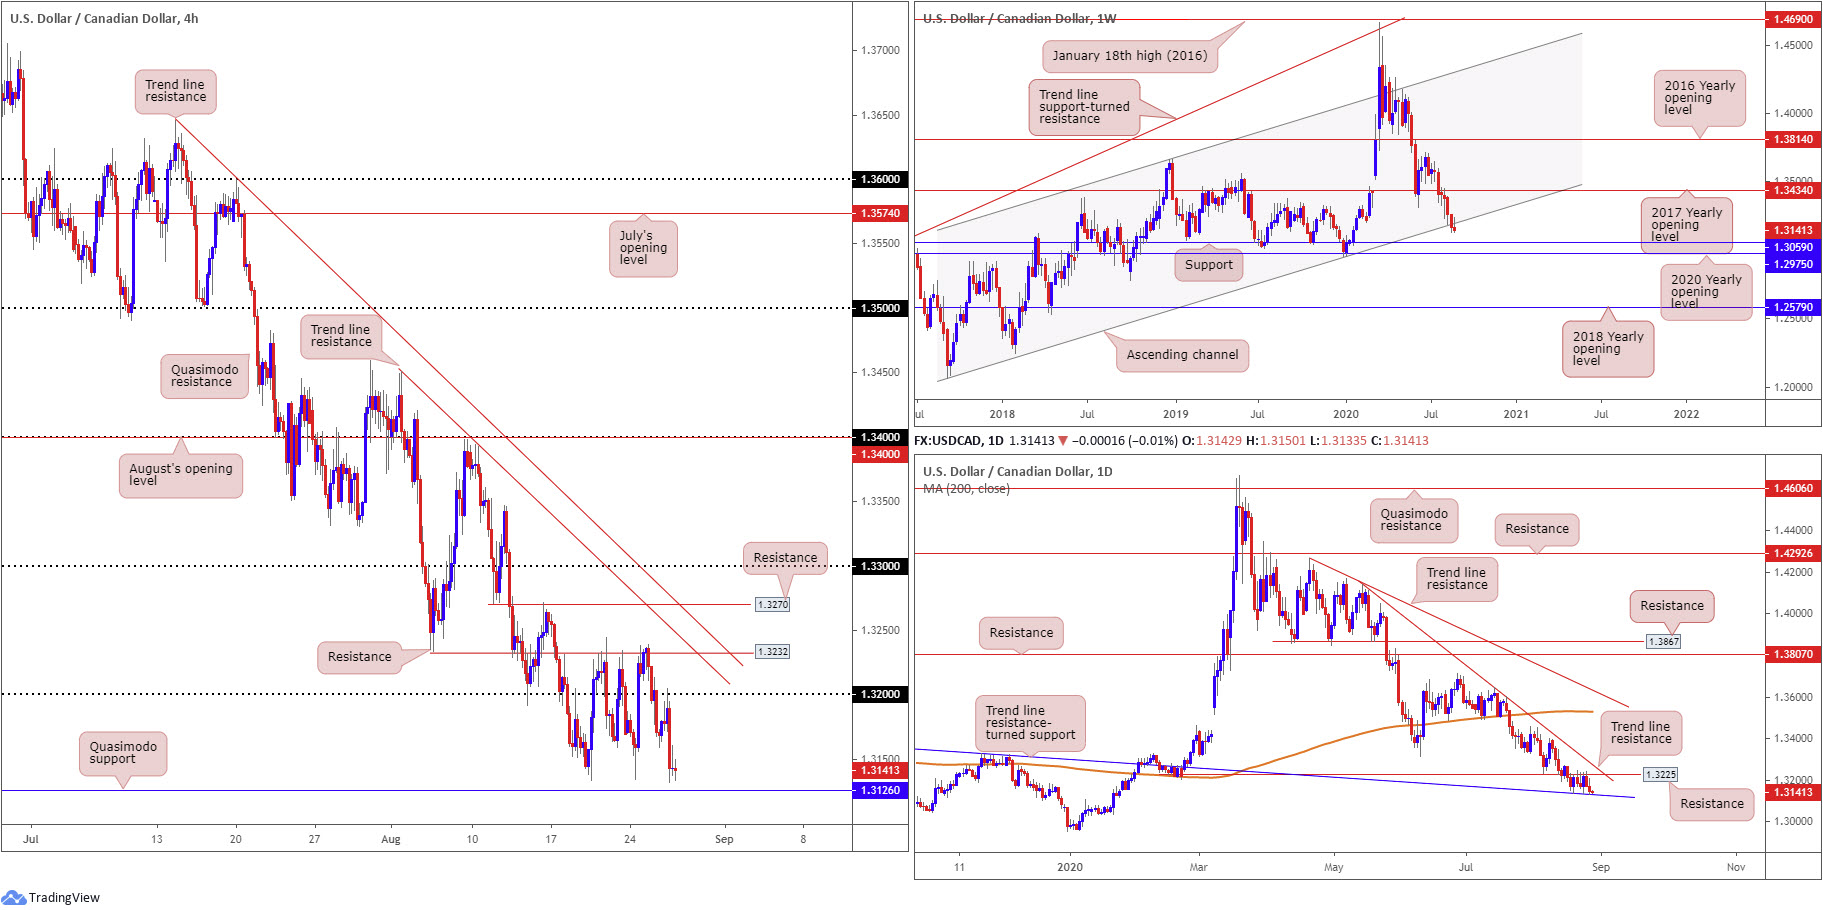
USD/CAD curved lower following a clear-cut retest at 1.32 on Wednesday, guiding H4 candles to within striking distance of Quasimodo support coming in at 1.3126. WTI printed modest gains, closing positive above $43.00 a barrel, and the US dollar index closed under the 93.00 handle.
Daily price movement is seen closing in trend line resistance-turned support, extended from the high 1.3382, a level sharing the same space as H4 Quasimodo support highlighted above.
Further out on the weekly timeframe, long-term channel support, taken from the low 1.2061, remains under pressure, with traders potentially leaning towards support at 1.3059.
Areas of consideration:
While weekly players appear to be getting comfortable south of channel support, the H4 Quasimodo support at 1.3126 and daily trendline support combination could hinder further selling. However, the bounce from the aforementioned H4/daily levels is unlikely to be anything to get excited about given the immediate trend firmly pointing to the downside.
USD/CHF:
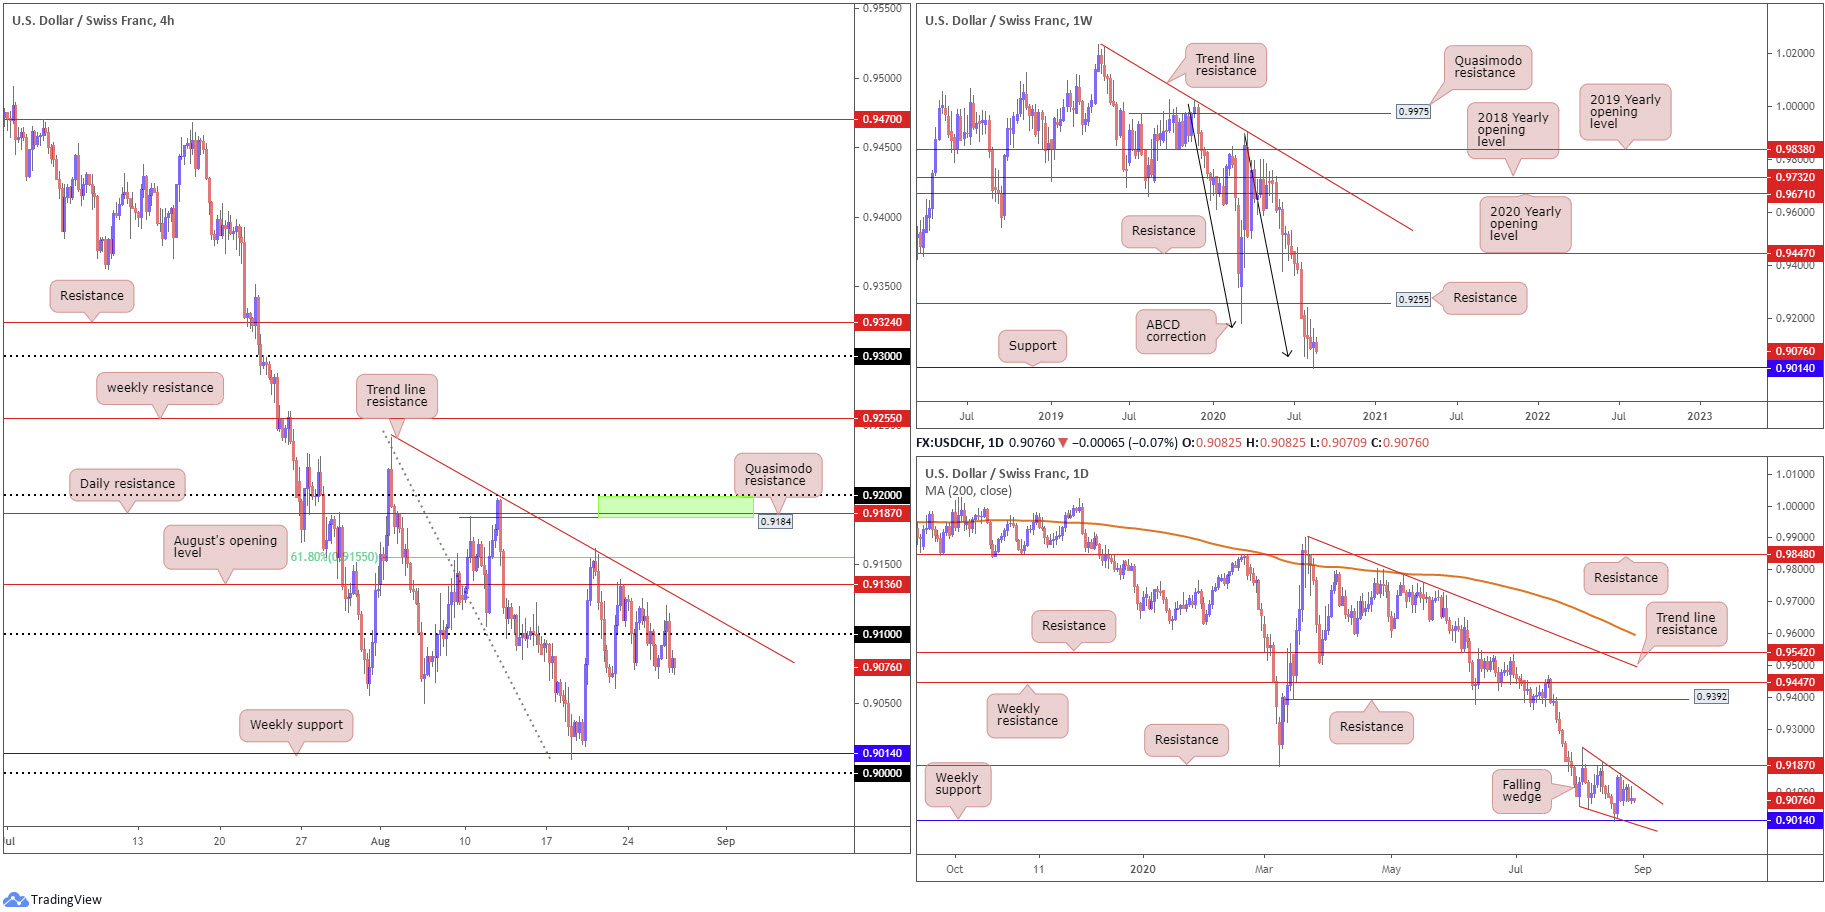
USD/CHF finished Wednesday mostly unchanged, fading session peaks at 0.9120. As evident from the charts, there has been minimal change, in terms of technical structure, therefore much of the following analysis represents Wednesday’s outlook.
Recent analysis discovered support on the weekly timeframe at 0.9014, a level garnering additional impetus from ABCD support at 0.9051 (black arrows). This shines the spotlight on resistance at 0.9255, a prior Quasimodo support level. Beyond current support, the next layer of support is not visible until reaching 0.8792.
Out of the daily timeframe, we can see price action presenting a falling wedge pattern, pencilled in from the high 0.9241 and a low of 0.9056. Penetrating this pattern to the upside, preferably also taking out resistance at 0.9187, might be enough to persuade a reversal and attempt an approach to at least weekly resistance mentioned above at 0.9255, followed by the falling wedge take-profit target (can be measured once a breakout occurs).
From the H4 timeframe, Wednesday settled south of 0.91 after failing to reach for trend line resistance, drawn from the high 0.9241, and August’s opening level at 0.9136. Above 0.9136, we see a 61.8% Fibonacci retracement ratio at 0.9155, followed by Quasimodo resistance at 0.9184, a level buffered by daily resistance underscored above at 0.9187.
Areas of consideration:
Outlook unchanged.
The rebound from weekly support at 0.9014 is significant in this market, particularly as it’s joined with a falling wedge pattern on the daily timeframe. To take advantage of higher timeframe structure, based on the H4 timeframe, a H4 close above 0.92 is needed, targeting weekly resistance at 0.9255.
Although prospective buyers may be watching for a break above 0.92, the area made up between 0.92, the H4 Quasimodo resistance at 0.9184 and daily resistance at 0.9187 (green), could attract intraday sellers, should we climb higher.
Further dips may also form back to weekly support at 0.9014, yet this time potentially taking in the key figure 0.90 on the H4 to accumulate fresh buyers.
Dow Jones Industrial Average:
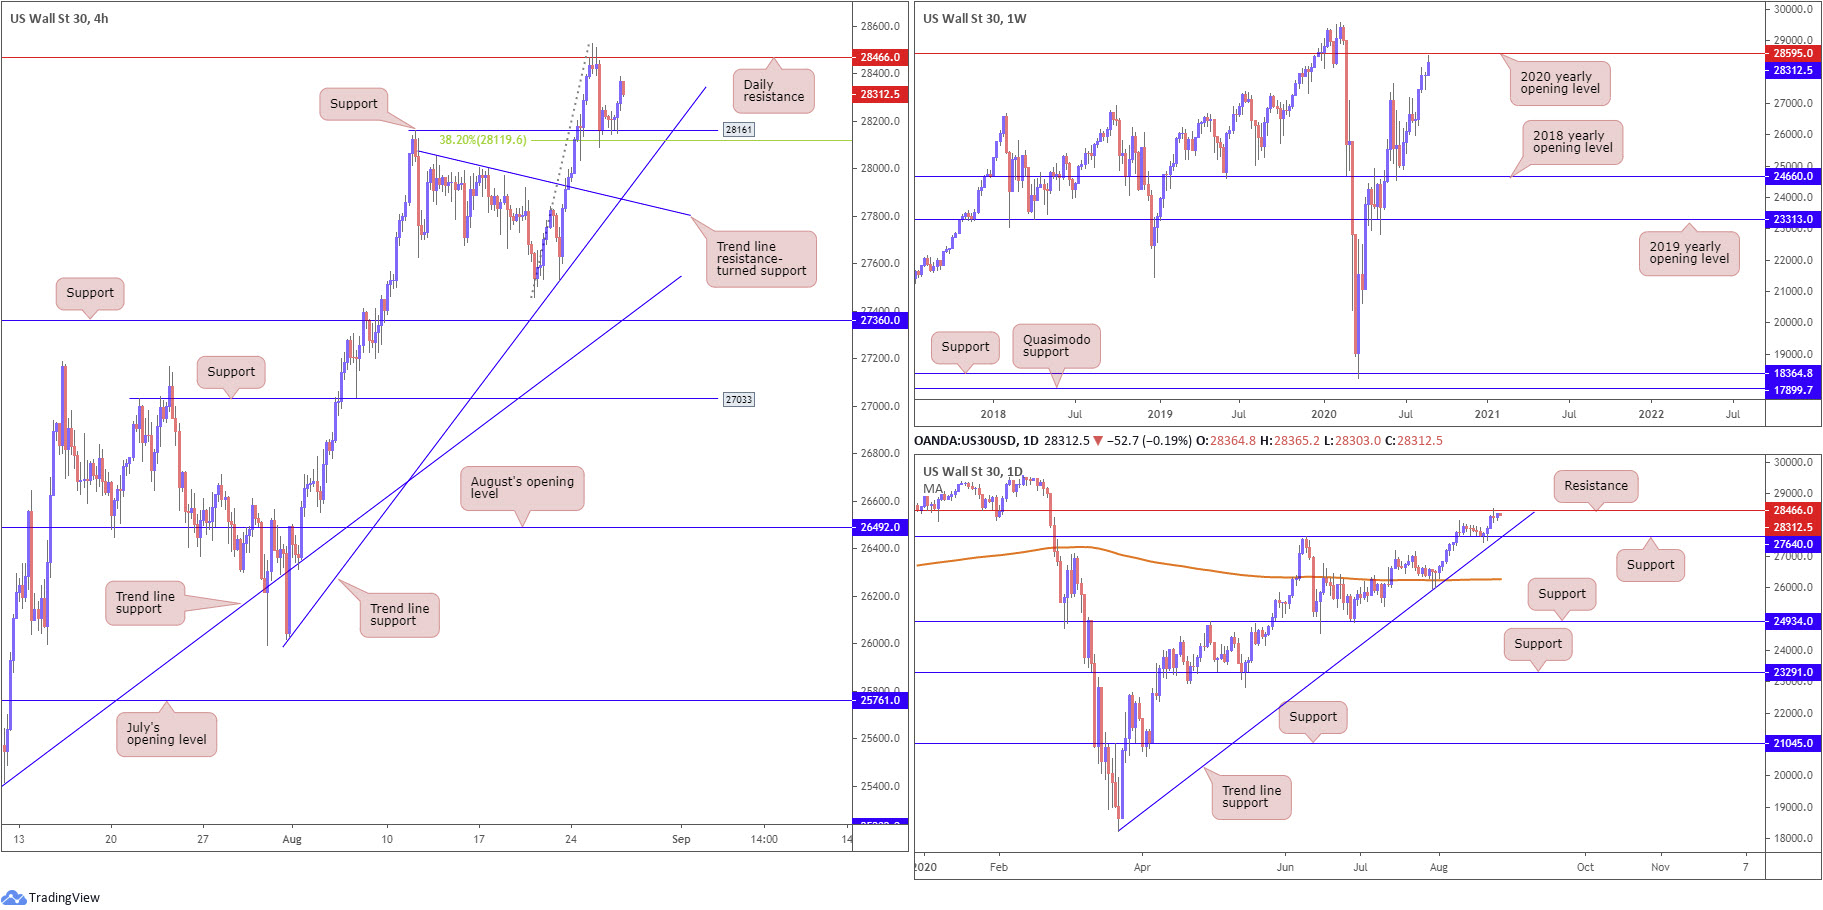
Major US equity benchmarks rallied higher on Wednesday amid strong gains in technology and consumer services stocks. The Dow Jones Industrial Average rallied 83.48 points, or 0.30%; the S&P 500 advanced 35.11 points, or 1.02% and the tech-heavy Nasdaq 100 traded higher by 250.14 points, or 2.13%.
On the technical front, Wednesday held the recent retest of H4 support at 28161, a base converging with a 38.2% Fibonacci ratio at 28119. This brought light back on daily resistance at 28466, which held price action strongly lower on Tuesday. What’s also interesting here is weekly resistance, formed by way of the 2020 yearly opening level, at 28595 stationed just north of the current daily resistance level.
Failure to hold off current H4 support could have the candles reach for trend line support, extended from the low 26017, aligning closely with a trend line resistance-turned support, taken from the high 28051. However, at this point, we may see daily action push for support at 27640, merging with daily trend line support, taken from the low 18213.
Areas of consideration:
With the current trend strongly pointing to the upside right now, H4 bulls may continue to defend support at 28161 and eventually re-attempt to take daily resistance at 28466.
Daily support at 27640 is another point worth keeping eyes on should further dips materialise, having noted daily trend line convergence.
XAU/USD (GOLD):
For those who read Wednesday’s technical outlook you will likely recall the following (italics):
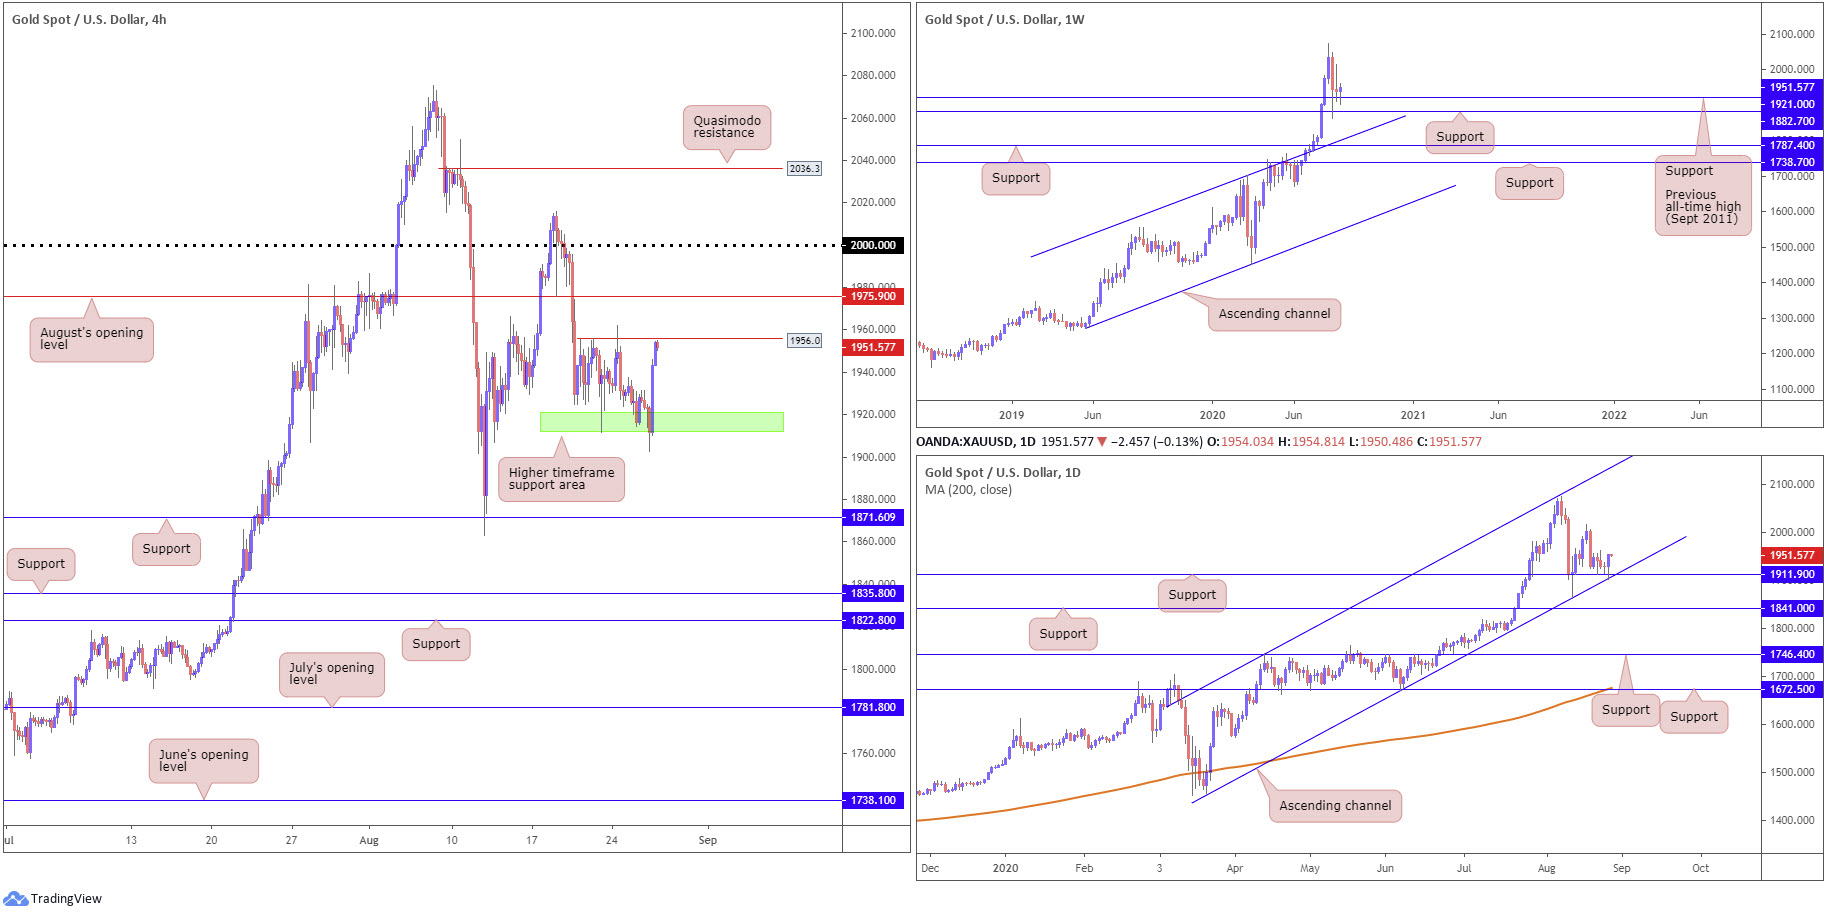
With $1,911.90-$1,921.00 (daily support/weekly support) making an appearance on Tuesday and producing a notable H4 bullish candle, this could be enough to tempt buying today, with the majority of protective stop-loss orders tucked around $1,908.36. The initial upside target will likely be centred around August’s opening level from $1,975.90 on the H4.
Despite nudging to a session low at $1,902.72, price eventually respected $1,911.90-$1,921.00 on Wednesday. In the shape of two dominant H4 bullish candles, we concluded the session forming an outside day reversal on the daily timeframe. This may keep the yellow metal on the winning side of the table today, targeting August’s opening level from $1,975.90 on the H4. However, before we reach this far north, thanks to yesterday’s spike lower, a fresh Quasimodo resistance level at $1,956.08 must be taken out.
Areas of consideration:
The reaction from higher timeframe supports at $1,911.90-$1,921.00 has likely caught the attention of fresh buyers. A H4 close above Quasimodo resistance at $1,956.08 would likely see a continuation to the upside, tackling $1,975.90 and then reaching for $2,000.00.
The accuracy, completeness and timeliness of the information contained on this site cannot be guaranteed. IC Markets does not warranty, guarantee or make any representations, or assume any liability regarding financial results based on the use of the information in the site.
News, views, opinions, recommendations and other information obtained from sources outside of www.icmarkets.com.au, used in this site are believed to be reliable, but we cannot guarantee their accuracy or completeness. All such information is subject to change at any time without notice. IC Markets assumes no responsibility for the content of any linked site.
The fact that such links may exist does not indicate approval or endorsement of any material contained on any linked site. IC Markets is not liable for any harm caused by the transmission, through accessing the services or information on this site, of a computer virus, or other computer code or programming device that might be used to access, delete, damage, disable, disrupt or otherwise impede in any manner, the operation of the site or of any user’s software, hardware, data or property.


