
A note on lower timeframe confirming price action…
Waiting for lower timeframe confirmation is our main tool to confirm strength within higher timeframe zones, and has really been the key to our trading success. It takes a little time to understand the subtle nuances, however, as each trade is never the same, but once you master the rhythm so to speak, you will be saved from countless unnecessary losing trades. The following is a list of what we look for:
- A break/retest of supply or demand dependent on which way you’re trading.
- A trendline break/retest.
- Buying/selling tails/wicks – essentially we look for a cluster of very obvious spikes off of lower timeframe support and resistance levels within the higher timeframe zone.
- Candlestick patterns. We tend to only stick with pin bars and engulfing bars as these have proven to be the most effective.
We search for lower timeframe confirmation between the M15 the H1 timeframes, since most of our higher-timeframe areas begin with the H4. Stops are usually placed 5-10 pips beyond confirming structures.
EUR/USD:
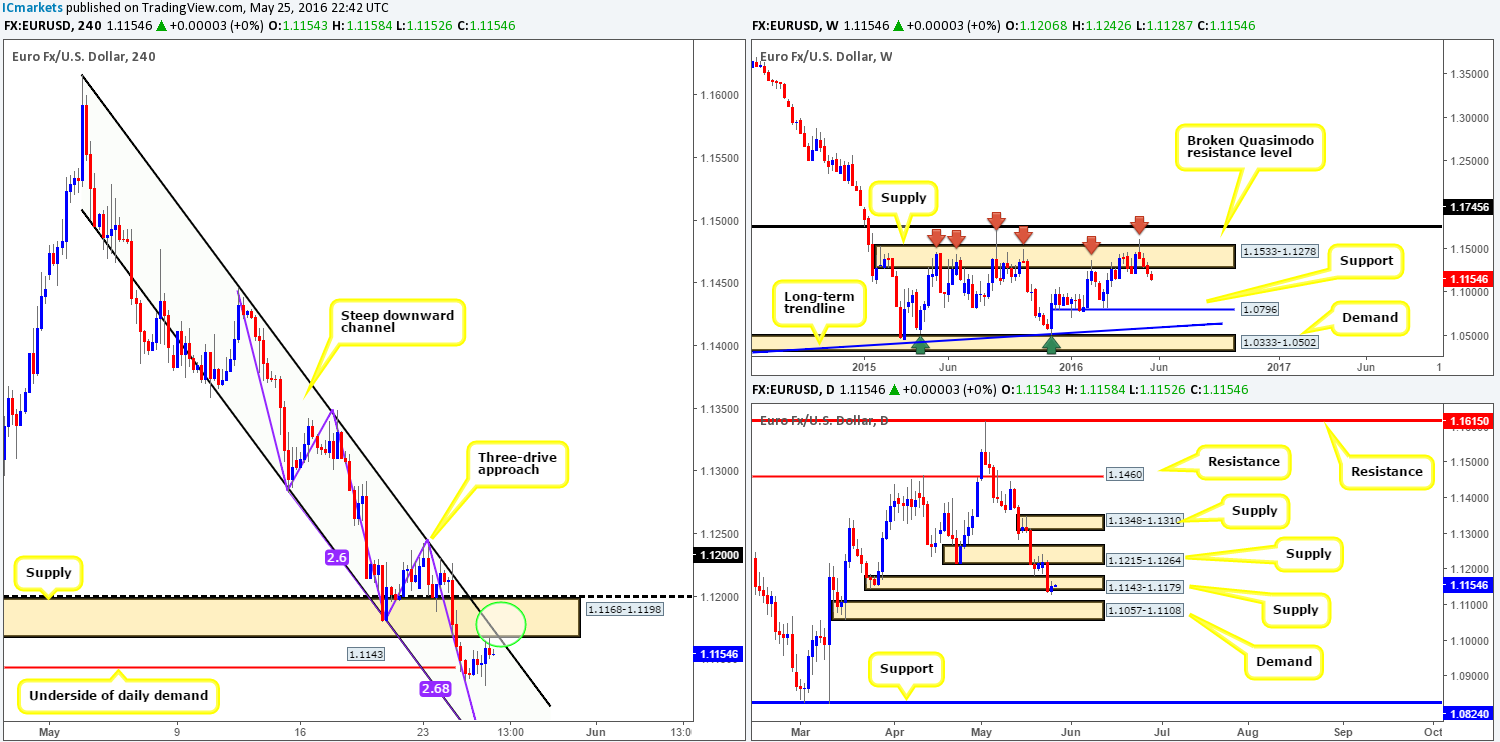
Starting up on the weekly chart, we can see that the bears have dominated this market since whipsawing through the upper boundary of a major weekly supply zone at 1.1533-1.1278. In our estimation, the next downside target can be seen at 1.0796 – a weekly support. Zooming in and looking at the daily chart, daily demand at 1.1143-1.1179 was recently consumed and is now being retested as supply. In the event that this boundary manages to hold price, it’s possible we may see the shared currency pay a visit to daily demand penciled in at 1.1057-1.1108.
Stepping over to the H4 chart, things become a little more interesting. Firstly, take note that this pair is currently entrenched in a steep H4 downward channel (1.1616/1.1500), secondly, see how price is forming a symmetrical H4 three-drive bullish pattern within this H4 channel beginning from the high 1.1446 (see blue lines). On top of this, both the H4 channel support line and the three-drive formation tie in with a nice-looking H4 demand coming in at 1.1057-1.1096 (sits within the extremes of the above said daily demand zone), which is positioned just below the 1.11 handle.
Our suggestions: Shorts (at market) from the H4 supply zone seen at 1.1168-1.1198 which converges with the H4 channel resistance line (1.1616) could be something to consider today (see green circle), targeting the aforementioned H4 demand base. Additionally, traders may be interested in entering long from this said H4 demand should price reach this low today given the confluence we noted above. However, play this area carefully guys as let’s not forget that the weekly chart shows further downside is a possibility.
Levels to watch/live orders:
- Buys: 1.1057-1.1096 [Tentative – confirmation required] (Stop loss: dependent on where one confirms this area).
- Sells: 1.1168-1.1198 [possible market entry here] (Stop loss: above the H4 supply at 1.1205).
GBP/USD:
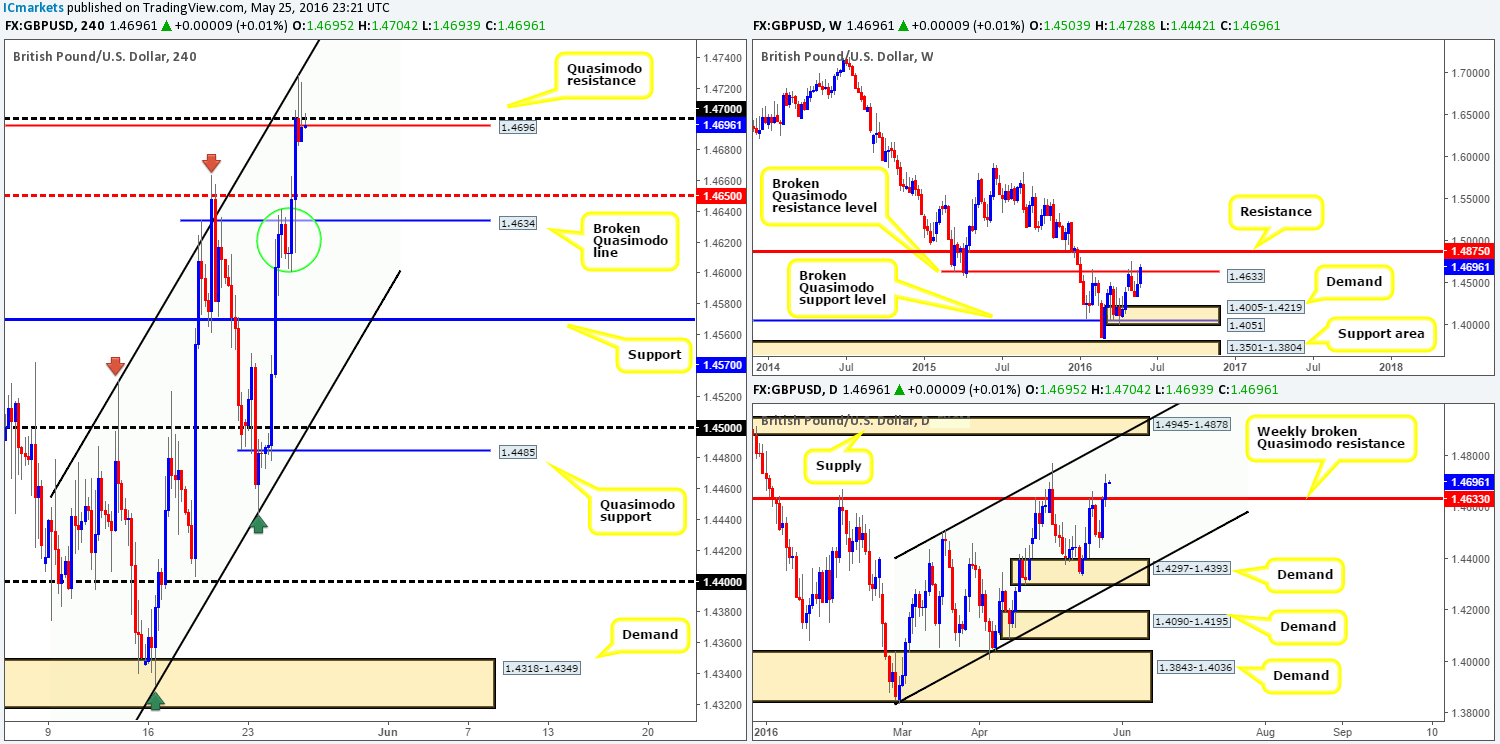
Following a short-lived bounce from the H4 Quasimodo level at 1.4634, the bulls continued to press north yesterday. Trade, as can be seen from the chart, ended aggressively whipsawing through both a H4 Quasimodo barrier at 1.4696 and the 1.47 handle, which shortly after tagged in offers at a H4 channel resistance line extended from the high 1.4530.
In regard to price trading at a particularly promising sell point right now, what’s the situation like over on the higher timeframes? Looking across to the daily chart, price has closed above a major weekly broken Quasimodo (BQM) resistance line at 1.4633, which may encourage further buying in this market up to daily supply at 1.4945-1.4878 (fuses nicely with a daily channel resistance line taken from the high 1.4514). Despite this close, however, it may be worth waiting for the weekly candle to close shop before presuming that this weekly barrier has indeed been consumed.
Our suggestions: In light of the higher-timeframe structure (see above), our team is going to humbly pass on selling from the 1.47 region today, as this most we see this market reaching is the mid-way H4 support region at 1.4650. What we are interested in, nevertheless, is the H4 demand formed on the break of the H4 Quasimodo line (1.4634) at 1.4601-1.4631 (green circle), since this was also the H4 decision-point area which saw price push above the weekly BQM level. We would consider taking a long from here today if and only if the bounce was supported by lower timeframe confirmation (for ideas on confirming areas please see the top of this report), as we are unsure if the break above the weekly level is a continuation move or simply a stop hunt to take this pair lower!
Levels to watch/live orders:
- Buys: 1.4601-1.4631 [Tentative – confirmation required] (Stop loss: dependent on where one confirms this area).
- Sells: Flat (Stop loss: N/A).
AUD/USD:
In our previous report (see link below), we mentioned that we had taken a long position from 0.7150 on the basis of a converging H4 Quasimodo line at 0.7145 and a H4 channel support extended from the low 0.7299. We still have our stop set at breakeven and 50% of our remaining position still running in the market (50% has already been cashed in just below 0.72). As already stated yesterday, our next take-profit line is the H4 resistance level at 0.7241, which, as you can see, is proving difficult to reach thanks to a strong pocket of offers sitting around the 0.72 handle.
In that price is lurking around the top-side of a weekly demand base at 0.7108-0.7186 right now, we feel this may be enough to cut above the 0.72 number. The reason for selecting the H4 resistance as our next port of call for profit taking is simply due to it sitting within a daily supply at 0.7259-0.7226, and also lining up beautifully with a H4 channel resistance extended from the high 0.7402.
Our suggestions: due to a rather lackluster performance yesterday, our outlook remains the same in that neither a long nor short seems attractive at current prices.

Levels to watch/live orders:
- Buys: 0.7150 [Live] (Stop loss: breakeven).
- Sells: Flat (Stop loss: N/A).
USD/JPY:
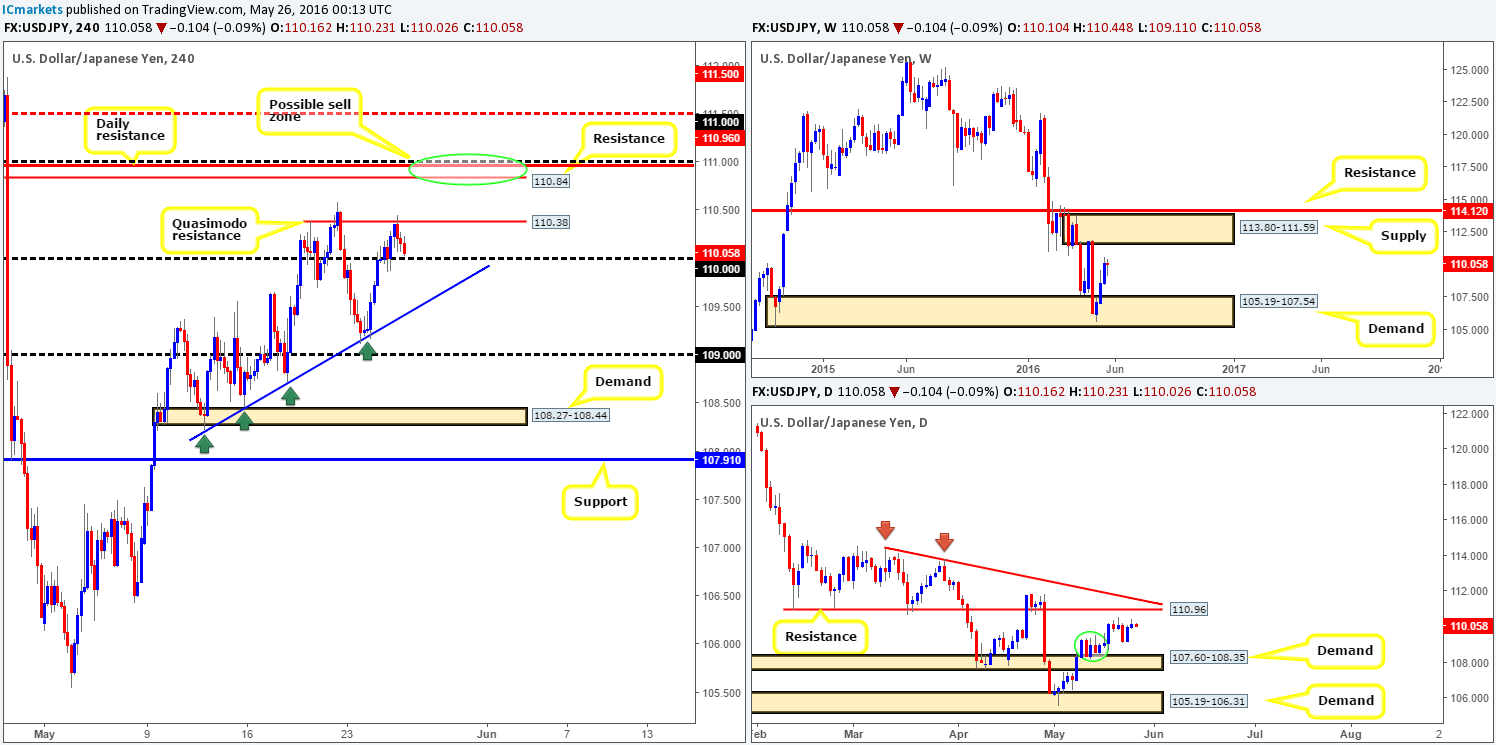
In recent trading, price retested the 110 handle as support and quickly rallied to cross swords with a H4 Quasimodo barrier at 110.38 going into yesterday’s American session. Offers around this H4 line are clearly proving too strong for bids at the moment as price is, at the time of writing, now seen retreating back to the 110 region.
We feel the sellers likely have their work cut out for them if they intend on trying to break beyond 110 today due to the following:
- The Nikkei is looking very strong at the moment, with the next H4 resistance not in view until around the 17141 region.
- Weekly action continues to gravitate in the direction of a weekly supply zone given at 113.80-111.59.
- Daily price shows room to advance north up to daily resistance seen at 110.96, which fuses nicely with a daily trendline resistance from the high114.44.
Our suggestions: Our team has no interest in buying 110 or selling from the current H4 Quasimodo resistance. We are also not attracted to buying on any break seen above this H4 Quasimodo. What does tickle our fancy, however, as we mentioned in the previous report, is the 111.00/110.84 zone (round-number 111.00, daily resistance at 110.96 and H4 resistance at 110.84 [green circle]) for sell opportunities. Despite the collection of resistances seen here, we would still require lower timeframe confirmation (see the top of this report for ideas on how to find confirmation). The reason being is, as we mentioned above, weekly action could very well continue north up to the underside of the above said weekly supply – essentially the H4 mid-way resistance 111.50, fifty pips above our sell zone!
Levels to watch/live orders:
- Buys: Flat (Stop loss: N/A).
- Sells: 111.00/110.84 region [Tentative – confirmation required] (Stop loss: dependent on where one confirms this area).
USD/CAD:
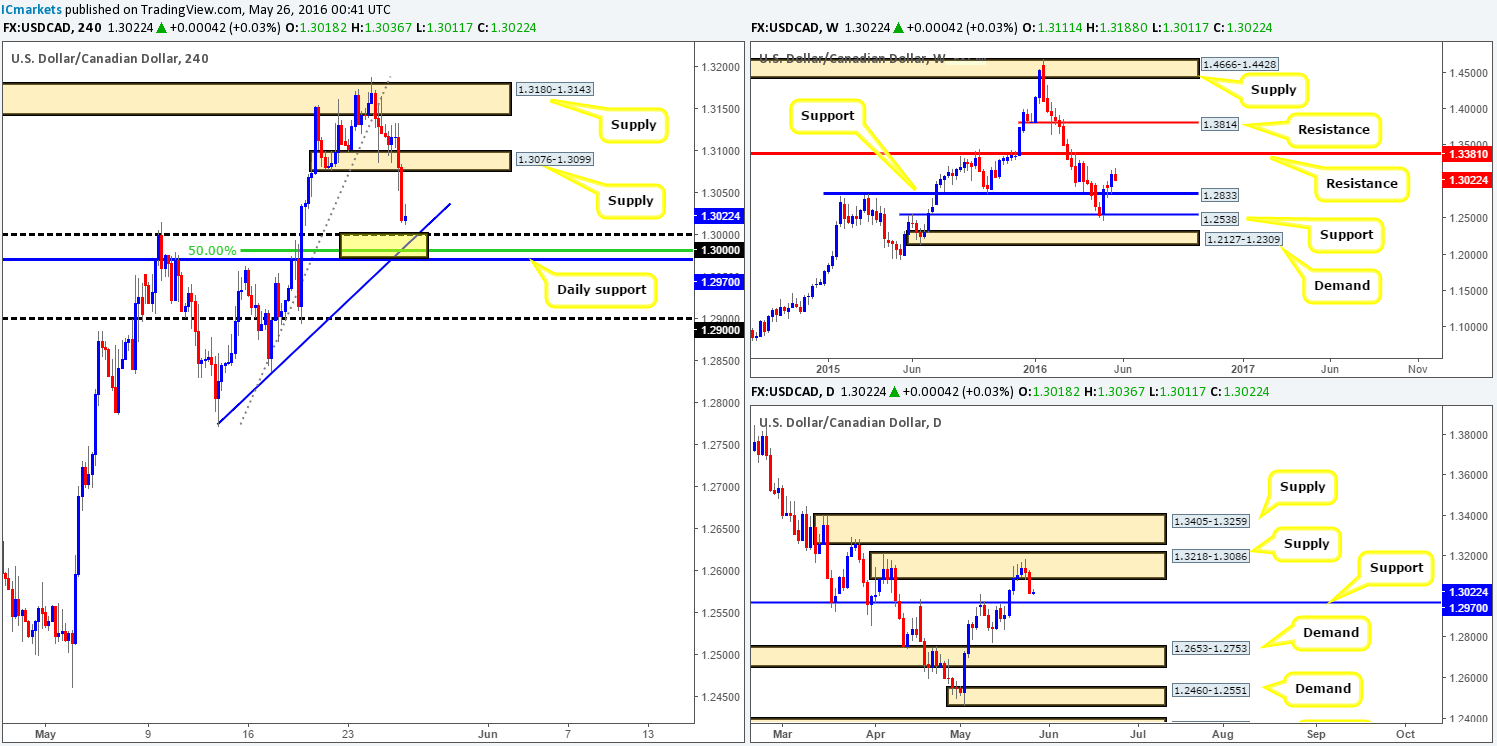
Following the BoC’s decision to keep its interest rates at 0.50% the USD/CAD plunged to new depths yesterday, breaking through H4 demand at 1.3076-1.3099 (now acting supply) and closing the day just ahead of the large psychological boundary 1.30.
The 1.30 number, as you can probably see, also brings together a collection of noteworthy supports. This includes a H4 50.0% Fibonacci support at 1.2979, a H4 trendline support taken from the low 1.2771 and a daily support line coming in at 1.2970. To our way of seeing things, this small thirty-pip zone (see yellow rectangle) marks a high-probability buy zone.
Our suggestions: Due to price currently trading from a strong daily supply zone at 1.3218-1.3086, entering long from our H4 buy zone (see above) without lower timeframe confirmation is not something our team would be comfortable taking part in. Therefore, should we manage to spot either an engulf of demand and subsequent retest, a trendline break/retest or simply a collection of selling wicks around a lower-timeframe resistance following a test of this H4 area, we’d jump in long from here, targeting H4 supply at 1.3076-1.3099.
We search for lower timeframe confirmation between the M15 the H1 timeframes, since most of our higher-timeframe areas begin with the H4. Stops are usually placed 5-10 pips beyond confirming structures.
Levels to watch/live orders:
- Buys: 1.2970/1.3000 [Tentative – confirmation required] (Stop loss: dependent on where one confirms this area).
- Sells: Flat (Stop loss: N/A).
USD/CHF:
Due to a rather lackluster session yesterday, much of the following analysis will echo similar thoughts put forward in our previous report…
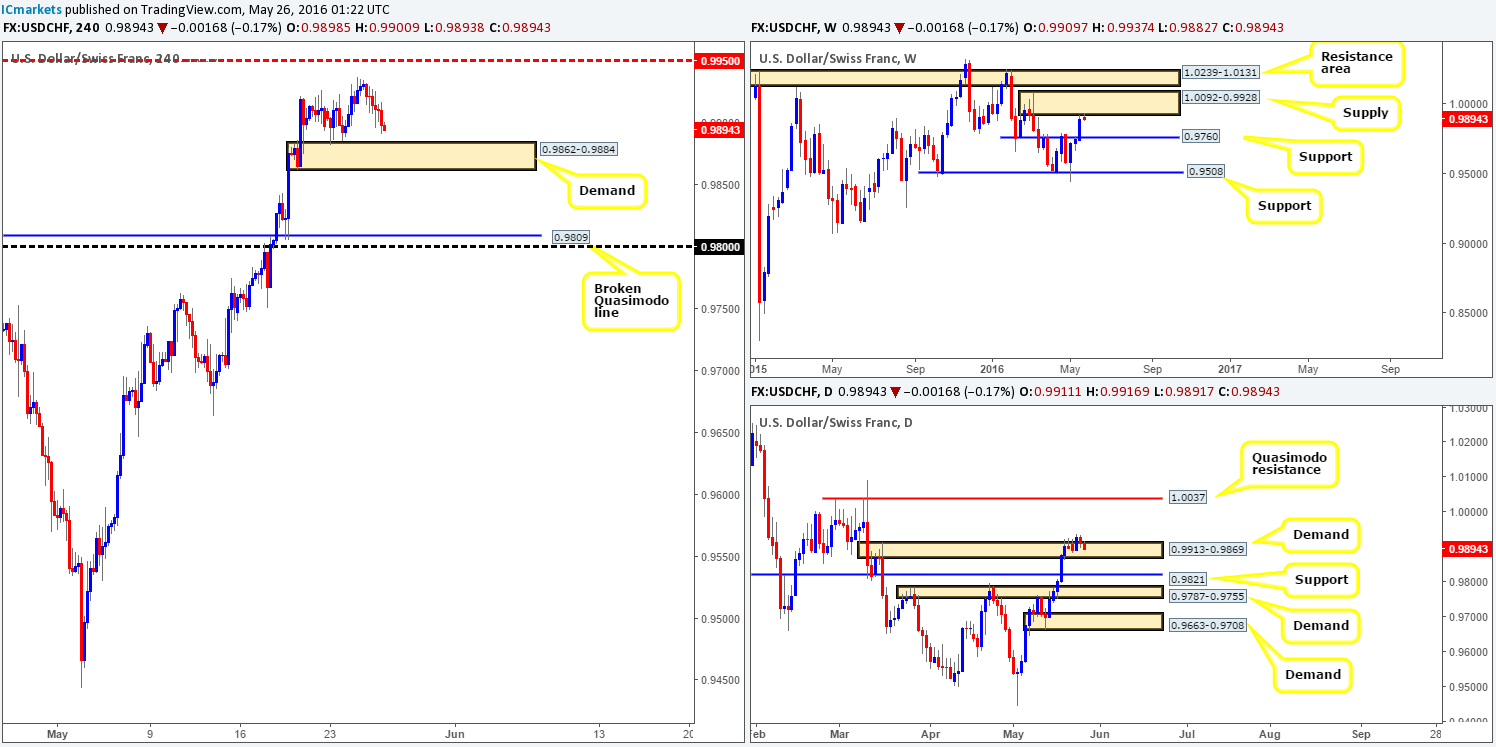
From the top this morning, weekly action is slightly edging lower from the underside of weekly supply logged in at 1.0092-0.9928. Given the size of this barrier, however, it is still possible that we may see further buying into this area before weakness comes into the market. Moving down a level to the daily chart, the current picture shows price is now retesting a daily demand base seen at 0.9913-0.9869. In the event that this barrier holds firm, we may see this pair rally north to connect with a daily Quasimodo resistance line formed at 1.0037 (lurks deep within the current weekly supply area). Moving down one more level to the H4 chart, this unit is seen hovering just ahead of a H4 demand base chalked up at 0.9862-0.9884, which is positioned within the extremes of the current daily demand zone.
Our suggestions: In light of price trading at a weekly supply right now, the bears could step in at any moment! However, with daily price testing daily demand at 0.9913-0.9869, a continuation move north towards the daily Quasimodo resistance line could be seen, suggesting that the bulls may want to test the extremes of the above said weekly supply. In view of this, here are the options as we see it:
- Watch for price to retest the H4 demand base at 0.9862-0.9884 for a long trade. Granted, you would be buying into weekly supply, but at the same time, you’d also be trading in-line with daily flow.
- Look for lower timeframe sell setups at 0.9950. From here you’d be selling from weekly supply but against daily flow.
- Should 0.9950 fail, we’ll then focus on the daily Quasimodo resistance at 1.0037 coupled with 1.0000 (parity) to form a sell zone.
Other than the third option, our team highly recommends waiting for lower timeframe price action to form before risking capital (for ways of confirming price action, please see the top of this report). In regard to the third option, one could potentially sell at market between the daily Quasimodo line and parity and place their stop above the surrounding weekly supply zone. This is still just an idea for now, which could change depending on how price approaches the sell area.
Levels to watch/live orders:
- Buys: 0.9862-0.9884 [Tentative – confirmation required] (Stop loss: dependent on where one confirms this area).
- Sells: 0.9950 region [Tentative – confirmation required] (Stop loss: dependent on where one confirms this area).1.0037/1.0000 [Could possibly enter at market from this region – will depend on how the H4 price approach the sell zone] (Stop loss: dependent on how we decide to sell here).
DOW 30:
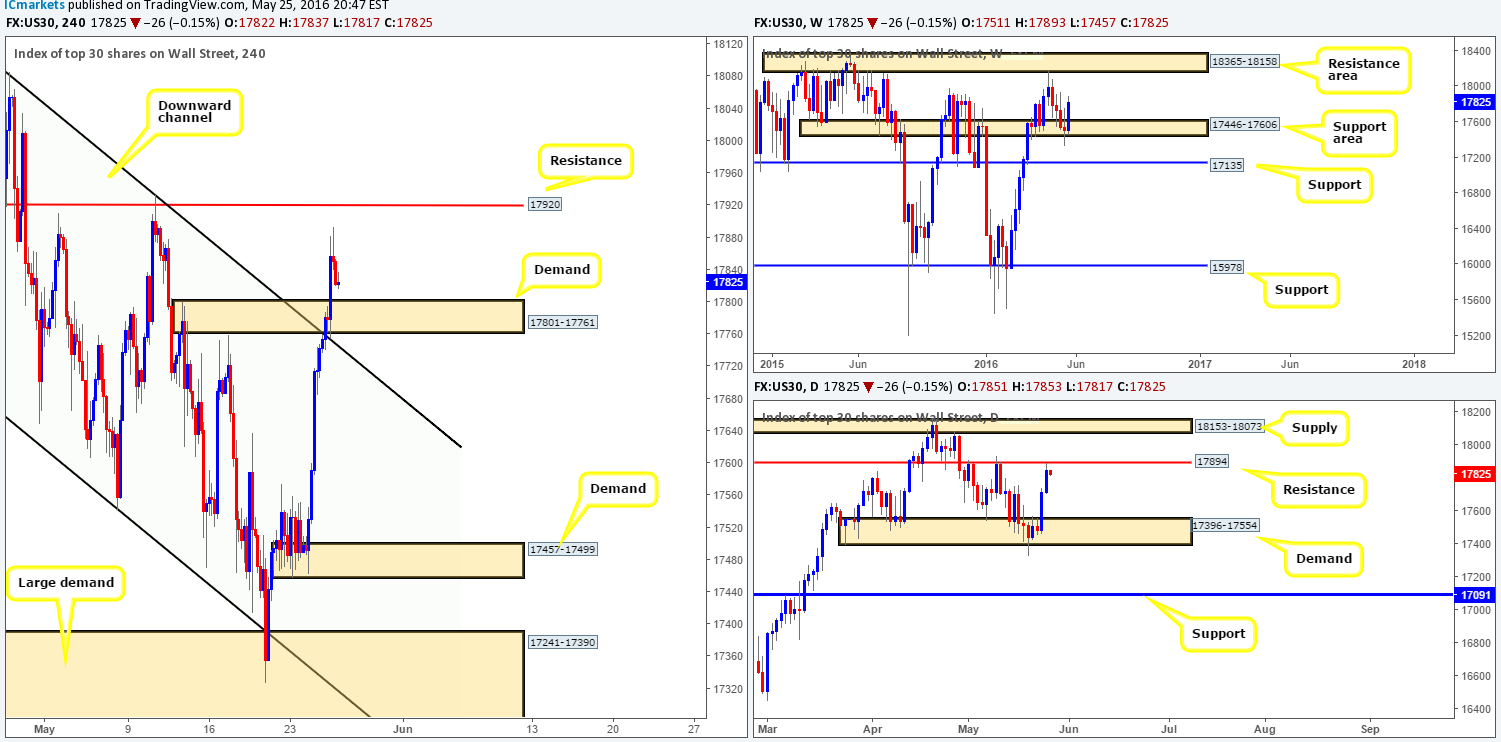
In recent sessions, we can see that the bulls continued to press forward, taking out both H4 supply at 17801-17761 (now acting demand) and also the H4 channel resistance line extended from the high 18167 (now acting support). However, there could be trouble ahead here traders! This recent advance has now tagged in offers around a daily resistance line seen at 17894, which has so far held ground. So knowing that price is selling-off from a daily resistance level, would buying at the newly-formed H4 demand zone make sense? Well, this is debatable in our opinion considering that the weekly chart shows room for the bulls to continue advancing north up to a weekly resistance area drawn from 18365-18158.
Our suggestions: Despite price selling-off from a daily resistance barrier there is still a good chance a reaction will be seen from the current H4 demand zone, due to what we’re seeing on the weekly picture right now (see above). Now, this does not mean that we’re placing a pending buy order at this H4 barrier and hoping that we’re correct! We would absolutely 100% need to see some form of lower timeframe confirmation take shape within the H4 demand base before risking capital on this idea (for ways of confirming higher-timeframe zones please see the top of this report). On the assumption that we do manage to pin down a lower timeframe buy setup here, we’ll immediately look to target the daily resistance line mentioned above at 17894 as a first take-profit target, followed then by H4 resistance at 17920.
Levels to watch/live orders:
- Buys: 17801-17761 [Tentative – confirmation required] (Stop loss: dependent on where one confirms this area).
- Sells: Flat (Stop loss: N/A).
GOLD:
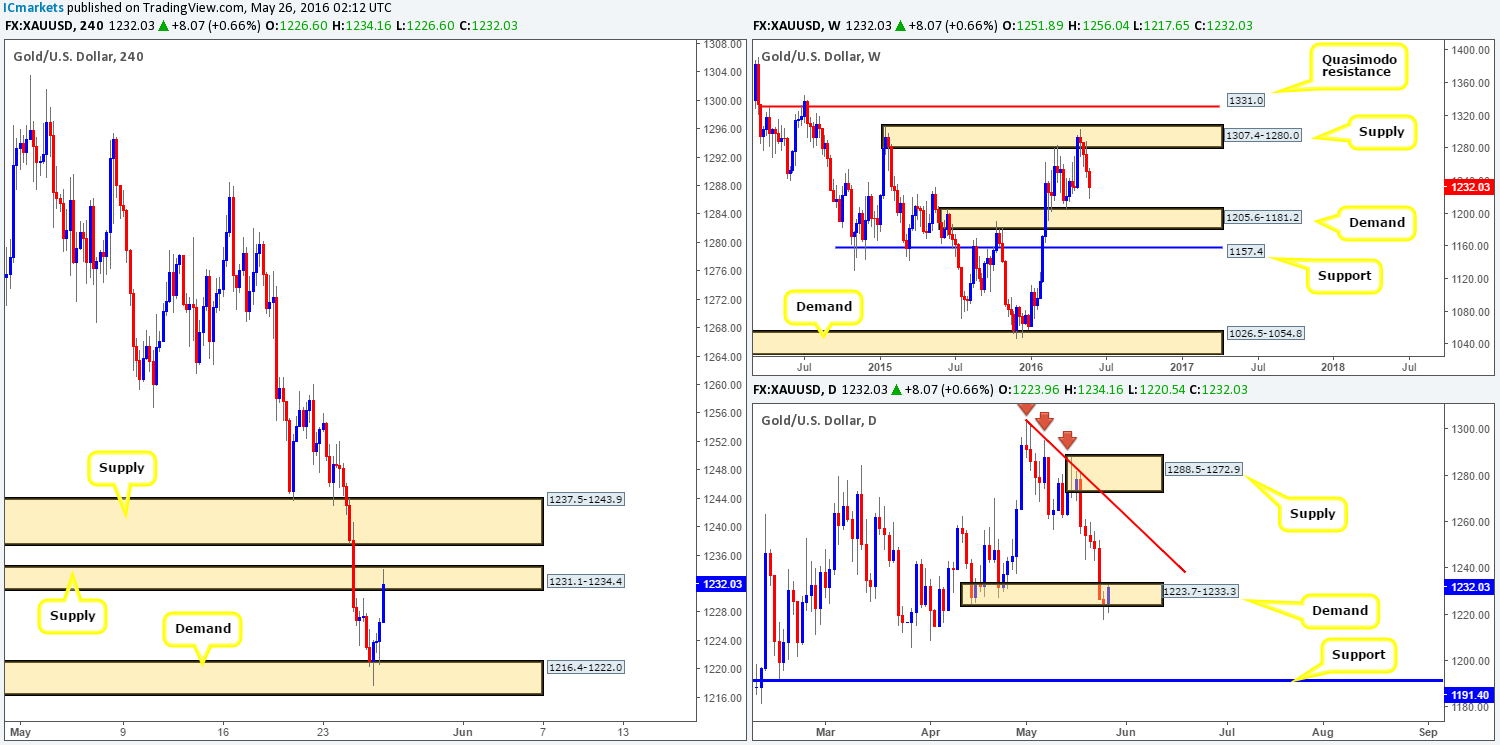
Gold continued to sink against the U.S. dollar yesterday, marking its sixth consecutive losing day in a row! Be that as it may, the yellow metal seems to be making a comeback advance from H4 demand at 1216.4-1222.0 at the moment, which, as can be seen from the H4 chart, just shook hands with a H4 supply barrier penciled in at 1231.1-1234.4.
From a technical standpoint, we feel this recent advance is simply a bout of short covering. Our reasoning lies within the higher-timeframe picture. Check out the weekly chart, price has been selling off for the past four weeks and, as far as we can see, looks to be heading to its next target – the weekly demand base at 1205.6-1181.2. In addition to this, the recent drive lower aggressively whipsawed through a daily demand area at 1223.7-1233.3, likely removing a huge chunk of buyers from this region, and by extension possibly clearing the path lower to daily support at 1191.4.
Our suggestions: Given the strength being seen from the weekly supply zone right now (see above), and weakness surrounding the current daily demand, we feel a short from either the H4 supply zone at 1231.1-1234.4, or the one directly above it at 1237.5-1243.9 is possible today. By selling this market from either area, however, take into consideration that you are selling into the current daily demand, but at the same time, you have the weekly momentum on your side!
With that being the case, our team will only consider the two H4 supply zones viable sell areas if and only if a lower timeframe signal forms. For those who have trouble confirming higher timeframe zones from the lower timeframes please check out our list of confirmation signals we use at the top of this report.
Levels to watch/live orders:
- Buys: Flat (Stop loss: N/A).
- Sells: 1237.5-1243.9 [Tentative – confirmation required] (Stop loss: dependent on where one confirms this area). 1231.1-1234.4 [Tentative – confirmation required] (Stop loss: dependent on where one confirms this area).


