
EUR/USD:
US President Trump met with European Commission President Juncker in the Oval Office of the White House in recent hours, resulting in both sides agreeing to work together to lower trade barriers and eliminate some tariffs.
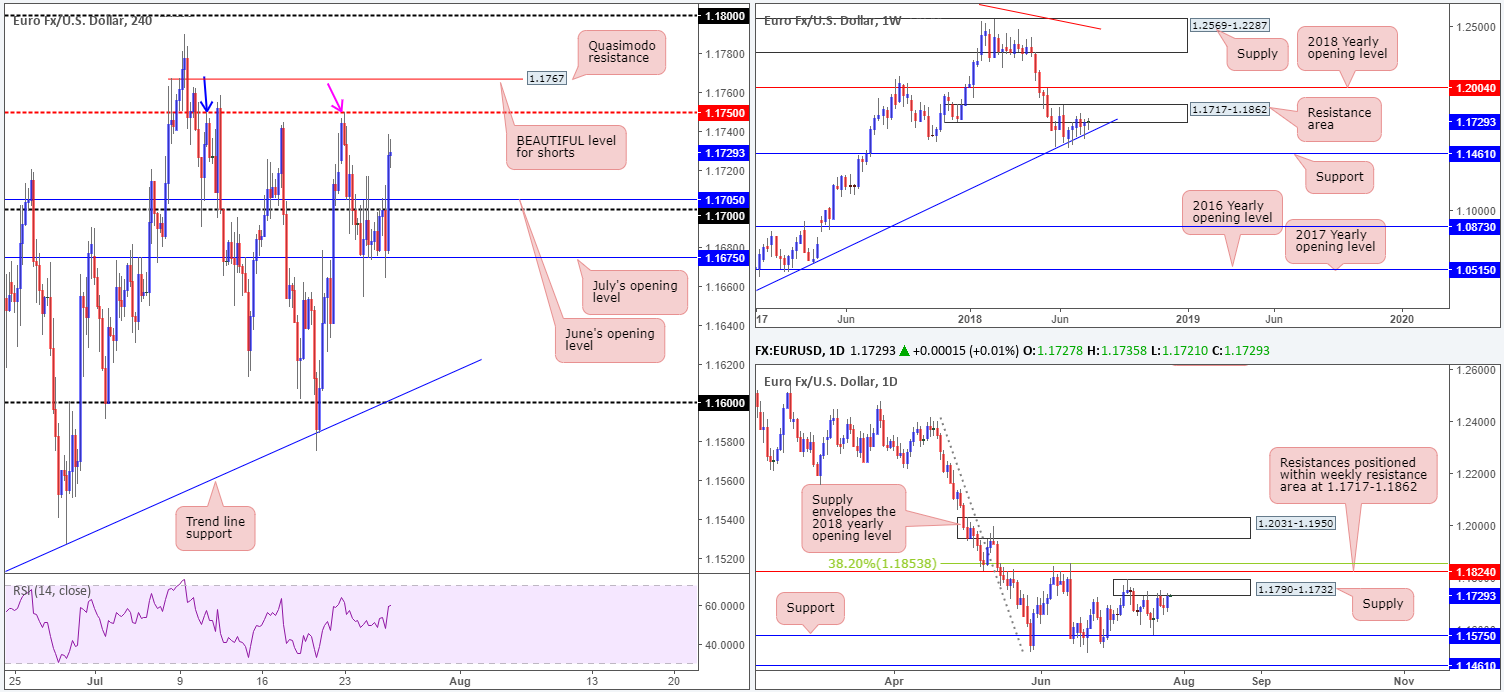
The positivity from the Trump/Juncker meet helped boost risk sentiment, dragging the single currency above the 1.17 handle on the H4 timeframe and June’s opening level at 1.1705. Near term, the H4 candles are now seen hovering just south of mid-level resistance plotted at 1.1750. Note this level also happens to represent a Quasimodo resistance (taken from the left shoulder marked with a blue arrow), and has already responded (to-the-pip) once already this week (pink arrow). Another level to keep eyes on is the H4 Quasimodo resistance seen at 1.1767.
Consequent to yesterday’s action, daily movement is kissing the underside of a supply zone at 1.1790-1.1732. As you can see from this timeframe, resistance is also penciled in above this zone at 1.1824, which happens to be positioned within an active weekly resistance area at 1.1717-1.1862.
Areas of consideration:
While we absolutely love the 1.1750 point on the H4 timeframe, attention is drawn to the H4 Quasimodo resistance marked above it at 1.1767. Stop-loss orders are likely tucked above 1.1750 as traders hope for a bounce lower to occur. Although this could happen, the higher-probability short is from 1.1767, in our humble view. The stops taken from 1.1750 will act as liquidity to those looking to short. This – coupled with where we’re trading from on the bigger picture right now – adds weight to shorts in this market.
For those interested in selling 1.1767, stop-loss orders can be comfortably positioned above the top edge of daily supply (1.1790).
Today’s data points: Spanish unemployment rate; EUR Main refinancing rate; ECB Press conference; US durable goods orders m/m; US unemployment claims.
GBP/USD:
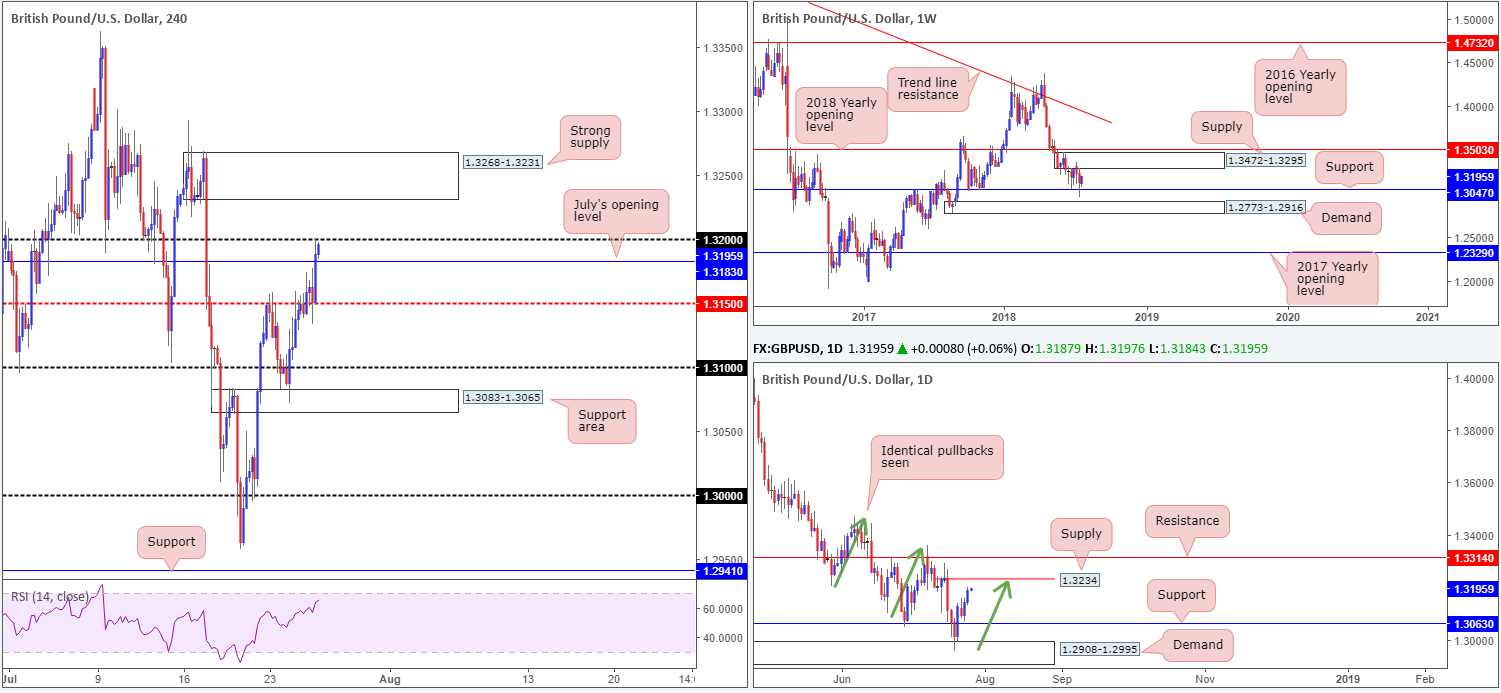
Following a phase of consolidation above the H4 mid-level number 1.3150, the British pound found active buyers on the back of a positive Trump/Juncker meet. Reaching a fresh weekly high of 1.3201, this brought the 1.32 handle into the fray. Though this number provided strong support in recent history, the level warrants caution as resistance.
Our rationale behind this approach comes from the fact that both weekly and daily price exhibit room to probe higher. Weekly movement has the lower edge of supply at 1.3295 to target, whereas daily activity is eyeing supply at 1.3234. Traders may have also noticed on the daily scale, the market is seen chalking up identical pullbacks (green arrows). Harmonically speaking, the current pullback is due to discover a ceiling at the aforementioned daily supply.
Areas of consideration:
The strong H4 supply area seen above 1.32 at 1.3268-1.3231 is a noted zone to watch for possible shorting opportunities today, due to converging with daily supply at 1.3234. First areas of trouble from this point has to be 1.32. In an ideal world, sellers will be looking for a break of this level and July’s opening level at 1.3183, before reducing risk to breakeven and taking partial profits off the table.
Today’s data points: US durable goods orders m/m; US unemployment claims.
AUD/USD:
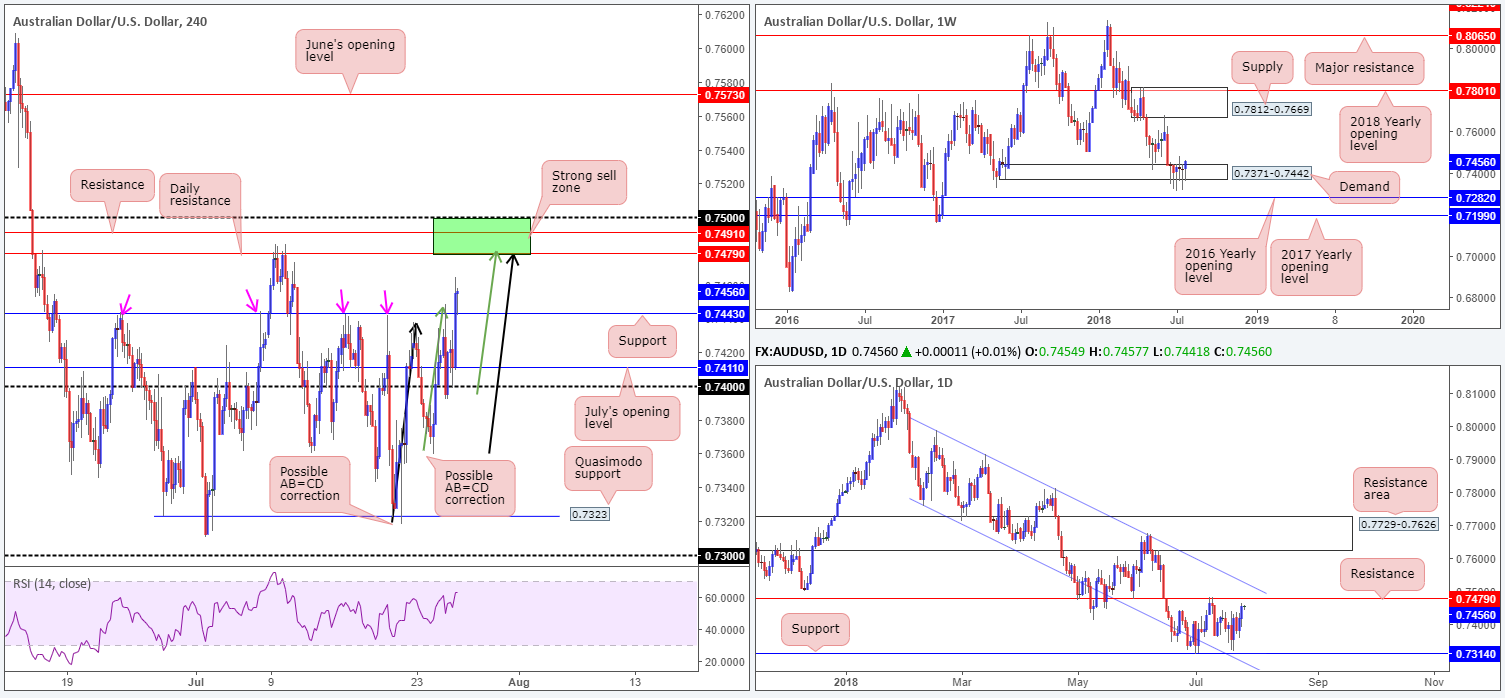
Early hours on Wednesday witnessed a sharp drop take shape in the Aussie market following a miss on Australian CPI figures, bringing the currency to lows of 0.7392. The market, however, made a swift U-turn here after H4 price failed to sustain losses sub 0.74. Shortly after, US President Trump and EU’s Juncker published a joint statement stating the two sides have agreed to work together to lower trade barriers and eliminate some tariffs, consequently strengthening risk appetite and sending the commodity currency northbound.
As of writing, the H4 candles are seen retesting support at 0.7443. The next upside target from this region falls in at 0.75/0.7479 (comprised of a round number at 0.75, a H4 resistance at 0.7491 and a daily resistance level coming in at 0.7479). Also of interest here is the approach. Note H4 price is in the process of printing two AB=CD formations (black and green arrows), both terminating at the underside of 0.75/0.7479.
In terms of weekly price, very little has changed over the last month. Demand at 0.7371-0.7442 remains in a fragile state. Continued indecisiveness here could open the window to a possible test of the 2016 yearly opening level at 0.7282 sometime down the road. In the event that the bulls regain consciousness, however, a retest of supply at 0.7812-0.7669 may be on the cards.
Areas of consideration:
0.75/0.7479 is a high-probability reversal zone, with the first downside target set at H4 support mentioned above at 0.7443. To avoid being whipsawed out of a trade from a (possible) fakeout above 0.75 (common viewing around psychological numbers), though, traders could consider waiting for H4 price to print a full or near-full-bodied bearish candle before pulling the trigger. Stop-loss orders can then be positioned above the candle’s rejection wick.
Today’s data points: US durable goods orders m/m; US unemployment claims.
USD/JPY:
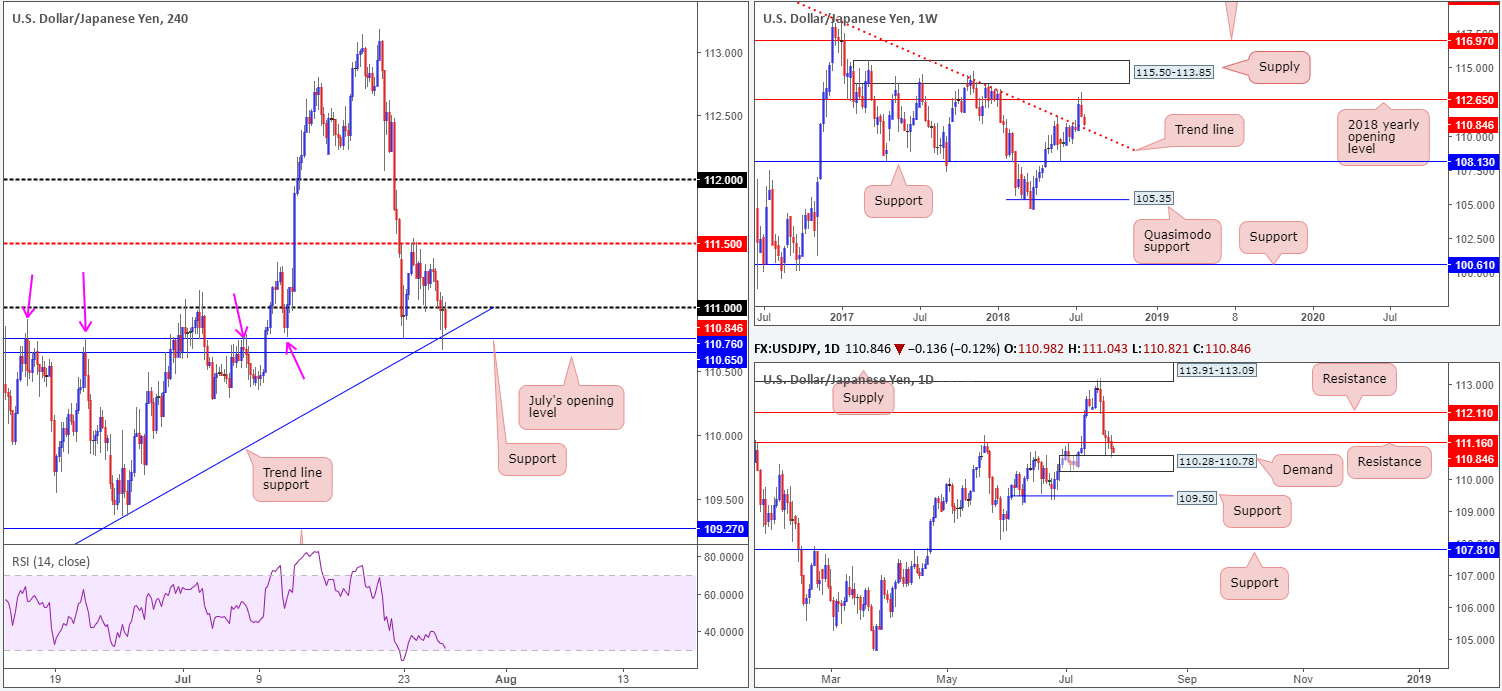
Following the break of the 111 handle on the H4 timeframe, strong support elbowed its way into the spotlight in recent hours. July’s opening level at 110.65, support at 110.76 and trend line support etched from the low 108.11 collectively shaped a tight base of support, which, as you can see, is holding ground at the moment. The only concern here is price has yet to print anything back above the 111 handle. In fact, the number is doing rather well as resistance!
Supporting the H4 supports, however, is the top edge of daily demand at 110.28-110.78. Like the H4 timeframe, though, immediate resistance is seen nearby at 111.16. Interestingly, the market’s landscape on the weekly timeframe shows potential to probe lower to trend line resistance-turned support (taken from the high 123.57).
Areas of consideration:
Though H4 support/daily demand is attractive, weakness seen around the 111 handle/daily resistance at 111.16 is discouraging.
On account of the above, and the fact that weekly price shows room to probe lower to trend line support (roughly around the 110.55ish point on the H4 timeframe), waiting for the weekly move to play out first may be the better path to take before contemplating long positions. It is always best to have all timeframes in unison!
Today’s data points: US durable goods orders m/m; US unemployment claims.
USD/CAD:
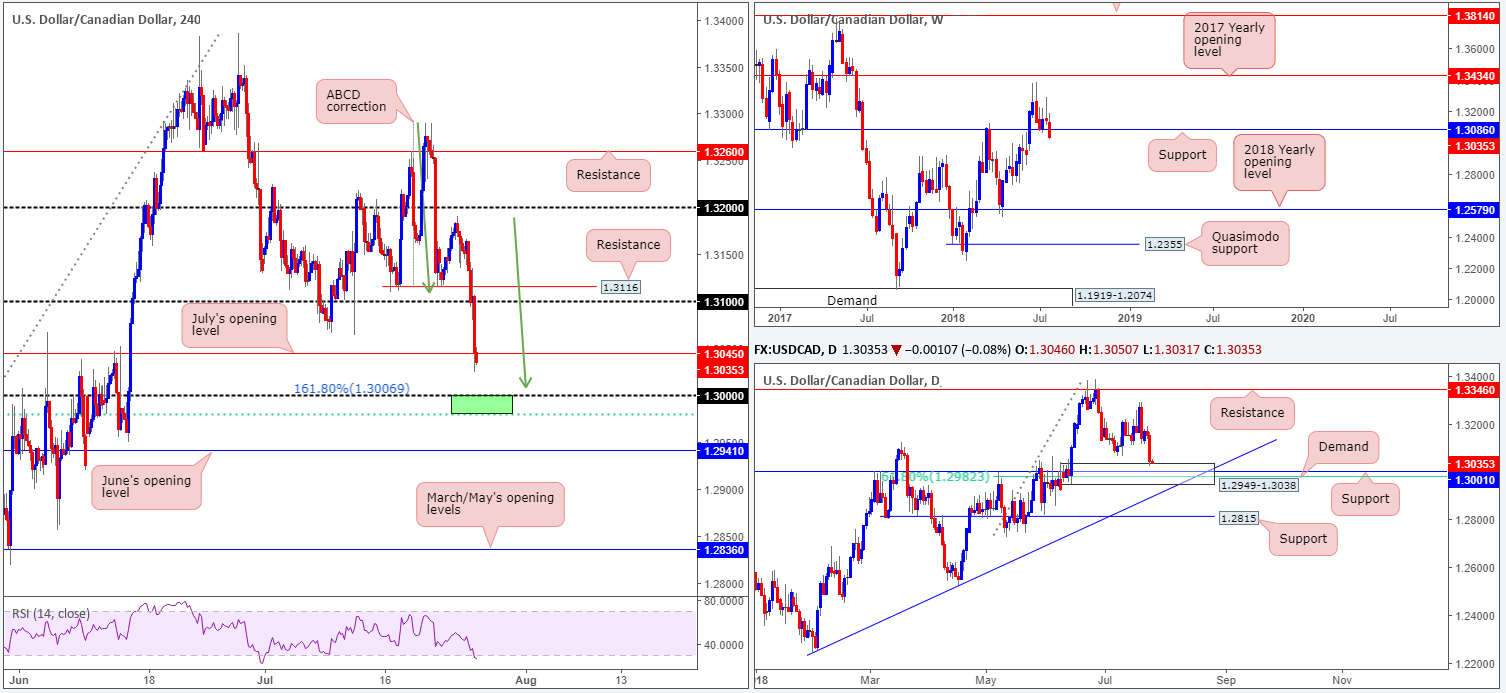
USD/CAD, as you can see, came under pressure on Wednesday, influenced by the recent Trump/Juncker meeting and robust oil prices. Following an extension off the previous day’s high 1.3191, H4 price destroyed support at 1.3116 as well as the 1.31 handle, and is now attempting a break of July’s opening level positioned at 1.3045. The other key thing to note on the H4 timeframe is the key figure 1.30. Not only is the number watched across the board, it also boasts an ABCD (green arrows) 161.8% Fib ext. point.
Supporting 1.30 is also a daily demand area at 1.2949-1.3038. Within this zone we see support standing at 1.3001 along with a 61.8% daily Fib support at 1.2982. The only concern right now is the fact that we have traded below weekly support at 1.3086.
Areas of consideration:
Given the confluence seen bolstering 1.30 on the H4 timeframe (H4 ABCD approach, daily support at 1.3001/61.8% daily Fib support at 1.2982), a bounce from here is a reasonable possibility, despite weekly price edging beneath support.
Conservative traders may opt to wait for H4 price to print candle confirmation (a full or near-full-bodied bull candle will suffice) prior to pressing the buy button. The reasoning behind this is due the chance of a fakeout through 1.30 to tag in buyers from the daily 61.8% Fib support mentioned above at 1.2982.
Today’s data points: US durable goods orders m/m; US unemployment claims.
USD/CHF:
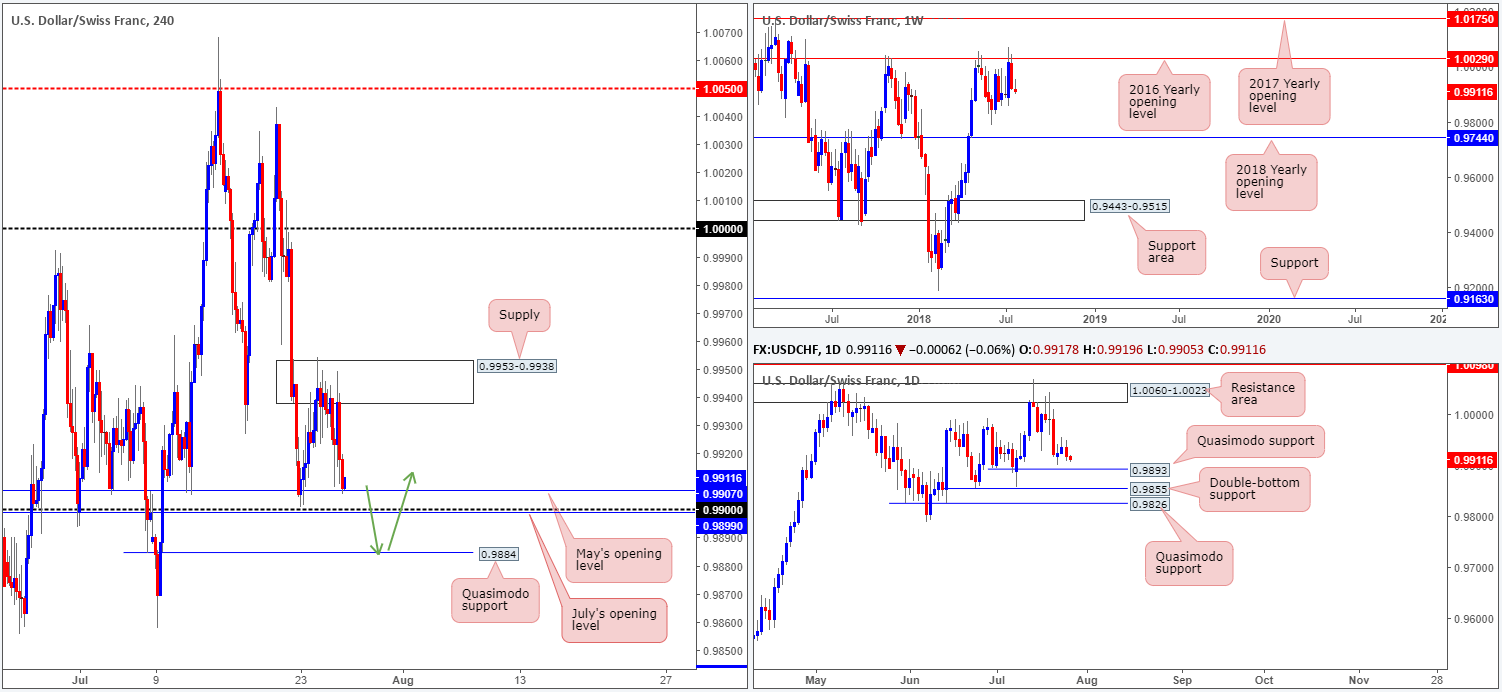
The technical picture on the USD/CHF displays an interesting scenery. Longer term, weekly price remains capped by the 2016 yearly opening level at 1.0029. Further selling from current price has the June lows at 0.9788 to target, as well as the 2018 yearly opening level at 0.9744. Turning the focus to the daily timeframe, we can see the unit hovering just north of Quasimodo support at 0.9893. Note the additional layer of supports seen directly below at 0.9855 (a double-bottom formation) and another Quasimodo support at 0.9826.
H4 supply at 0.9953-0.9938 continued to hold its ground on Wednesday despite Tuesday’s action piercing through the top edge of this zone and likely tripping stops. As we write, the H4 candles are seen touching gloves with May’s opening level at 0.9907, positioned just north of the 0.99 handle and July’s opening level at 0.9899. Also worthy of attention on the H4 scale is the Quasimodo support seen at 0.9884.
Areas of consideration:
In light of daily price eyeing Quasimodo support mentioned above at 0.9893, a fakeout below the current H4 supports down to the H4 Quasimodo support noted above at 0.9884 is likely to take shape. Stops taken from below the current H4 support levels should provide institutional traders liquidity to buy.
Remember, entering long from 0.9884 has daily Quasimodo support backing the move, so a break back above 0.99 could be on the cards (a good time to be thinking of reducing risk to breakeven). Aggressive stop placement can be positioned at 0.9877, while conservative traders may opt for the apex of the H4 Quasimodo formation at 0.9857.
Today’s data points: US durable goods orders m/m; US unemployment claims.
Dow Jones Industrial Average:
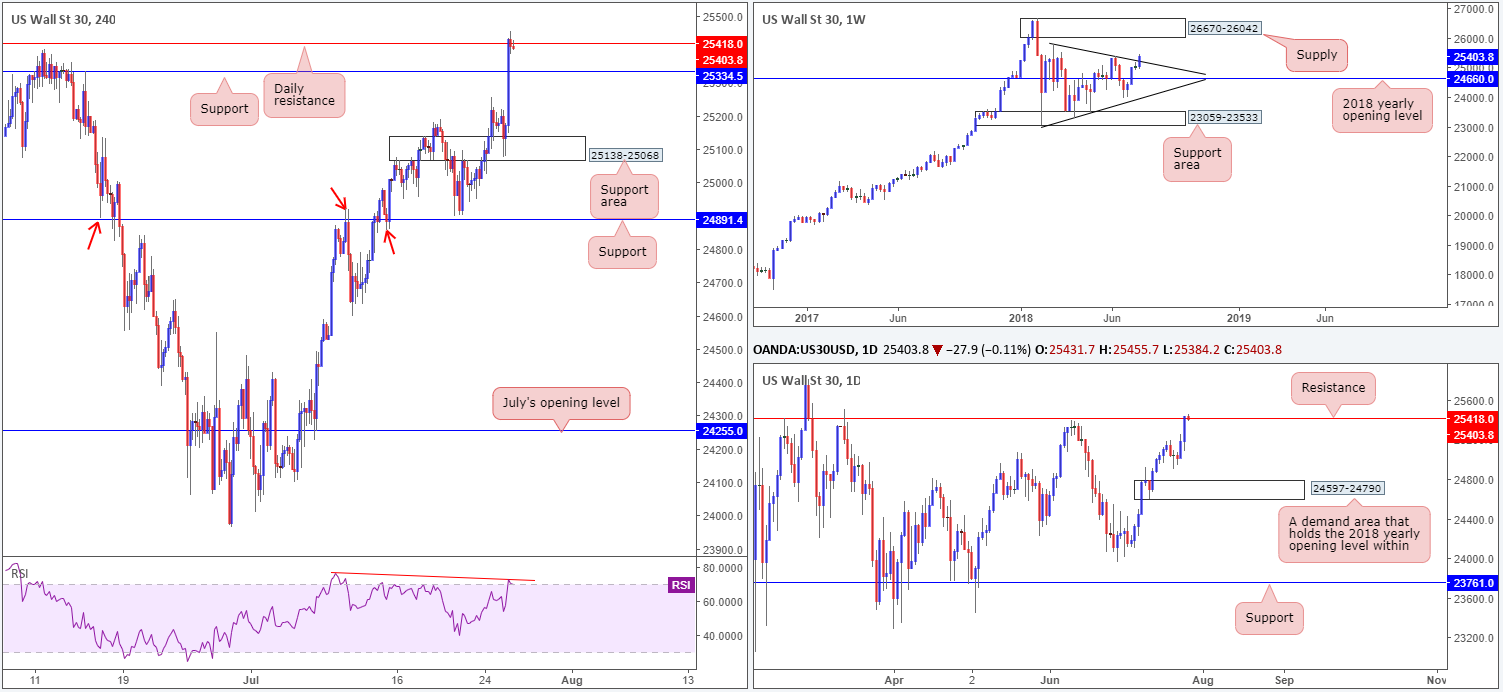
US equities recorded substantial gains on the back of a positive Trump/Juncker meeting in regard to trade. The H4 support area at 25138-25068 held firm, consequently forcing H4 price action beyond resistance at 25334 into daily resistance plotted at 25418. It might also be worth noting the H4 RSI indicator is displaying an overbought reading along with divergence.
On the other side of the spectrum, though, weekly movement elbowed its way through trend line resistance (etched from the high 25807) in recent trade, potentially setting the stage for further upside to supply positioned at 26670-26042.
Areas of consideration:
Although weekly price is sitting in a strong position at the moment, buying this market at current price is difficult as you’d effectively be entering long into daily resistance!
Irrespective of the direction one selects, opposing structure is clearly evident. With that being the case, opting to remain on the sidelines may be the better path to take today. Hopefully today’s movement will help clear a pathway whereby both weekly and daily action are trading in unison.
Today’s data points: US durable goods orders m/m; US unemployment claims.
XAU/USD (Gold)
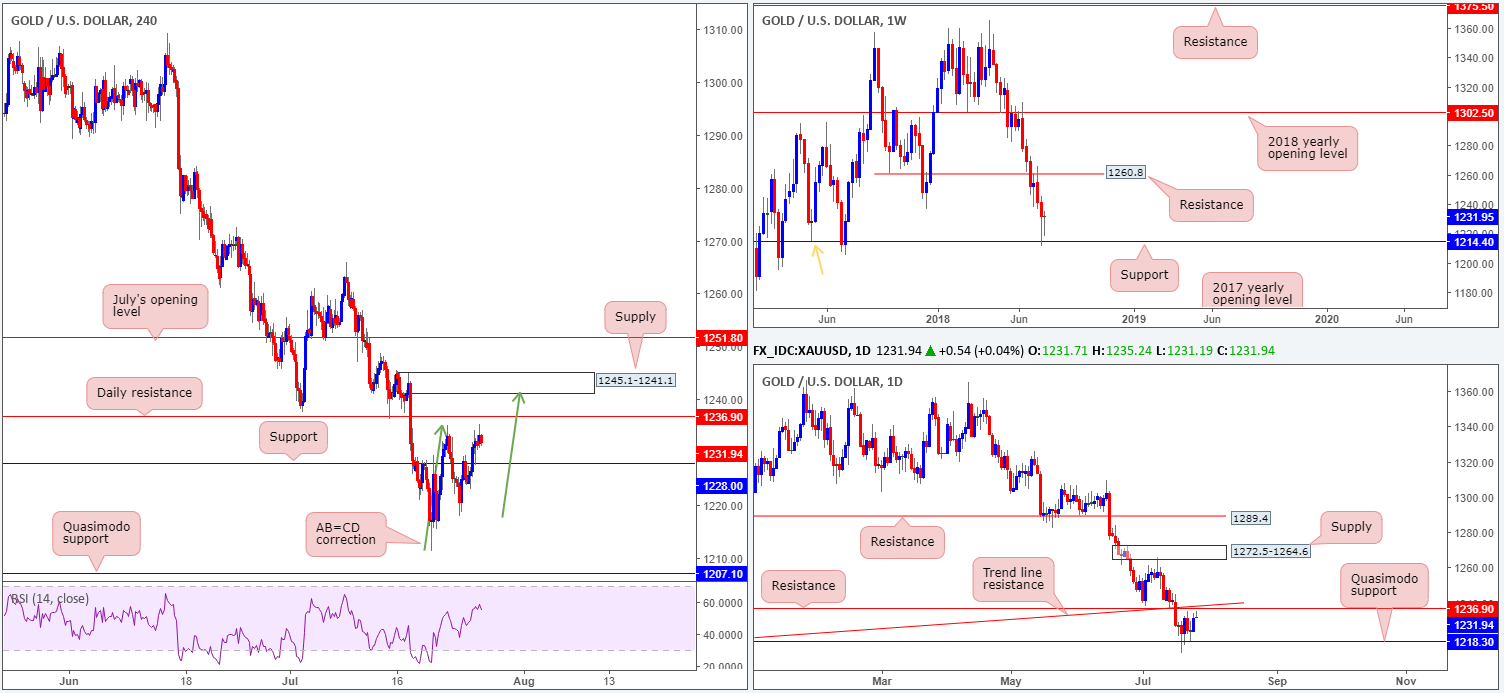
Across the board the USD edged lower on Wednesday, consequently lifting the yellow metal higher. As anticipated, H4 price broke through resistance at 1228.0 and later in the session retested the level as support. For those long from this barrier, the next upside target is seen nearby at 1236.9: a daily resistance that’s positioned just south of a H4 supply zone at 1245.1-1241.1 (note the current daily resistance level also converges with daily trend line support-turned resistance taken from the low 1195.1). What’s also notable from a technical perspective is the AB=CD (green arrows) approach that terminates around the lower edge of the aforementioned H4 supply!
Bullion’s longer-term structure, however, conveys a bullish message at the moment. Weekly support drawn from 1214.4 remains in play. The level also represents a weekly Quasimodo support taken from the left shoulder marked with an orange arrow.
Areas of consideration:
The H4 supply area at 1245.1-1241.1 is an immediate area of interest this morning, due to its connection with a possible H4 AB=CD approach. Although the supply is located close by daily resistances, however, one has to remain cognizant of where we are coming from on the bigger picture: weekly support!
An ideal sell scenario, in our humble view, would be for H4 price to print a bearish pin-bar candle formation that pierces through daily resistance and brings in the noted H4 supply. A sell on the close of this candle is considered a high-probability setup, targeting support at 1228.0 as the initial port of call (stops behind the pin-bar’s wick).
The use of the site is agreement that the site is for informational and educational purposes only and does not constitute advice in any form in the furtherance of any trade or trading decisions.
The accuracy, completeness and timeliness of the information contained on this site cannot be guaranteed. IC Markets does not warranty, guarantee or make any representations, or assume any liability with regard to financial results based on the use of the information in the site.
News, views, opinions, recommendations and other information obtained from sources outside of www.icmarkets.com.au, used in this site are believed to be reliable, but we cannot guarantee their accuracy or completeness. All such information is subject to change at any time without notice. IC Markets assumes no responsibility for the content of any linked site. The fact that such links may exist does not indicate approval or endorsement of any material contained on any linked site.
IC Markets is not liable for any harm caused by the transmission, through accessing the services or information on this site, of a computer virus, or other computer code or programming device that might be used to access, delete, damage, disable, disrupt or otherwise impede in any manner, the operation of the site or of any user’s software, hardware, data or property.


