
Waiting for lower timeframe confirmation is our main tool to confirm strength within higher timeframe zones, and has really been the key to our trading success. It takes a little time to understand the subtle nuances, however, as each trade is never the same, but once you master the rhythm so to speak, you will be saved from countless unnecessary losing trades. The following is a list of what we look for:
- A break/retest of supply or demand dependent on which way you’re trading.
- A trendline break/retest.
- Buying/selling tails/wicks – essentially we look for a cluster of very obvious spikes off of lower timeframe support and resistance levels within the higher timeframe zone.
- Candlestick patterns. We tend to stick with pin bars and engulfing bars as these have proven to be the most effective.
We typically search for lower-timeframe confirmation between the M15 and H1 timeframes, since most of our higher-timeframe areas begin with the H4. Stops are usually placed 1-3 pips beyond confirming structures.
EUR/USD:
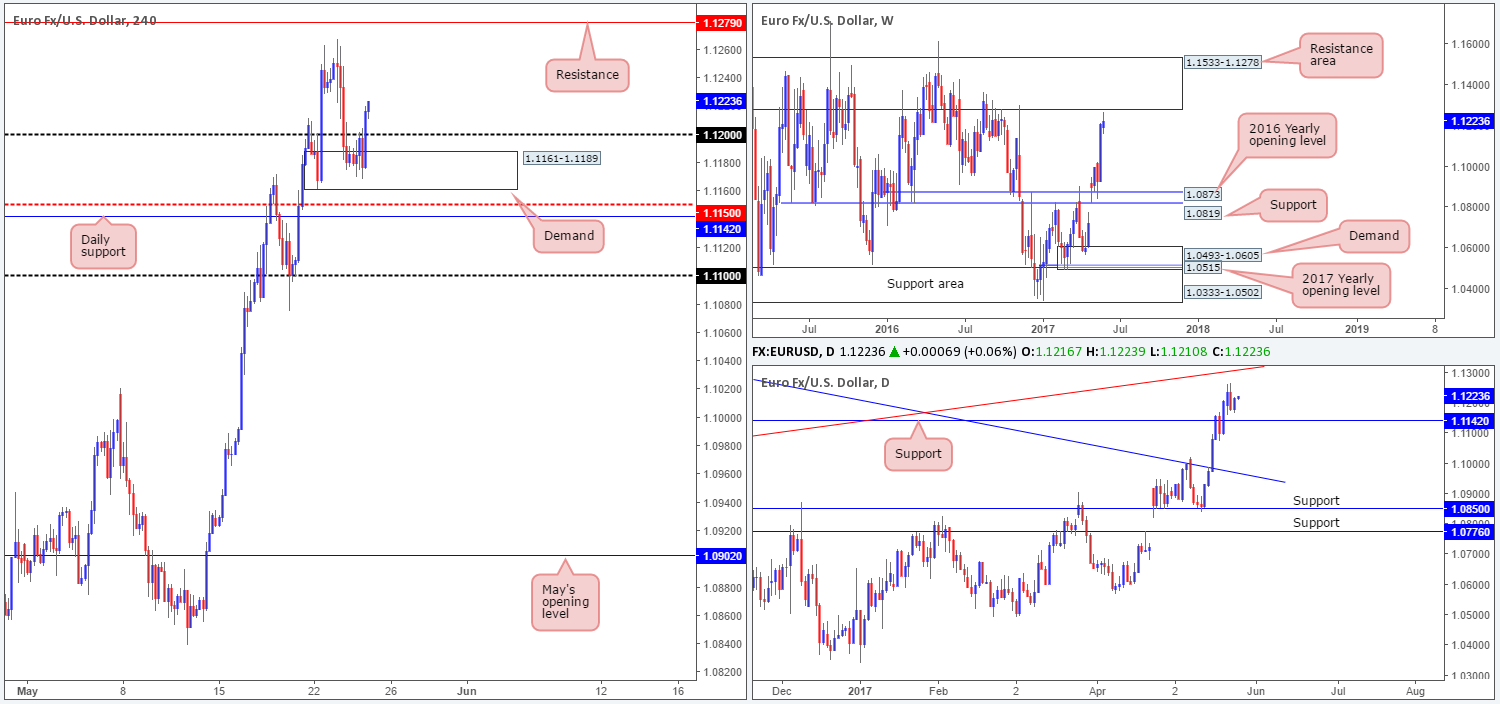
Following an unsuccessful attempt to breach the 1.12 handle going into the early hours of yesterday’s US segment, the pair eventually managed to gather enough momentum to conquer this barrier after the release of the FOMC meeting minutes. As of writing, pricing for a June rate hike is now pegged just below 80%.
With the 1.12 resistance now out of the picture, we’re left with Tuesday’s high at 1.1267, followed closely by H4 resistance at 1.1279, and then the 1.13 handle. Over on the higher timeframes, weekly price is seen trading within striking distance of a formidable resistance area coming in at 1.1533-1.1278. Down on the daily timeframe, price is currently loitering between a support level drawn from 1.1142 and a trendline resistance etched from the low 1.0711.
Our suggestions: Assuming that the bulls continue to punch higher today, we’ll be watching the 1.13/1.1279 neighborhood for potential shorting opportunities. Why this area? Well, apart from the fact that this zone is made up of a H4 resistance and a round number, it’s also bolstered by the underside of the said weekly resistance area at 1.1278, and the daily trendline resistance is currently seen intersecting with the 1.13 number.
Ultimately, we’re going to be waiting for a reasonably sized H4 bearish candle to form around 1.13/1.1279, preferably a full-bodied candle, before pulling the trigger. This will help avoid getting stopped on a fakeout and inform us that seller interest exists here.
Data points to consider: US unemployment claims at 1.30pm, FOMC member Brainard speaks at 3pm GMT+1.
Levels to watch/live orders:
- Buys: Flat (stop loss: N/A).
- Sells: 1.13/1.1279 ([waiting for a reasonably sized H4 bear candle – preferably a full-bodied candle – to form before pulling the trigger is advised] stop loss: ideally beyond the candle’s wick).
GBP/USD:
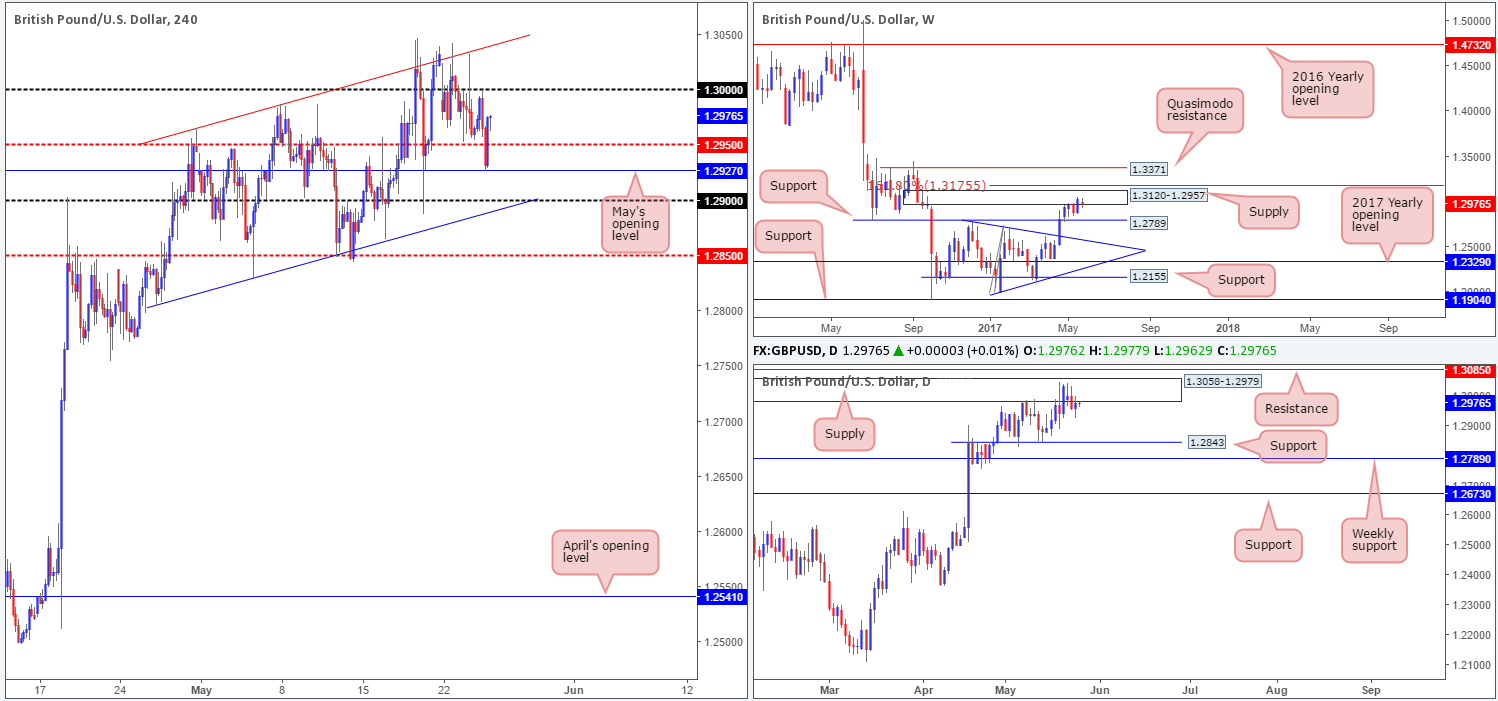
In recent trading, H4 price clipped the underside of the large psychological number 1.30, consequently forcing the pair to surpass the H4 mid-level barrier at 1.2950 and cross swords with May’s opening level at 1.2927. As we write, price is trading back around the 1.2976 mark, looking poised to attack 1.30 once again. Also noteworthy is the overall H4 picture still remains trading within an ascending H4 channel (1.2804/1.2965) that’s been in motion since early May.
Bouncing over to the bigger picture, however, we can see that weekly price remains trading within the walls of a supply base drawn from 1.3120-1.2957, and daily action continues to trade around supply seen within the said weekly supply at 1.3058-1.2979.
Our suggestions: While we still believe that the bears will eventually push the market lower, it’s very difficult to get excited about this knowing that we have multiple H4 supports lurking just below: the H4 mid-level number 1.2950, May’s opening level at 1.2927 and then the 1.29 handle that fuses with the channel support line etched from the low 1.2804.
Given the strong response seen from May’s opening level a few hours ago, we do not see anything immediate to trade. With that, our team’s position will remain flat going into today’s sessions.
Data points to consider: UK Second estimate GDP at 9.30am. US unemployment claims at 1.30pm, FOMC member Brainard speaks at 3pm GMT+1.
Levels to watch/live orders:
- Buys: Flat (stop loss: N/A).
- Sells: Flat (stop loss: N/A).
AUD/USD:
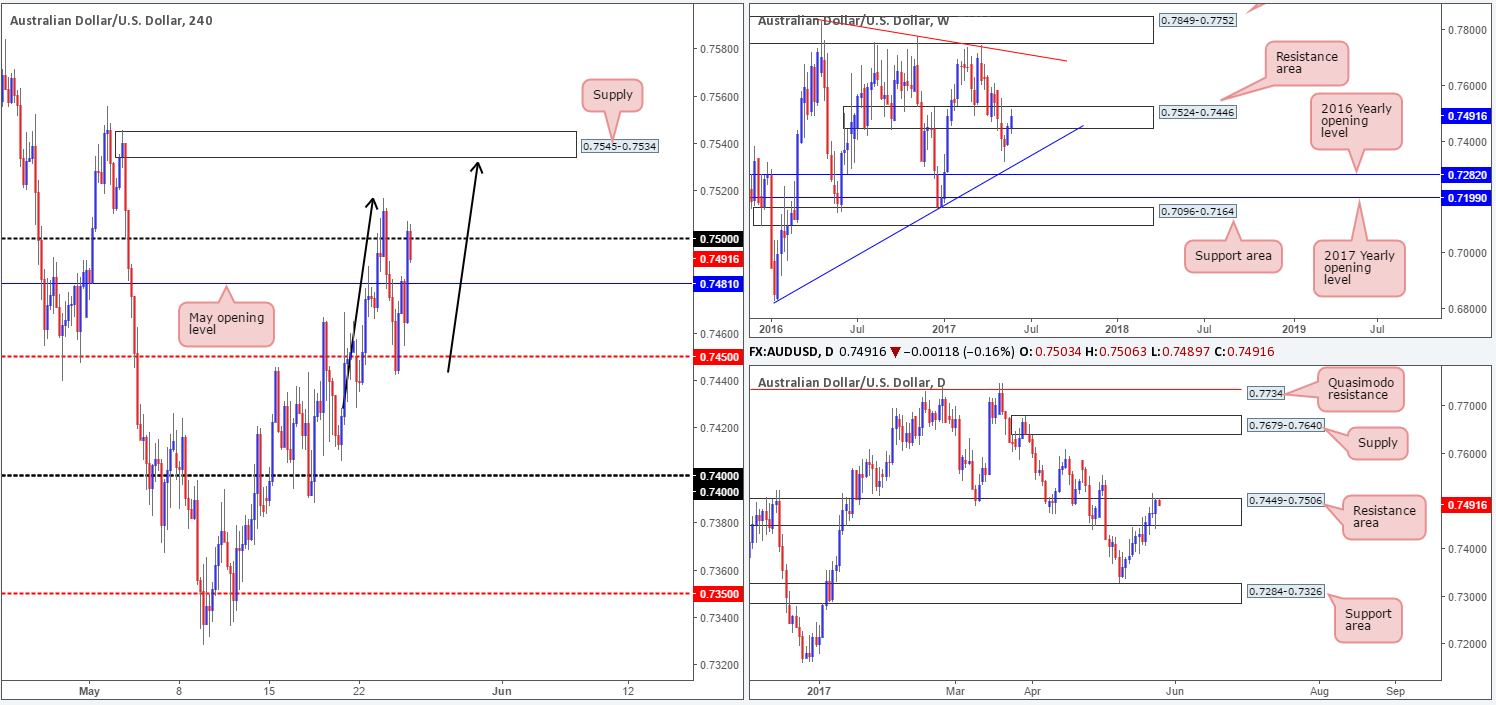
Looking at this market from the top this morning, we can see that the buyers and sellers remain battling for position within the weekly resistance area seen at 0.7524-0.7446. At the moment, the bulls appear to have the upper hand and could end with price closing above this area by the week’s end. Down on the daily timeframe, nonetheless, price is seen trading around the upper edge of a resistance zone seen housed within the said weekly area at 0.7449-0.7506.
Influenced by yesterday’s FOMC meeting, H4 price closed above both May’s opening level at 0.7481 and the 0.75 handle. As you can see though, the bulls have struggled to maintain this bullish tone above 0.75 and price looks as though it will reconnect with May’s opening level once again.
Our suggestions: The only interesting thing to jump out at us this morning is the potential H4 AB=CD bearish pattern (see black arrows) taken from the low 0.7428 that terminates just ahead of a H4 supply base 0.7545-0.7534. The only downside to this of course is the fact that the H4 supply is located above the two aforementioned higher-timeframe resistance areas! Therefore, shorting from here could end in tears given that higher-timeframe breakout buyers may very well be in play then.
Data points to consider: RBA Assist Gov. Debelle speaks at 9am. US unemployment claims at 1.30pm, FOMC member Brainard speaks at 3pm GMT+1.
Levels to watch/live orders:
- Buys: Flat (stop loss: N/A).
- Sells: Flat (stop loss: N/A).
USD/JPY:
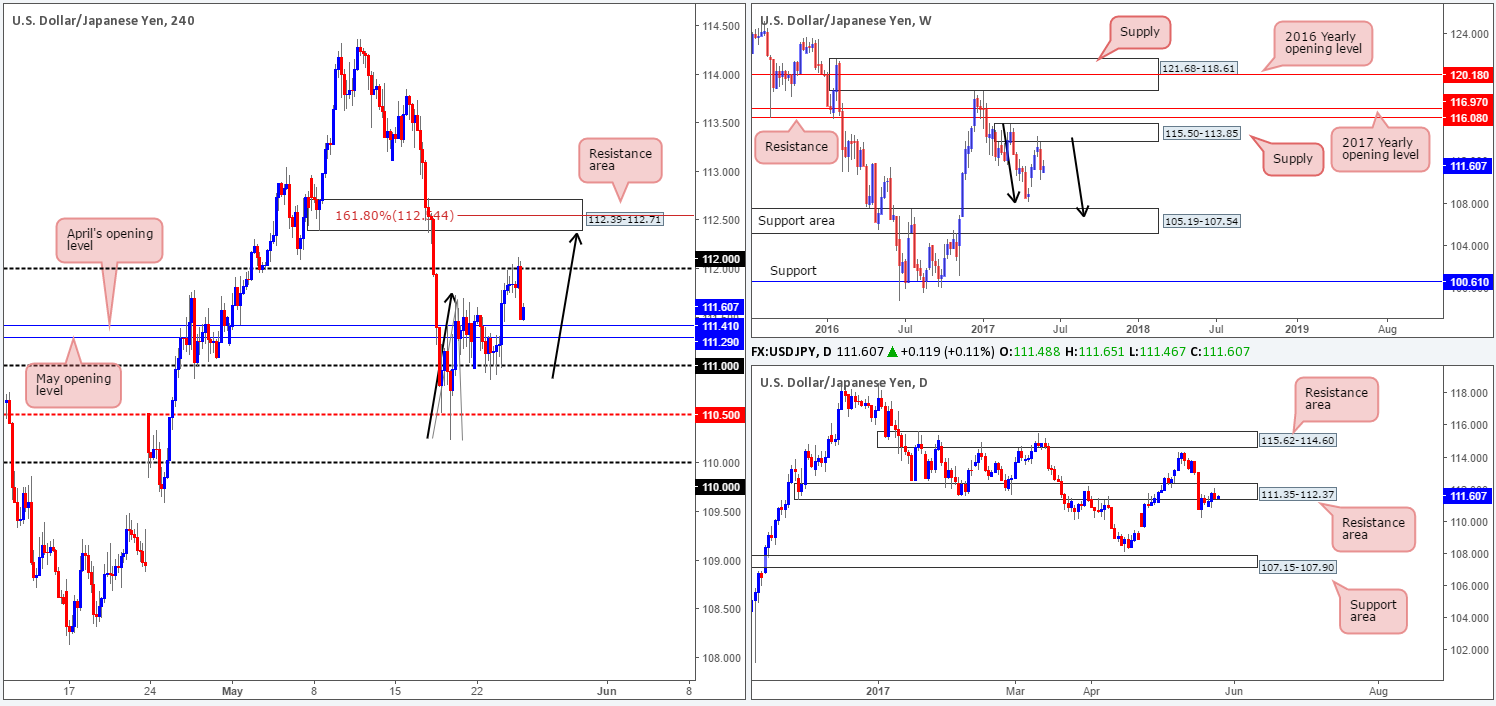
After spending the best part of a day clinging to the underside of the 112 handle, the bears finally stepped in and drove the unit lower. The move was seen following the release of the FOMC meeting minutes, and has, as you can see, placed the H4 candles within touching distance of May/April’s opening levels at 111.29/111.41. For those who follow us on a regular basis you’ll already know that we absolutely love monthly opening levels. In this case, however, it’s a little bit tricky. Over on the daily timeframe, the pair is seen trading within the confines of a resistance area penciled in at 111.35-112.37. What’s more, we also see weekly action showing room for the unit to trade as low as 105.19-107.54: a support area stretched all the way back to early 2014!
Our suggestions: As much as we’d like to buy from 111.29/111.41, it would just be too chancy in light of the higher-timeframe structure. There is, however, a chance that H4 price could still complete a H4 AB=CD pattern (black arrows) that terminates just ahead of a H4 resistance area coming in at 112.39-112.71.While this is worthy of attention, it might be worth noting that this H4 area sits a few pips above the current daily resistance area! So, breakout buyers could potentially make a short from the H4 supply zone rather messy. So, trade carefully here guys!
We have removed our pending sell order from 112.63, as we’ve now decided to watch how H4 price action behaves around the said supply before committing to a position.
Data points to consider: US unemployment claims at 1.30pm, FOMC member Brainard speaks at 3pm GMT+1.
Levels to watch/live orders:
- Buys: Flat (stop loss: N/A).
- Sells: 112.39-112.71 ([waiting for a reasonably sized H4 bear candle – preferably a full-bodied candle – to form before pulling the trigger is advised] stop loss: ideally beyond the candle’s wick).
USD/CAD:
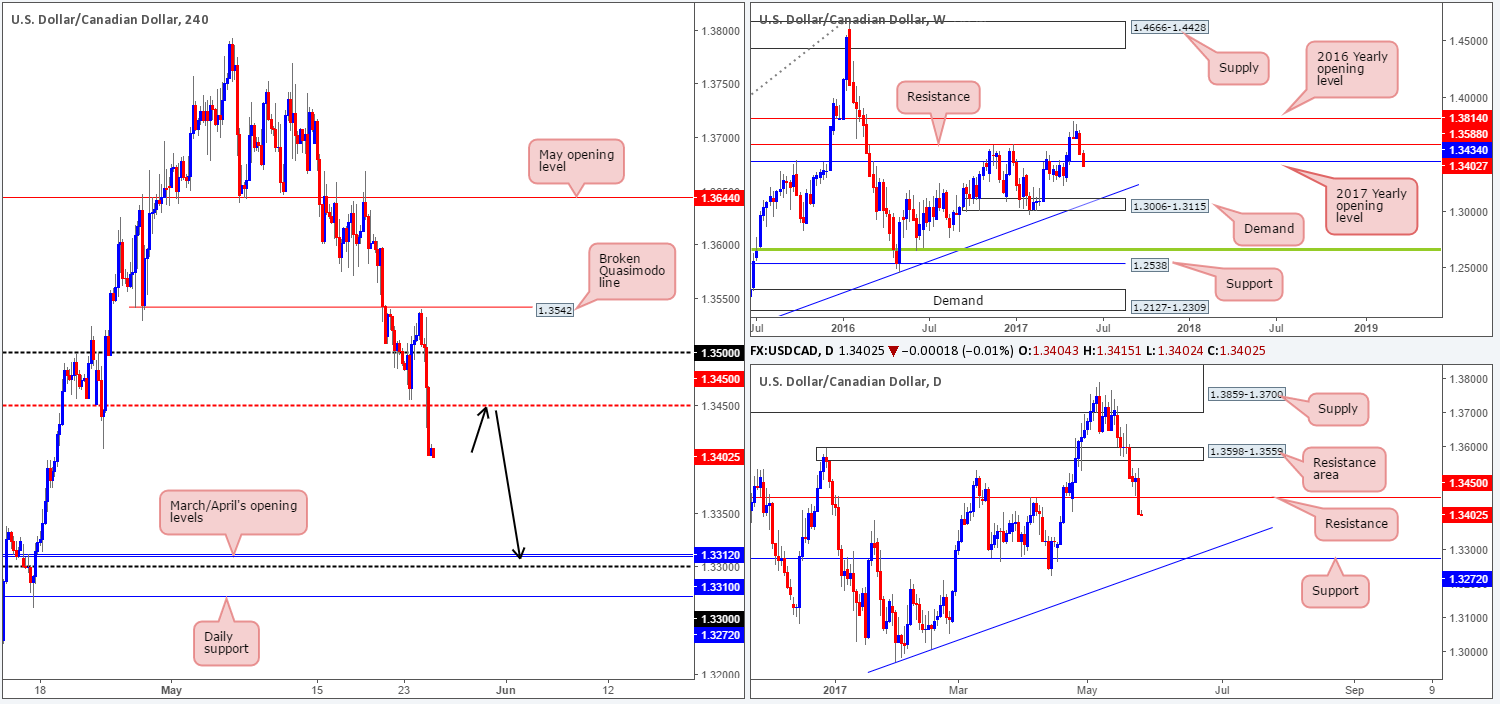
(Trade update: closed the remainder of our long position from 1.3458 at 1.3494).
The USD/CAD weakened following the BoC meeting as policy makers were less cautious than expected. The move saw the 1.35 handle and eventually the H4 mid-level support at 1.3450 wiped out. Selling was fueled further after the release of the FOMC meeting minutes, potentially opening up the path south down to 1.3310/1.3312: March/April’s opening levels which sits nearby the 1.33 handle.
What’s also notable from a technical perspective is the 2017 yearly opening level seen plotted on the weekly chart at 1.3434 was recently breached. Alongside this, daily support at 1.3450 was also taken out with the market now looking poised to challenge support drawn from 1.3272, which happens to converge nicely with a trendline support taken from the low 1.2968.
Our suggestions: With the above notes suggesting that further downside could be on the cards, our team has their eye on 1.3450. A retest of this number followed by a H4 bearish candle (preferably a full-bodied candle) would, in our humble opinion, be enough to sell, targeting the 1.33 region.
It may also be worth noting that 1.33 is not only a nice take-profit zone; it’s also an area we would also consider buying from. Not only are the monthly levels bolstered by the 1.33 handle, there’s also the daily support mentioned above lurking just a few pips below it!
Data points to consider: US unemployment claims at 1.30pm, FOMC member Brainard speaks at 3pm GMT+1.
Levels to watch/live orders:
- Buys: Flat (stop loss: N/A).
- Sells: 1.3450 region ([waiting for a reasonably sized H4 bear candle – preferably a full-bodied candle – to form before pulling the trigger is advised] stop loss: ideally beyond the candle’s wick).
USD/CHF:
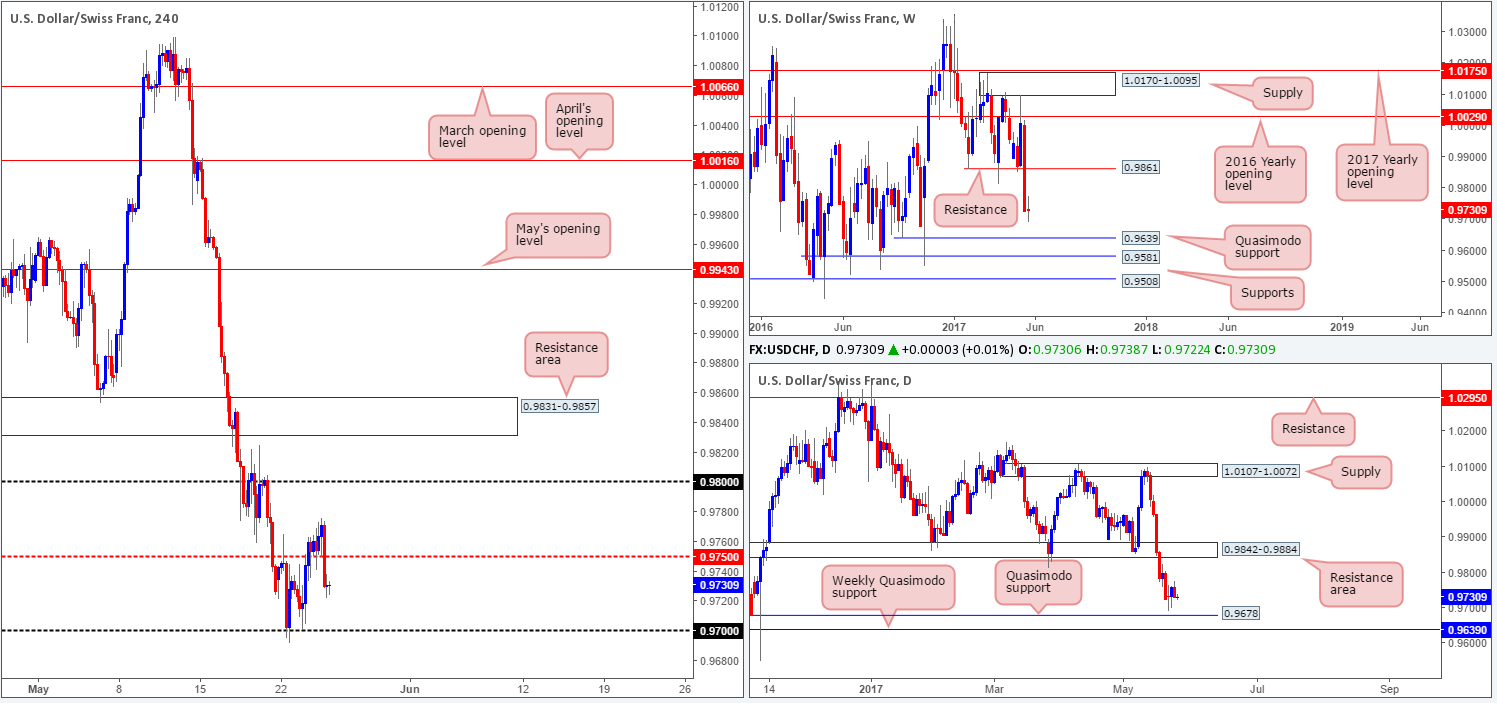
During the course of yesterday’s sessions, we saw the USD/CHF find a footing on the retest of a H4 mid-level support at 0.9750. Price, as you can see, managed to reach a high of 0.9776 before crashing lower following the release of the FOMC meeting minutes. This has positioned the H4 candles between 0.9750 and the 0.97 handle. Sitting directly below the 0.97 handle is a daily Quasimodo support at 0.9678. And a few pips below this level sits a weekly Quasimodo support barrier coming in at 0.9639.
As of current price, we believe 0.97 will be tested again in the near future. Only this time we expect to see more of an aggressive test: a fakeout through this number down to the daily Quasimodo support.
Our suggestions: Should price whipsaw through 0.97, test 0.9678, and close back above 0.97, we will look to enter long, targeting the 0.9750 region as an initial take-profit target.
Data points to consider: US unemployment claims at 1.30pm, FOMC member Brainard speaks at 3pm GMT+1.
Levels to watch/live orders:
- Buys: 0.97 region ([wait for price to fakeout beyond the 0.97 handle and touch 0.9678 and then close back above 0.97, before looking to commit to a position] stop loss: ideally beyond the candle’s tail).
- Sells: Flat (stop loss: N/A).
DOW 30:
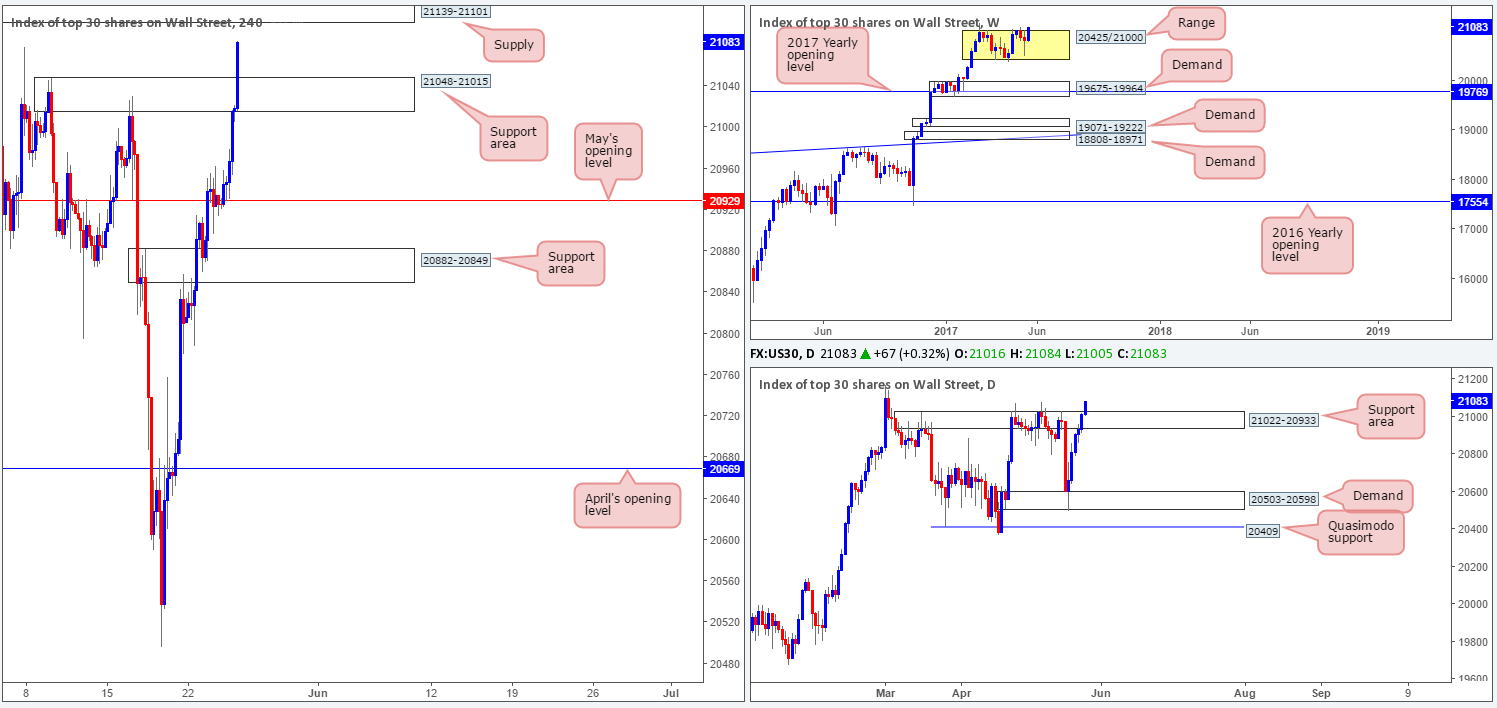
As can be seen from the weekly chart this morning, price is marginally trading above the range fixed between 20425/21000. In the event that this bullish momentum continues to be seen, it’s highly likely that fresh record highs will be achieved before the week’s end. Climbing down to the daily candles, however, the resistance area at 21022-20933 was also recently taken out. Assuming that the bulls remain above this zone today, we would expect this base to offer support to the market.
Looking over to the H4 action, the supply zone at 21048-21015 was recently breached, which has opened up the runway north for price to challenge the last remaining H4 supply at 21139-21101. Should this zone be consumed then, technically speaking, there’s very little standing in the way of this index achieving fresh record highs.
Our suggestions: Although the bulls look incredibly determined at this time, entering long expecting price to reach new highs would still be a risk, in our opinion. Waiting for the H4 supply mentioned above at 21139-21101 to be taken out would be the safer route, before hunting for longs. Therefore, until we see a decisive close above this area, our desk will be patiently waiting on the sidelines.
Data points to consider: US unemployment claims at 1.30pm, FOMC member Brainard speaks at 3pm GMT+1.
Levels to watch/live orders:
- Buys: Watching for H4 price to close above H4 supply at 21139-21101 before looking to enter long this market.
- Sells: Flat (stop loss: N/A).
GOLD:
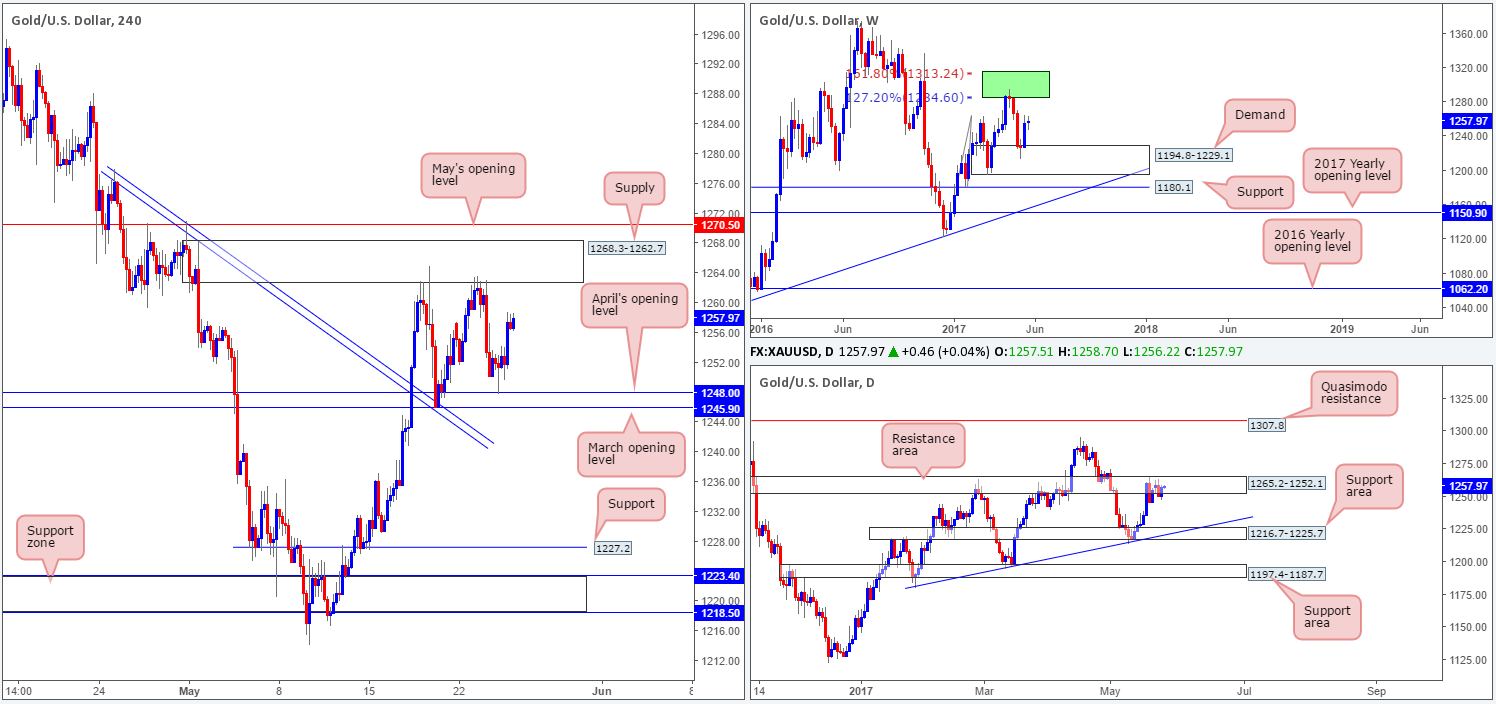
The price of gold was once again bid from 1245.9/1248.0 (March/April’s opening levels) and managed to reach a high of 1258.8 going into the closing bell. Yesterday’s recovery has, in our opinion, seen the H4 candles enter into a phase of consolidation between the said monthly levels and a H4 supply zone coming in at 1268.3-1262.7. Positioned just below May’s opening level at 1270.5 and also located around the top edge of a daily resistance area currently in play at 1265.2-1252.1, the bulls will likely struggle to get beyond this wall. With that being said, we feel that price will eventually break to the downside and look to target the daily support area drawn from 1216.7-1225.7, which happens to converge with a trendline support taken from the low 1180.4. Also notice here that the H4 support level marked at 1227.2 is positioned directly above this daily zone.
Our suggestions: For the time being, our desk has agreed that remaining on the sidelines until we see a decisive H4 close form beyond the current H4 range is the better/safer route to take. A decisive H4 close lower coupled with a retest to the underside of the range, and a reasonably sized H4 bearish candle (full-bodied if possible) would be enough evidence to suggest a short is valid down to 1227.2.
Levels to watch/live orders:
- Buys: Flat (stop loss: N/A).
- Sells: Watching for a H4 close to form below 1245.9/1248.0 before we consider shorts in this market.


