
A note on lower timeframe confirming price action…
Waiting for lower timeframe confirmation is our main tool to confirm strength within higher timeframe zones, and has really been the key to our trading success. It takes a little time to understand the subtle nuances, however, as each trade is never the same, but once you master the rhythm so to speak, you will be saved from countless unnecessary losing trades. The following is a list of what we look for:
- A break/retest of supply or demand dependent on which way you’re trading.
- A trendline break/retest. Buying/selling tails – essentially we look for a cluster of very obvious spikes off of lower timeframe support and resistance levels within the higher timeframe zone.
- Candlestick patterns. We tend to only stick with pin bars and engulfing bars as these have proven to be the most effective.
For us, lower timeframe confirmation starts on the M15 and finishes up on the H1, since most of our higher timeframe areas begin with the H4. Stops usually placed 5-10 pips beyond your confirming structures.
EUR/USD:
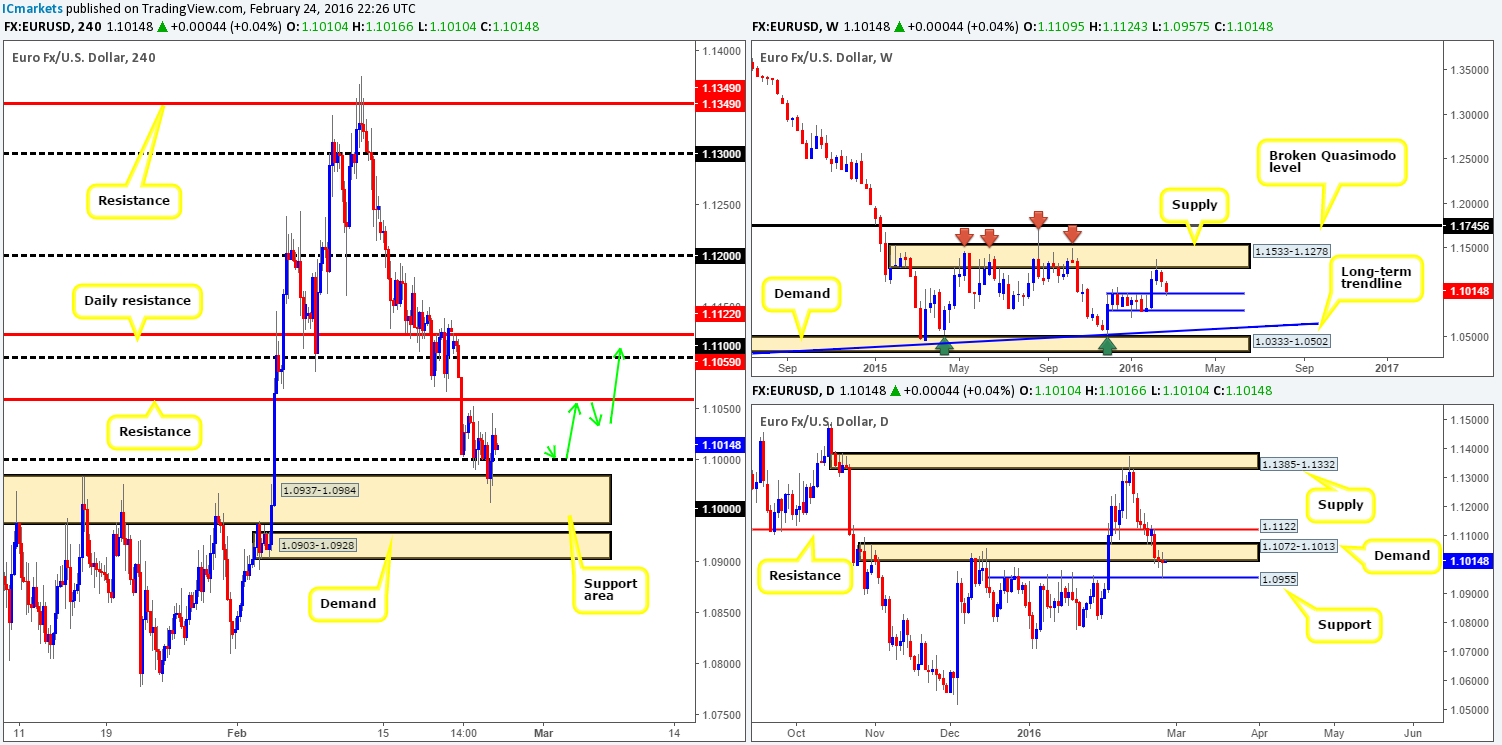
Coming directly from the weekly timeframe this morning, one can see that support at 1.0983 was recently brought into play, and is, at least for now, holding ground. Climbing down into the pits of the daily timeframe, stop losses below demand at 1.1072-1.1013 appear to have been well and truly demolished, as price plugged itself into support coming in at 1.0955. Consequent to this, two back-to-back indecision candles formed.
For those who read our previous report on the EUR (http://www.icmarkets.com/blog/wednesday-24th-february-daily-technical-outlook-and-review/) you may recall us speaking about looking for price to dive below the large psychological support 1.1000 to connect with the H4 support area at 1.0937-1.0984 for a confirmed entry long. Unfortunately, we just could not pin down an entry from within this base yesterday; it was very frustrating as we were confident a bounce was on the horizon! Well done to any of our readers who did though!
Pushing forward, given where price is positioned on the higher-timeframe picture (see above), we feel this pair is heading higher today. Ultimately, we’d love to see price retest the 1.1000 figure and hold. This would provide a nice platform in which to begin looking for a lower timeframe entry, targeting H4 resistance at 1.1059, followed closely by the 1.1100 figure, and then daily resistance just above it drawn from 1.1122 (as per the green arrows).
Levels to watch/live orders:
- Buys: 1.1000 [Tentative – confirmation required] (Stop loss: dependent on where one confirms this level).
- Sells: Flat (Stop loss: N/A).
GBP/USD:
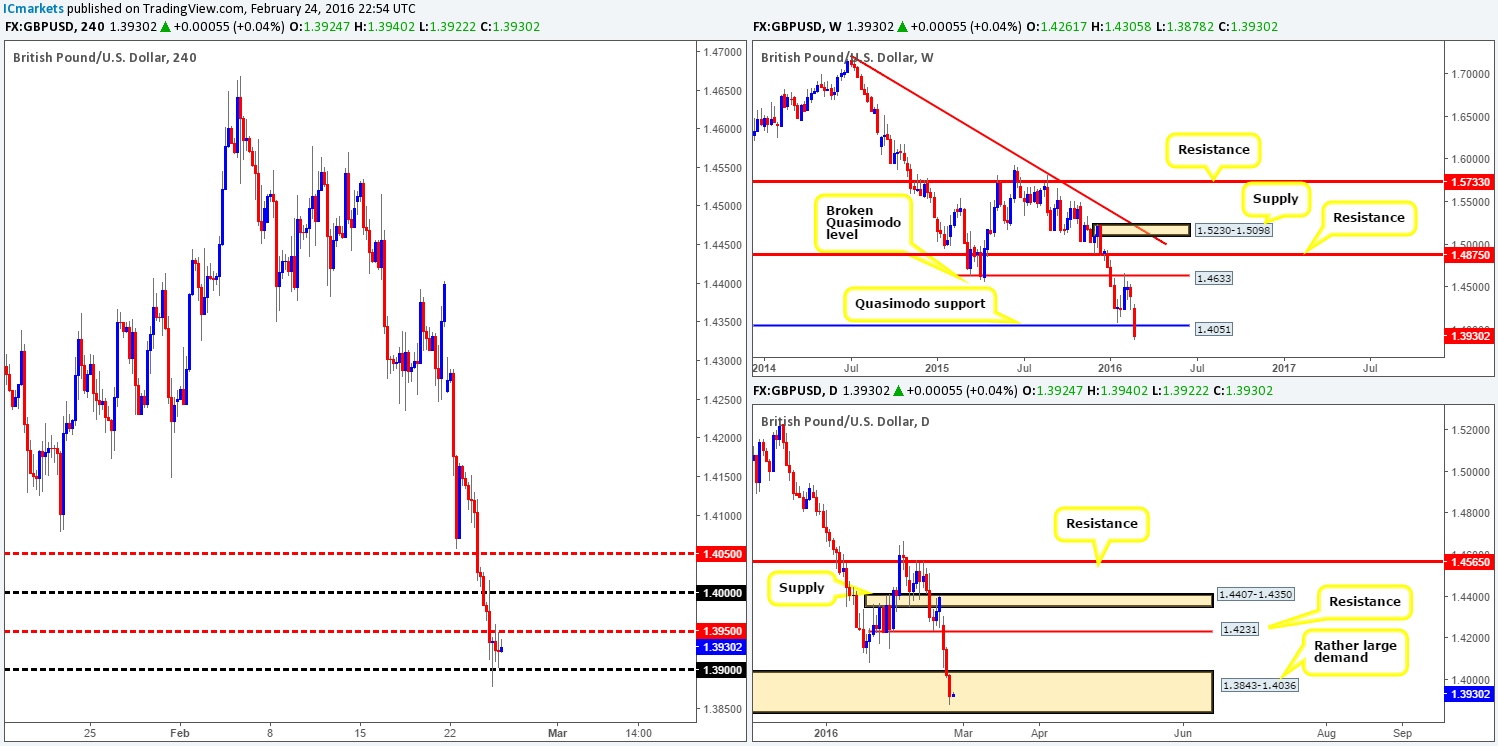
The bearish pulse continued to beat in this market yesterday as the pound cascaded lower for a third consecutive day, losing around 100 pips by the close as fears of a Brexit from the E.U. continue to weigh on this pair. Despite this, mid-way through London trading, price bottomed out around the psychological support 1.3900, resulting in the market sandwiching itself between here and mid-level resistance 1.3950 for the remainder of the day.
The weekly Quasimodo support line at 1.4051 appears to be struggling with this downward pressure at the moment, but could be saved by a rather large daily demand penciled in at 1.3843-1.4036. Although price has effectively found a strong foothold at 1.3900 and, as we just mentioned, is trading from within daily demand, buying against recent momentum and the overall larger trend is not really something we’d get excited about! Conversely, our team would not be comfortable shorting the break/retest of 1.3900 today due to the above said daily demand.
As you can see, there is not much in the way of a tradable setup on this pair at present. As such, we’ll patiently wait for further developments on the sidelines today.
 Levels to watch/live orders:
- Buys: Flat (Stop loss: N/A).
- Sells: Flat (Stop loss: N/A).
AUD/USD:
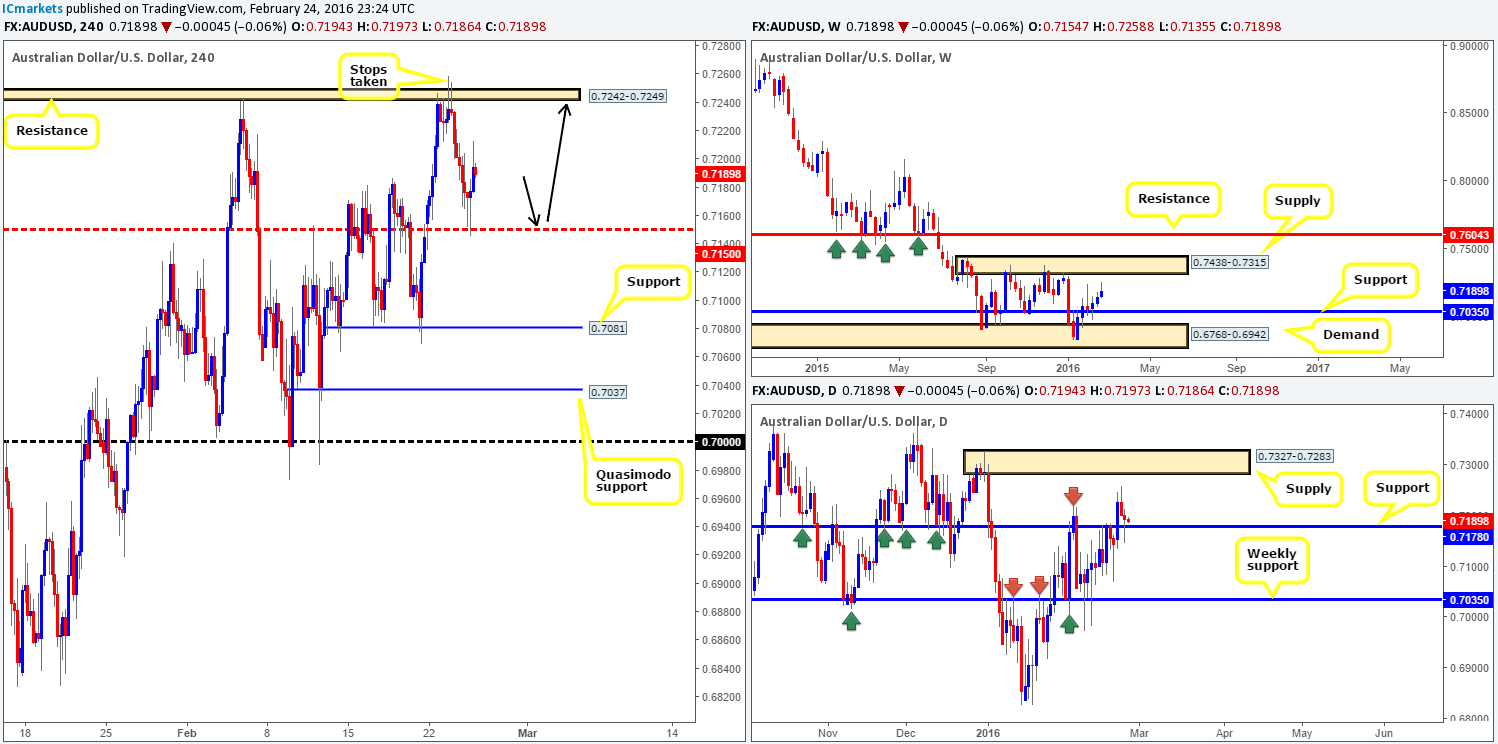
The AUD/USD pair, as you can see, stamped in a bottom mid-way through London trading yesterday from mid-level support 0.7150, reaching highs of 0.7213 on the day. Alongside this, one can also see that daily support at 0.7178 was tagged into the action yesterday. This – coupled with room being seen to move higher on the weekly chart up to supply painted at 0.7438-0.7315, indicates the buy-side of this market is the more favorable today.
Ideally, we’d like to see price retest the 0.7150 region as this would allow us optimal entry for greater risk/reward (see black arrows).Waiting for the lower timeframes to confirm this level is advisable, however, due to the strong possibility of a fakeout being seen here. In the event that this trade comes to fruition, we’d be looking to target the H4 resistance area at 0.7242-0.7249. We’re quite confident the majority of offers have likely been taken out here, but one can never be sure as there may be residual orders still lurking here from the previous fakeout (stop run). Assuming we get above this barrier, the next and final take-profit target can be seen at the underside of daily supply drawn from 0.7327-0.7283 (glued to the underside of the aforementioned weekly supply).
 Levels to watch/live orders:
- Buys: 0.7150 [Tentative – confirmation required] (Stop loss: dependent on where one confirms this level).
- Sells: Flat (Stop loss: N/A).
USD/JPY:
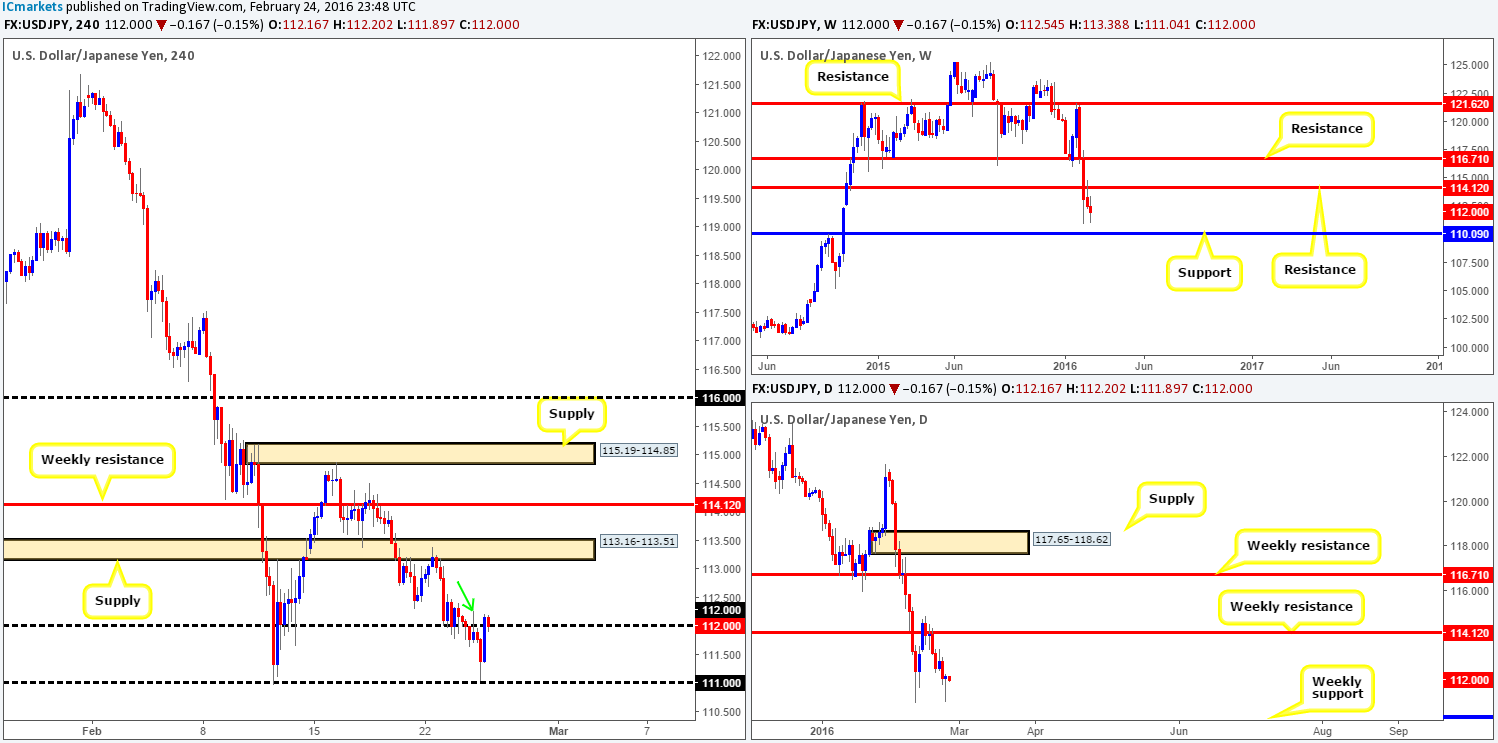
In our previous report (http://www.icmarkets.com/blog/wednesday-24th-february-daily-technical-outlook-and-review/), it was noted to watch for price to close below and retest the 112.00 figure. As shown on the H4 chart, price did exactly that yesterday, and also painted a H4 bearish selling wick which made for a perfect entry south (see green arrow). We do hope some of our readers took advantage of this as a few hours after being filled, price hit target one – the 111.00 figure.
Based on recent movement, this is how we’re seeing things right now… The daily chart shows active bids coming into the market off the Feb 11th low 110.96, which might, just might, push prices back up to weekly resistance at 114.12. Supposing that 110.96 gives way, however, our expectations would then be for price to drive down to weekly support penciled in at 110.09.
Therefore, there are two routes one could take concerning this pair. The first would be to wait for a sustained move above 112.00 and look to trade the retest (preferably with lower timeframe confirmation), targeting H4 supply at 113.16-113.51, followed closely by the aforementioned weekly resistance. The second route would be to wait for the market to close below 111.00. This would likely set the stage for a continuation move down to the 110.00 region (weekly support), and may provide a potential opportunity to trade short should price retest the underside of 111.00 before driving lower.
 Levels to watch/live orders:
- Buys: Watch for offers to be consumed around 112.00 and look to trade any retest seen thereafter (lower timeframe confirmation required).
- Sells: Watch for bids to be consumed around 111.00 and look to trade any retest seen thereafter (lower timeframe confirmation required).
USD/CAD:
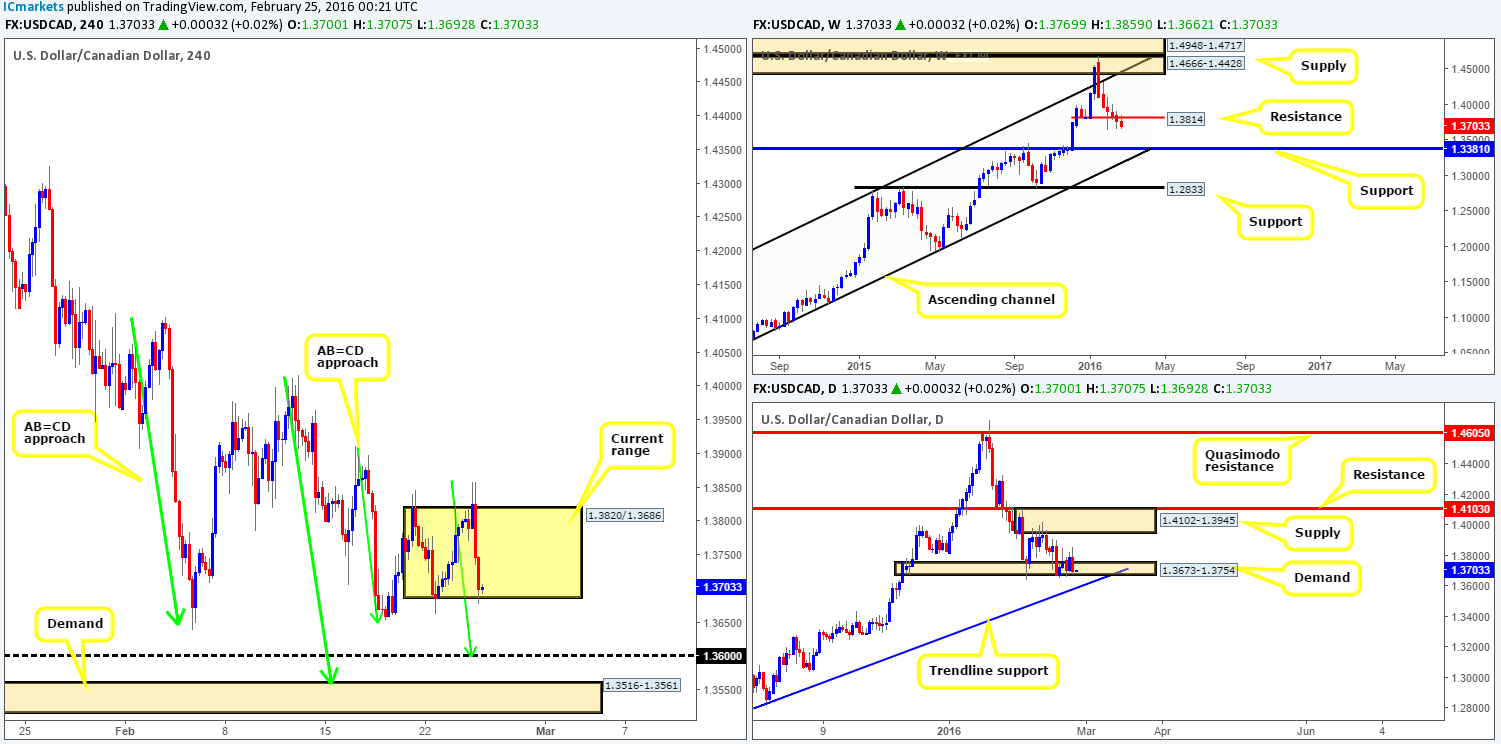
Beginning with the weekly chart this morning, resistance at 1.3814 is seen doing a good job of holding the Loonie lower at the moment. Should the bears remain dominant here, it’s likely that we’ll see this pair cross paths with support at 1.3381 (converges nicely with channel support taken from the low 1.0630) sometime soon. On the other side of the coin, daily action shows that downside remains capped by demand coming in at 1.3673-1.3754. However, judging by recent price action, we feel this area is very likely going to break soon and open the gates for prices to challenge the daily trendline extended from the lows 1.1919.
Moving down to the H4 chart, we can see that price is currently chalking up a rather large range fixed between 1.3820/1.3686. Despite this, our focus remains on the two H4 AB=CD bull patterns (see green arrows) currently printing on approach to a psychological support at 1.3600 and a H4 demand fixed at 1.3516-1.3561. As we mentioned in previous reports, both of these areas are supported by the daily trendline extended from the low 1.1919. Despite this, we favor longs from the demand. Our rationale behind this approach comes from the fact that psychological boundaries such as 1.3600 are notorious for fakeouts, and with a juicy-looking H4 demand lurking only forty pips below at 1.3516-1.3561, a break lower is very likely, hence our decision to focus on the demand.
Despite the confluence seen at this demand, nevertheless, we would highly recommend waiting for the lower timeframes to confirm this zone since, weekly action is presently showing room for a move lower (see above).
Levels to watch/live orders:
- Buys: 1.3600 [Tentative – confirmation required] (Stop loss: dependent on where one confirms this level). 1.3516-1.3561 [Tentative – confirmation required] (Stop loss: dependent on where one confirms this area).
- Sells: Flat (Stop loss: N/A).
USD/CHF:
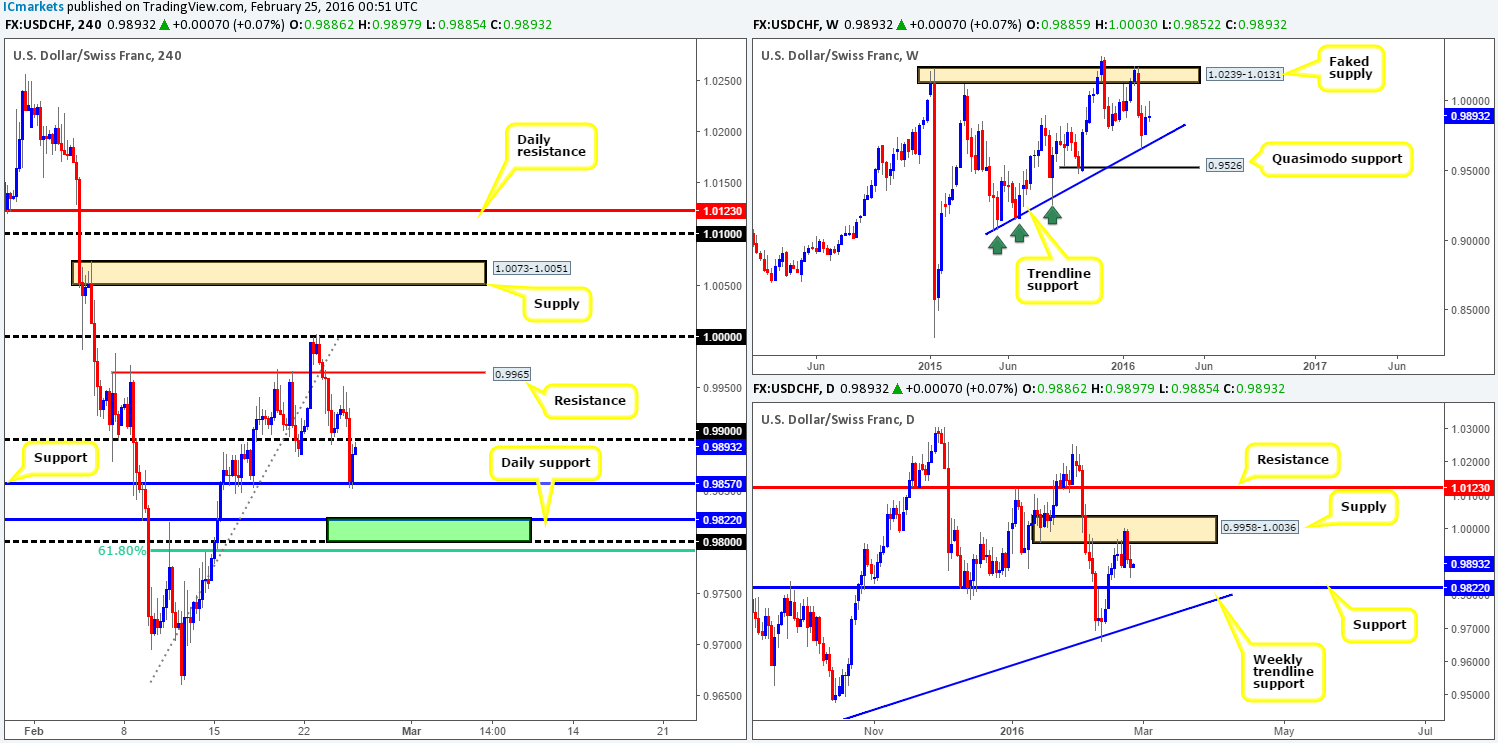
Following a brief bounce from psychological support 0.9900 the USD/CHF continued to snowball south yesterday, consequently driving into the jaws of H4 support at 0.9857. The push from here allowed price to retest the underside 0.9900 which should act as resistance now. Considering where price came from (daily supply at 0.9958-1.0036), we feel this market may attempt to break below the current H4 support today and head towards daily support at 0.9822.
This daily support – coupled with psychological support 0.9800 (green area) and the 61.8% Fibonacci level just below at 0.9791 forms a relatively compact buy zone to have on your watch list today. The first take-profit target from here will be dependent on the H4 approach to this zone as supplies can still potentially form. Just to be clear here traders, we will not be placing pending orders around this area since a fakeout through the zone is highly likely – waiting for price to confirm stability before taking action is, at least in our book, the best course of action.
Levels to watch/live orders:
- Buys: 0.9800/0.9822 [Tentative – confirmation required] (Stop loss: dependent on where one confirms this area).
- Sells: Flat (Stop loss: N/A).
DOW 30:
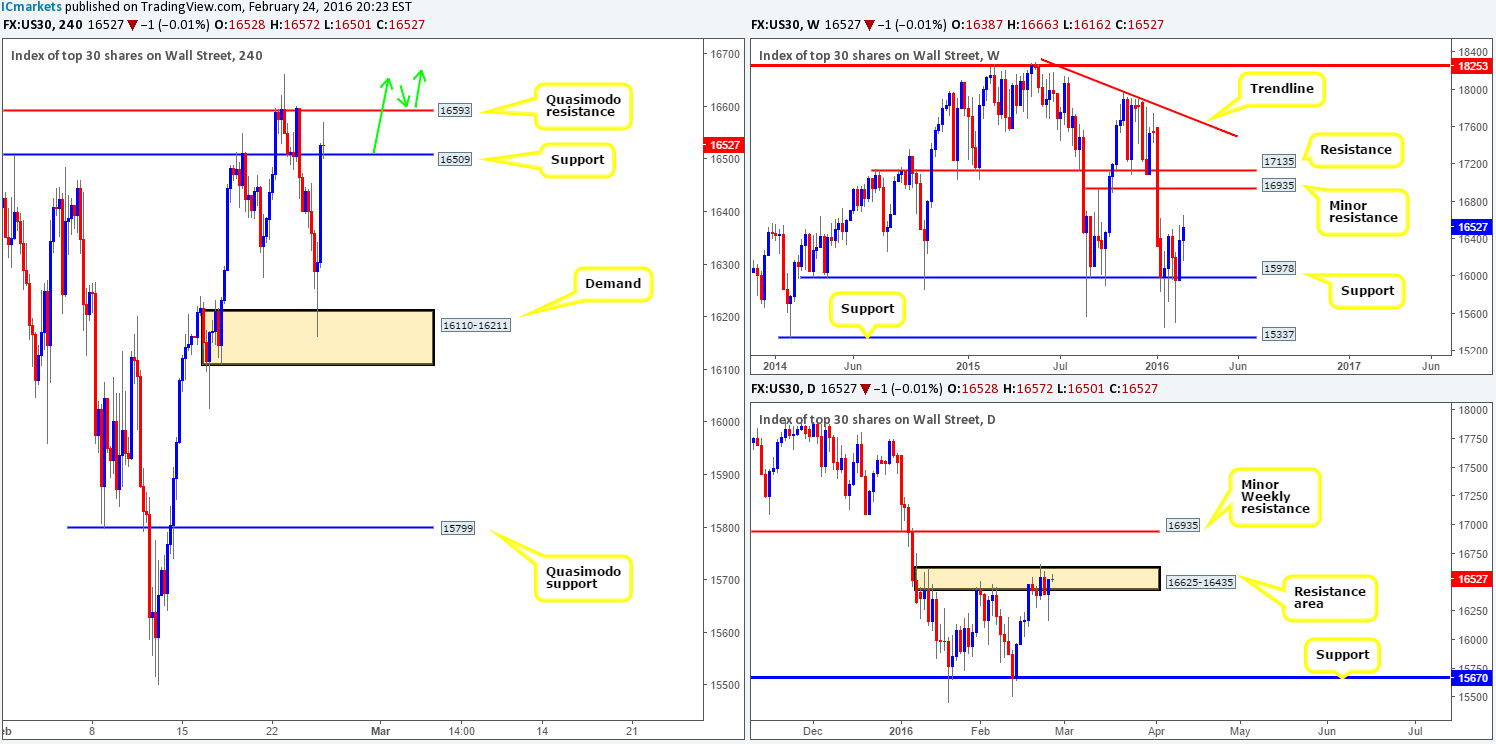
Kicking-off this morning’s analysis with a look at weekly chart shows that the bulls remain somewhat dominant following last week’s rebound from support at 15978. The next upside target from here can be seen at 16935 – a minor resistance level. Breaking into the daily chart, however, supply at 16625-16435 continues to suppress buying. In spite of this, judging by yesterday’s response to this area, this barrier is likely set to give way very soon which will potentially open the trapdoor for prices to challenge the aforementioned minor weekly resistance. Scrolling across to the H4 chart, we can see that demand penciled in at 16110-16211 saw a beautiful reaction yesterday, bouncing prices above resistance (now acting support) at 16509 in one fell swoop.
In light of the above, our team is swaying more to the buy-side of this market at the moment. Ultimately, we’re looking for price to CLOSE above the H4 Quasimodo resistance line at 16593 today. This would, in effect, be our cue to begin watching for price to retest this barrier as support for a potential buy trade up to H4 supply at 17009-16905 (encapsulates the minor weekly resistance level at 16935).
Levels to watch/live orders:
- Buys: Watch for offers to be consumed around 16593 and look to trade any retest seen thereafter (lower timeframe confirmation required).
- Sells: Flat (Stop loss: N/A).
XAU/USD: (Gold)
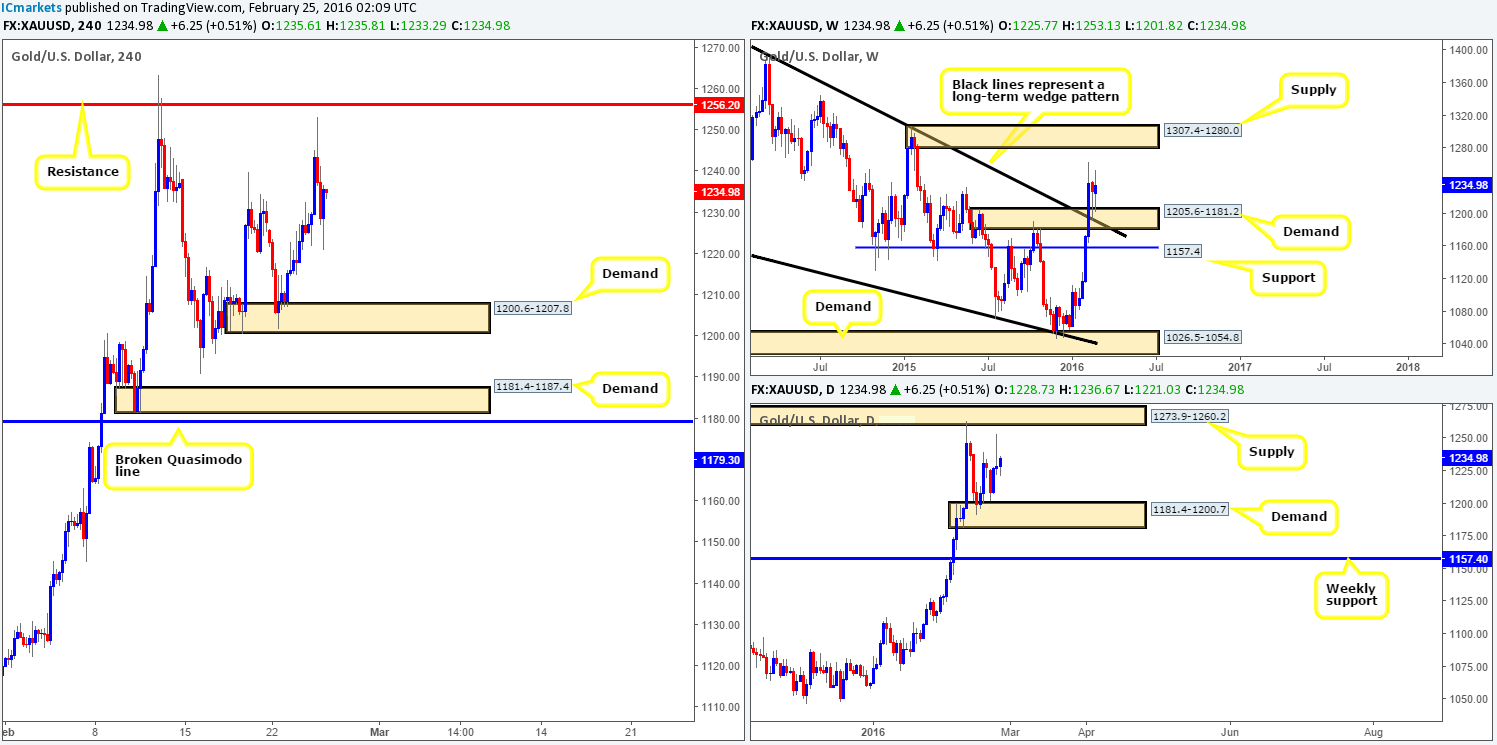
Starting from the top this morning, the yellow metal remains bid from the weekly demand at 1205.6-1181.2, which boasts a broken weekly wedge resistance (now support) taken from the high 1485.3. From here, we see little in the way of resistance until price crosses paths with supply taken from 1307.4-1280.0. Branching lower to the daily chart, Gold is seen loitering mid-range between demand at 1181.4-1200.7 and supply overhead at 1273.9-1260.2. A break above this supply will land one within touching distance of the weekly supply area mentioned above, whilst a break below places weekly support 1157.4 back in view.
Given that price is trading from a weekly buy zone right now, we’re swaying more to the buy-side of this market for the time being. That being the case, all eyes will be on the following H4 areas today:
- The demand at 1200.6-1207.8, which sits on top of the daily demand mentioned above at 1181.4-1200.7.
- On the assumption that the above area caves in, the next buy zone can be seen at 1181.4-1187.4 – another demand which happens to be positioned within the extreme of the above said daily demand.
Both areas are high-probability in our opinion. The higher of the two may see a small fakeout, however, since this area has already been visited, so we’d advise waiting for the lower timeframes to confirm this zone before risking capital. The lower of the two demands is also open to a fakeout due to the broken H4 Quasimodo line lurking just below it at 1179.3. One could trade this zone at market if they are fine with placing their stops below this Quasimodo line. If not, it might be best to go with the safe option and trade only upon pinning down a lower timeframe buy set up.
Levels to watch/live orders:
- Buys: 1200.6-1207.8 [Tentative – confirmation required] (Stop loss: dependent on where one confirms this area). 1181.4-1187.4 [Tentative – confirmation required] (Stop loss: dependent on where one confirms this area).
- Sells: Flat (Stop loss: N/A).


