
A note on lower timeframe confirming price action…
Waiting for lower timeframe confirmation is our main tool to confirm strength within higher timeframe zones, and has really been the key to our trading success. It takes a little time to understand the subtle nuances, however, as each trade is never the same, but once you master the rhythm so to speak, you will be saved from countless unnecessary losing trades. The following is a list of what we look for:
- A break/retest of supply or demand dependent on which way you’re trading.
- A trendline break/retest.
- Buying/selling tails/wicks – essentially we look for a cluster of very obvious spikes off of lower timeframe support and resistance levels within the higher timeframe zone.
- Candlestick patterns. We tend to stick with pin bars and engulfing bars as these have proven to be the most effective.
We search for lower timeframe confirmation between the M15 and H1 timeframes, since most of our higher-timeframe areas begin with the H4. Stops are usually placed 5-10 pips beyond confirming structures.
EUR/USD:
The EUR managed to find momentary support around the 1.06 handle in the early hours of London yesterday on the back of stronger-than-expected Eurozone PMI data. Price managed to clock a high of 1.0636 from here, before turning bearish. Bolstered by strong US Durable goods data, the EUR closed below 1.06 and found support around the H4 mid-way point 1.0550 going into the US segment. Shortly after, the FOMC released minutes of its latest meeting, which was largely ignored by the market, since, as far as we can see, there was little reported that investors did not already know.
Over on the bigger picture, we can see that weekly action is now trading within touching distance of a major support area coming in at 1.0333-1.0502. Meanwhile, thanks to yesterday’s selloff, the daily Quasimodo support at 1.0557 was consumed and has potentially opened the floodgates down to 1.0494: another Quasimodo support!
Our suggestions: On account of the above points, we have the H4 candles kissing support at 1.0550, the daily candles suggesting a downside move to 1.0494 and the weekly candle positioned nearby the top edge of a support area at 1.0502. The confluence seen molded around the 1.05 handle is, at least in our book of technical setups, enough to permit a pending buy order at 1.0495 with a stop placed below the head of the daily Quasimodo formation at 1.0459.
Granted, this does mean, as we mentioned in Monday’s weekly report, buying into the current downside flow brought on by the possibility of a rate hike in December. However, we’re not looking for a full-blown reversal here, simply a well-planned bounce back up to the 1.0557 region as an immediate take-profit zone.
Data points to consider: German Ifo data at 9am. US banks will be closed today in observance of Thanksgiving Day.
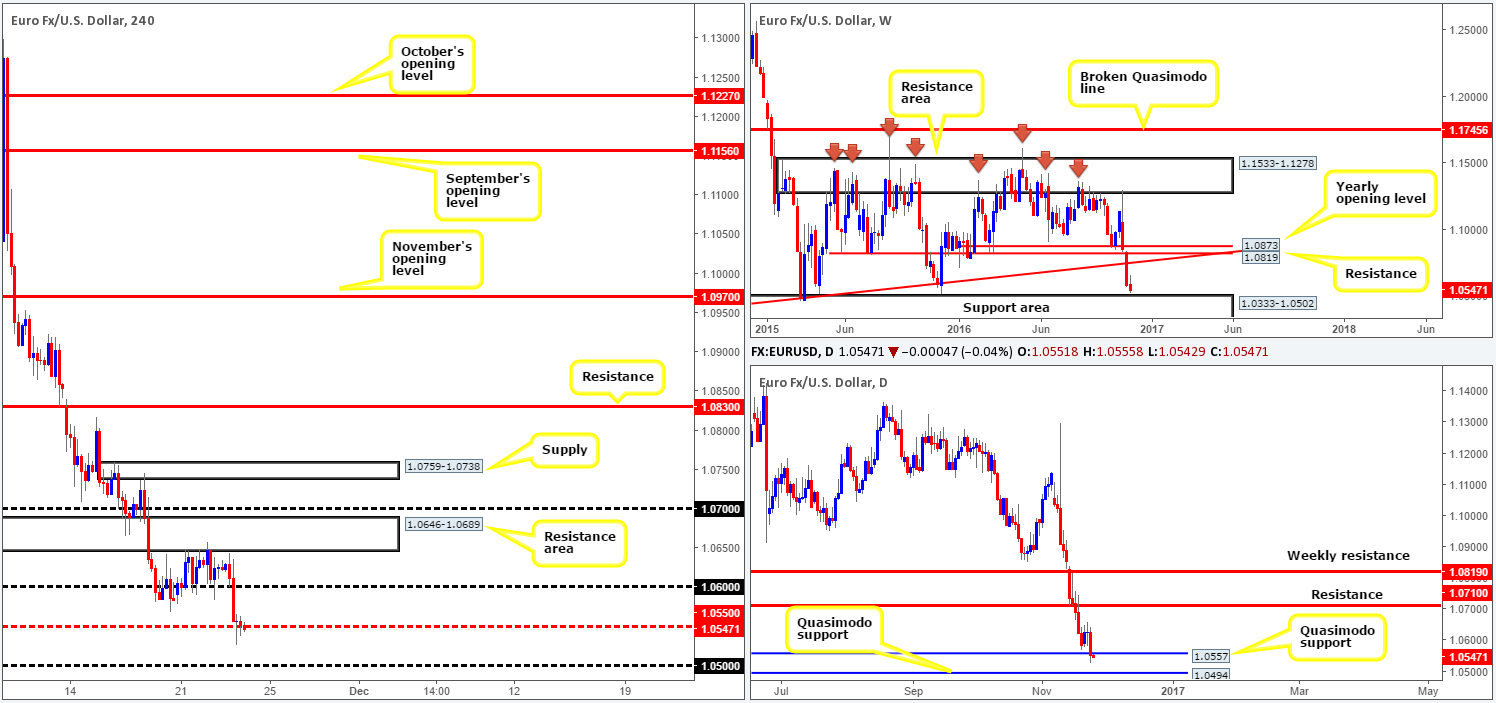
Levels to watch/live orders:
- Buys: 1.0495 ([pending order] stop loss: 1.0459).
- Sells: Flat (stop loss: N/A).
GBP/USD:
(Trade update: Suffered a loss at 1.2382 – please see previous report for details)
Kicking off this morning with a look at the weekly structure, there’s very little new to report. Cable remains drifting mid-range between resistance at 1.2942 and support drawn from 1.1904. Lower down on the daily chart on the other hand, price tapped the trendline support extended from the low 1.1904 amid yesterday’s US open, which, as you can see, ended the day printing an indecision candle. The next upside objective from this angle falls in at 1.2557: a daily Quasimodo resistance barrier. Turning our attention to the H4 candles, the support area at 1.24-1.2377 was faked during yesterday’s trading, brought on by upbeat US Durable goods data. Leaving the support at 1.2353 unchallenged, we saw the unit climb to highs of 1.2468 on the day.
Our suggestions: Given bids are currently supported by a daily trendline, the only area that really snatches our attention at the moment is the H4 resistance zone formed at 1.2525-1.2557. The area boasts a H4 61.8% Fib resistance at 1.2531, a H4 mid-way resistance at 1.2550, and the top edge represents the daily Quasimodo resistance at 1.2557 which also converges nearby a H4 AB=CD bearish completion point at 1.2563. Furthermore, let’s also bear in mind that by selling from here, you’d be shorting alongside the current weekly trend!
While the above area sports attractive confluence, we would still like to see evidence of interest from the sellers before committing. A reasonably sized H4 bearish candle would be sufficient, in our opinion.
Data points to consider: US banks will be closed today in observance of Thanksgiving Day.
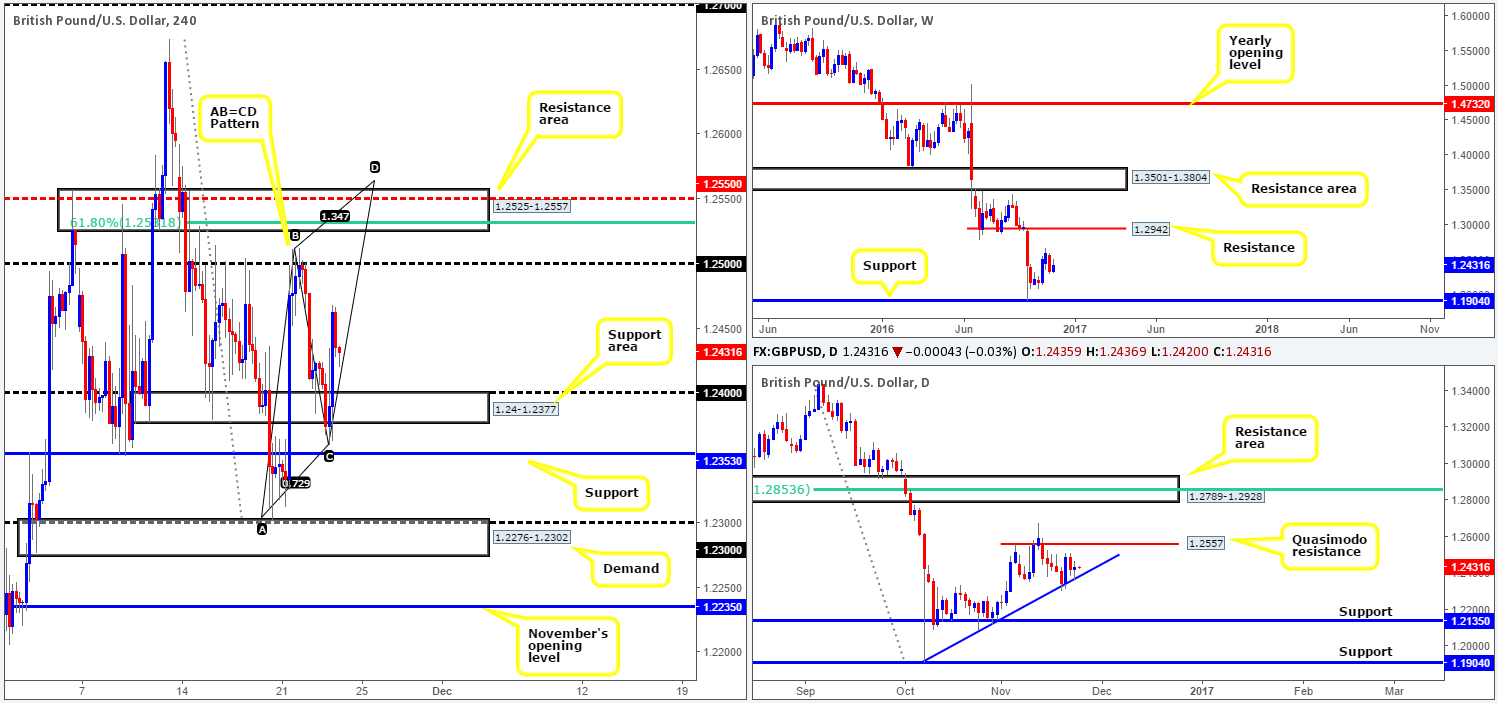
Levels to watch/live orders:
- Buys: Flat (stop loss: N/A).
- Sells: 1.2563/1.2525 ([reasonably sized H4 bearish close required prior to pulling the trigger] stop loss: ideally beyond the trigger candle).
AUD/USD:
Yesterday’s opening action on the H4 chart saw the bulls take on an offensive role above the 0.74 handle, bidding prices up to highs of 0.7444.Leaving the H4 broken Quasimodo line at 0.7451 (also represents the underside of a daily resistance area) unchallenged, the pair topped here amid yesterday’s London open and proceeded to fall away. Exacerbated by upbeat US Durable goods data, the commodity currency eventually engulfed the 0.76 boundary and shortly after retested the underside as resistance going into the close.
Looking at H4 structure, there’s little seen stopping price from continuing lower today down to at least Monday’s low 0.7311, mainly due to, what we believe is, a H4 demand consumption tail marked with a blue arrow at 0.7368. Granted, this goes against current weekly structure since price occupies a support area coming in at 0.7438-0.7315. However, with the yearly opening level sitting directly below this zone at 0.7282, we feel the 0.73 handle (located just below Monday’s low and positioned within the daily support area at 0.7281-0.7334) along with the yearly opening level should provide enough support to at least stabilize price.
Our suggestions: The 0.73 handle – coupled with the yearly opening level at 0.7282, in our estimation, offers enough confluence to consider trading long. Be that as it may, this is a rather small area and is potentially liable to being faked. Therefore, we would strongly recommend waiting for a reasonably sized H4 bullish candle to form here before pressing the buy button.
Data points to consider: US banks will be closed today in observance of Thanksgiving Day.
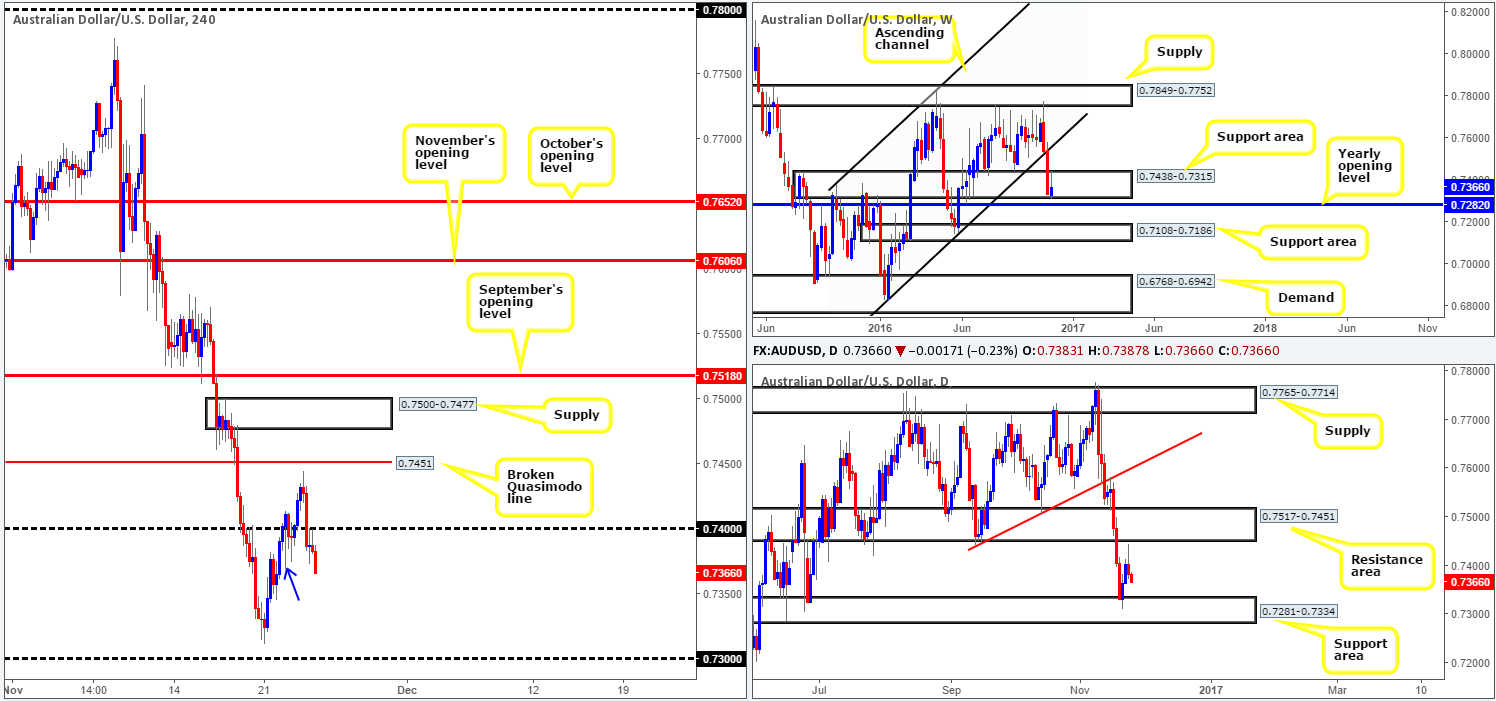
Levels to watch/live orders:
- Buys: 0.7282/0.73 ([reasonably sized H4 bullish close required prior to pulling the trigger] stop loss: ideally beyond the trigger candle).
- Sells: Flat (stop loss: N/A).
USD/JPY:
In view of the pair’s most recent drive north, intensified by yesterday’s optimistic US Durable goods reading, weekly price cleared supply at 111.44-110.10 and currently trades around the 112.60 region. Before one looks to buy, however, there’s a lot of wood seen to chop through between the 114.87/111.44 area (green circle) before price is clear to touch gloves with resistance penciled in at 116.08. On the other side of the field, the daily candles are seen trading within shouting distance of a supply zone drawn from 113.80-113.16. This area, from our perspective, is the last FRESH supply seen ahead of the above noted weekly resistance.
Over on the H4 chart, nevertheless, yesterday’s bout of buying took out the 112 handle and topped just ahead of 113 amid the US open. The FOMC minutes had little effect on price action following this, resulting in the candles entering into a consolidation phase into the close.
Our suggestions: With the lower edge of the aforementioned daily supply seen lurking just above the 113 handle at 113.16, this could lead to a fakeout through 113 today. This, in our view, is a tradable move seeing as weekly price also shows a rather large congested area of resistance around the 111.44-110.10 region (see above). What’d be an ideal signal to short here is a H4 bearish selling wick that whipsaws through 113 into offers around the daily supply zone.
Data points to consider: Tokyo Core CPI at 11.30pm GMT. US banks will be closed today in observance of Thanksgiving Day.
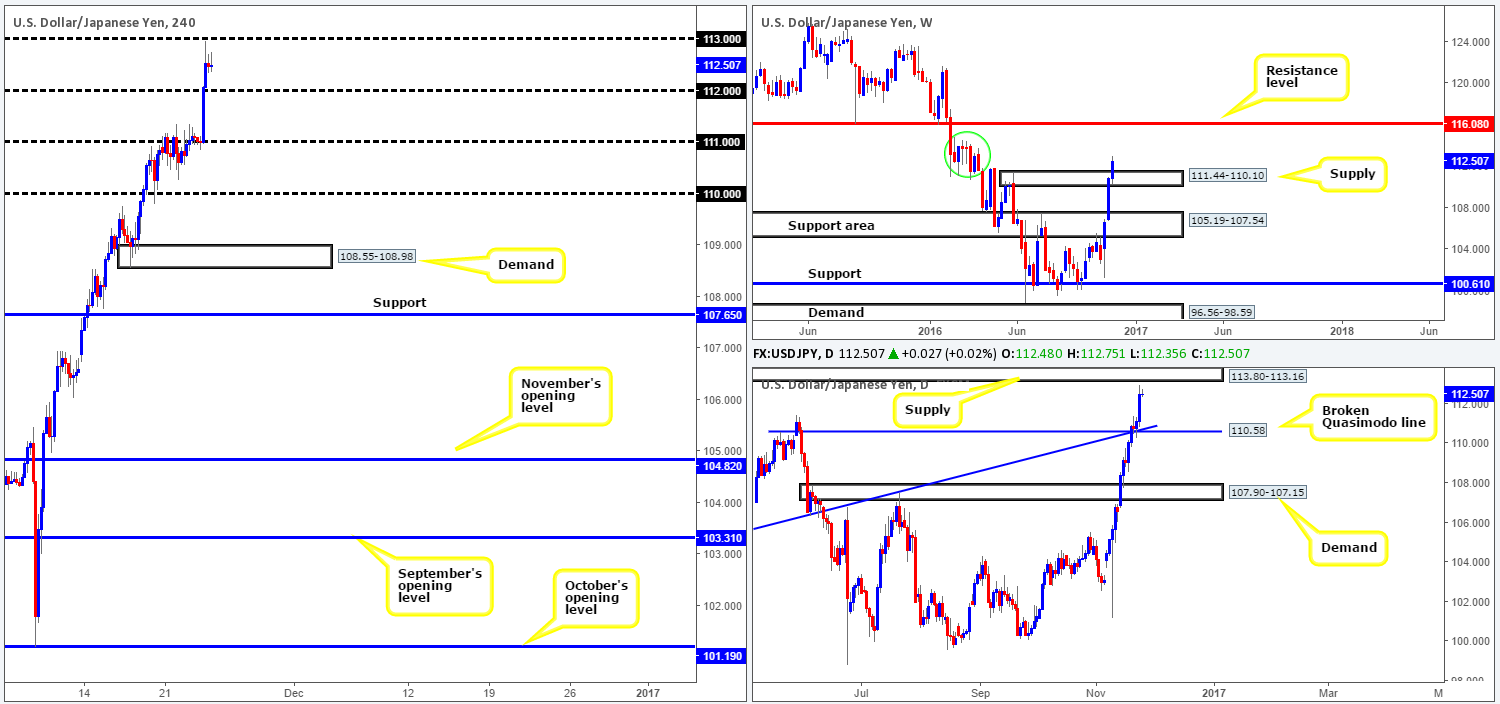
Levels to watch/live orders:
- Buys: Flat (stop loss: N/A).
- Sells: Watch for a H4 bearish selling wick to form that pierces through the 113 level. This is a signal to short with stops placed either above the daily supply at 113.82 or above the candle wick.
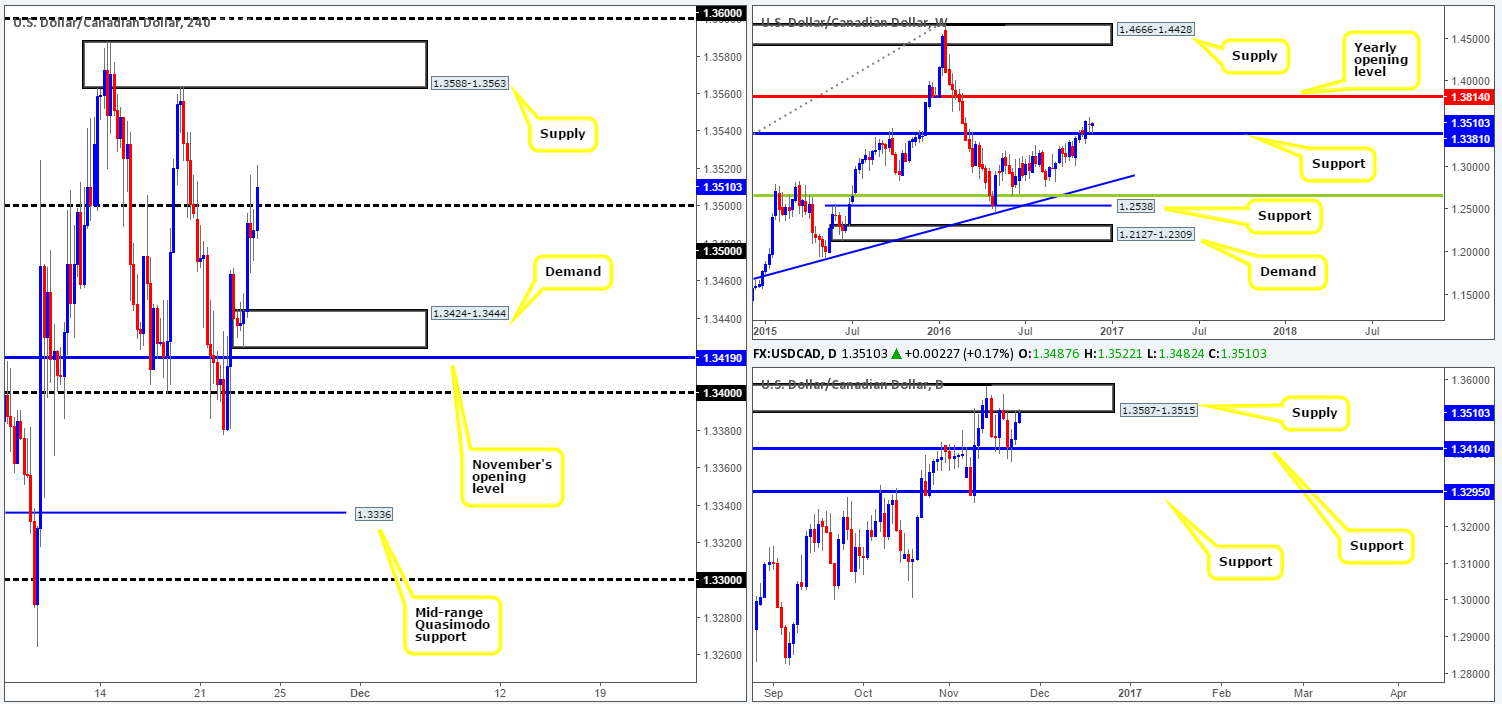
USD/CAD:
The USD/CAD, as can be seen from the H4 chart, missed November’s opening level by a cat’s whisker yesterday at 1.3419, before taking off north going into the London open. Bolstered by upbeat US data, the US dollar eventually reached the 1.35 handle which held steady throughout the remainder of the US session.
In recent hours, however, the pair extended above 1.35 and looks poised to advance north towards H4 supply coming in at 1.3588-1.3563. What this recent move higher also did was place the daily candles around the base of a supply zone fixed at 1.3587-1.3515. Yet, despite this, we can also see weekly action trading long from support at 1.3381, with the upside looking clear for a run up to the yearly opening level at 1.3814.
Our suggestions: To become buyers in this market, a decisive H4 close is required beyond the 1.36 handle. This would highly likely clear stops from above the daily supply, and open the pathway the north to H4 resistance at 1.3662.
In regard to selling, we would hold fire. Yes. Daily price is trading around the lower edge of a supply zone, but considering the recent break through 1.35 and, more importantly, the fact that weekly bids are holding firm above the current support, we would not feel comfortable selling this market at the moment.
Data points to consider: US banks will be closed today in observance of Thanksgiving Day.
Levels to watch/live orders:
- Buys: To become buyers 1.36 needs to be consumed.
- Sells: Flat (stop loss: N/A).
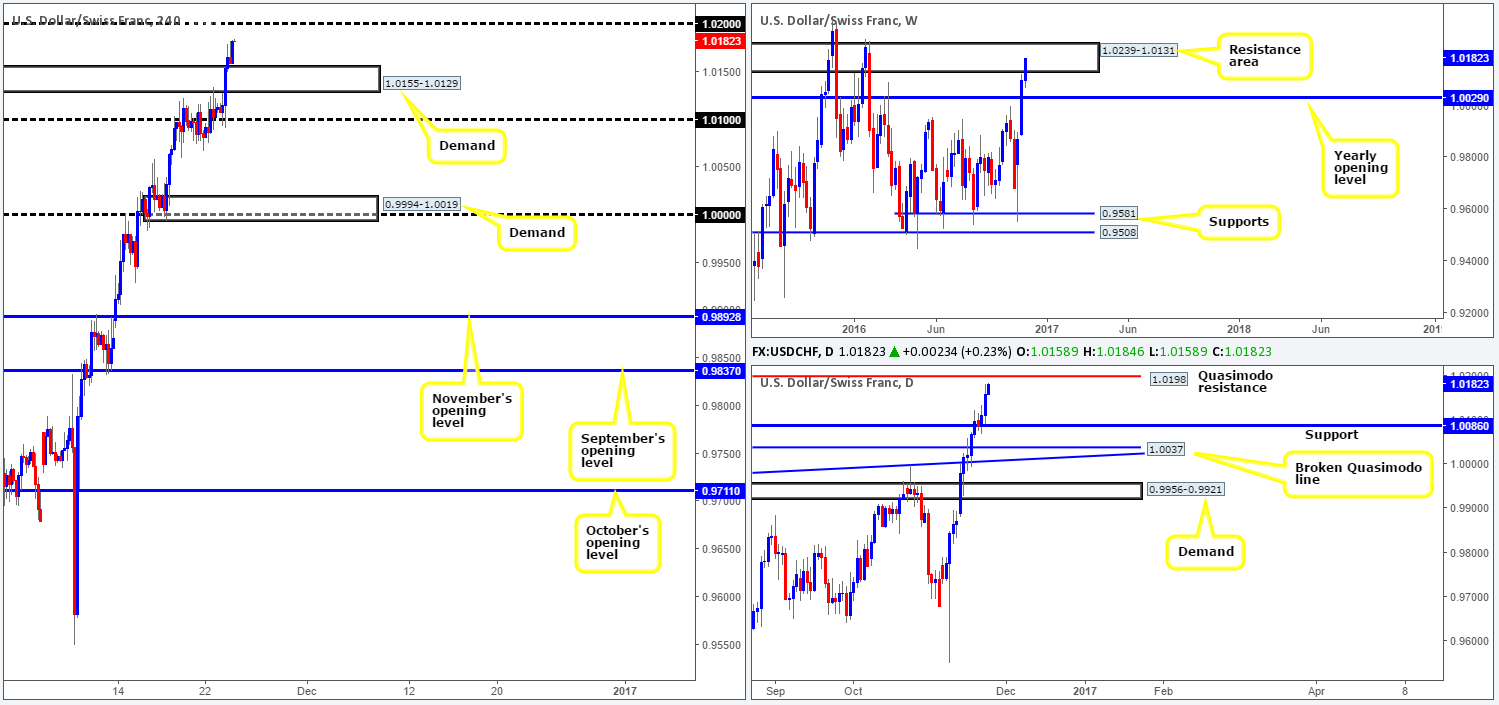
USD/CHF:
Following a retest of the 1.01 handle during yesterday’s London morning segment, the US dollar aggressively rallied against the Swiss Franc. Strengthened by upbeat US data, H4 supply at 1.0155-1.0129 was wiped out (now acting demand), leaving price free to challenge the 1.02 handle. Now, selling from 1.02 may seem a daunting prospect given the strength of the dollar at this time. While this is a logical assumption, one may still be interested to know that 1.02 fuses beautifully with a daily Quasimodo resistance level at 1.0198, and is located within a weekly resistance area at 1.0239-1.0131. Therefore, price is highly likely to produce a reaction from this angle.
Our suggestions: As most are likely already aware, psychological boundaries are typically prone to fakeouts, which makes them rather precarious when considering setting pending orders. Therefore, our desk has come to a consensus that in order to trade from 1.02 today, we’d need confirmation from the lower timeframes (see the top of this report).
In addition to the confluence seen around 1.02, traders may have also noticed that this setup correlates beautifully with our pending buy order placed on the EUR at 1.0495 (see above). These two markets are generally inversely correlated, thus given the bearish signal on the Swissy and the bullish setup on the EUR, both levels are high-probability, in our opinion.
Data points to consider: US banks will be closed today in observance of Thanksgiving Day. CHF – Gov. Board member Zurbrugg speaks today at 5.15pm GMT.
Levels to watch/live orders:
- Buys: Flat (stop loss: N/A).
- Sells: 1.02 region ([lower timeframe confirmation required prior to pulling the trigger] stop loss: dependent on where one confirms this area).
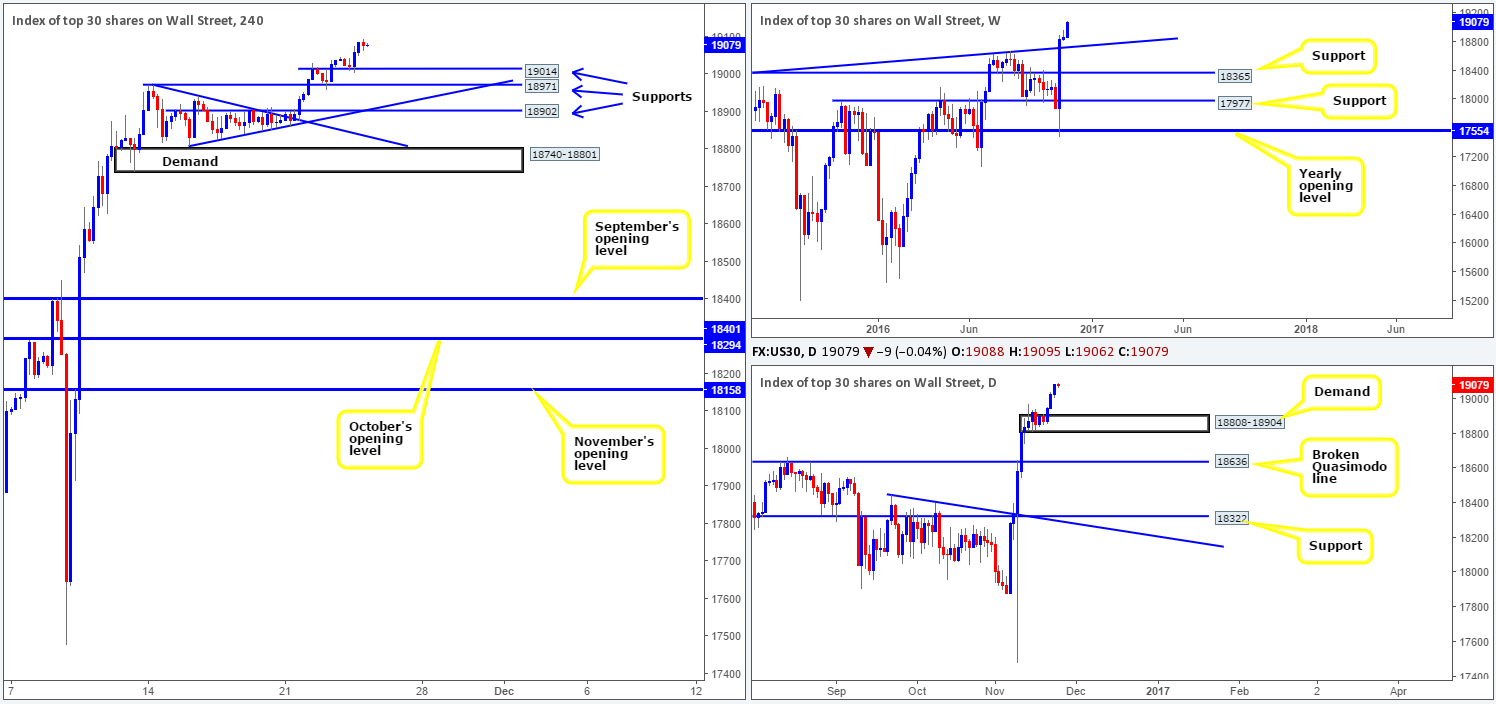
DOW 30:
The DOW, as you can see on the H4 chart, added to its all-time high yesterday, following a brief dip down to the 19014 neighborhood. As we write, US equities are priced at 19082 and show little sign of slowing down. The response from the H4 support 19014 was relatively sound, and could, if retested for a second time today, hold just as firm we feel. While this could be a logical base for price to bounce from, traders need to be prepared for the possibility that price may stretch beyond this level. The H4 support at 18971, which held nicely on Tuesday, is also a level of note. Furthermore, do keep an eye on the deepest of the three levels: a H4 support coming in at 18902, which, for the time being, corresponds nicely with a H4 trendline support extended from the low 18808.
Our suggestions: Given that there’s absolutely no higher-timeframe resistance seen on the horizon, all three H4 supports mentioned above are possible levels to buy from. Market action may be a little slower today, though, since US banks will be closed today in observance of Thanksgiving Day.
Levels to watch/live orders:
- Buys: 19014 ([reasonably sized H4 bullish close required prior to pulling the trigger] stop loss: ideally beyond the trigger candle). 18971 ([reasonably sized H4 bullish close required prior to pulling the trigger] stop loss: ideally beyond the trigger candle). 18902 ([reasonably sized H4 bullish close required prior to pulling the trigger] stop loss: ideally beyond the trigger candle).
- Sells: Flat (stop loss: N/A).
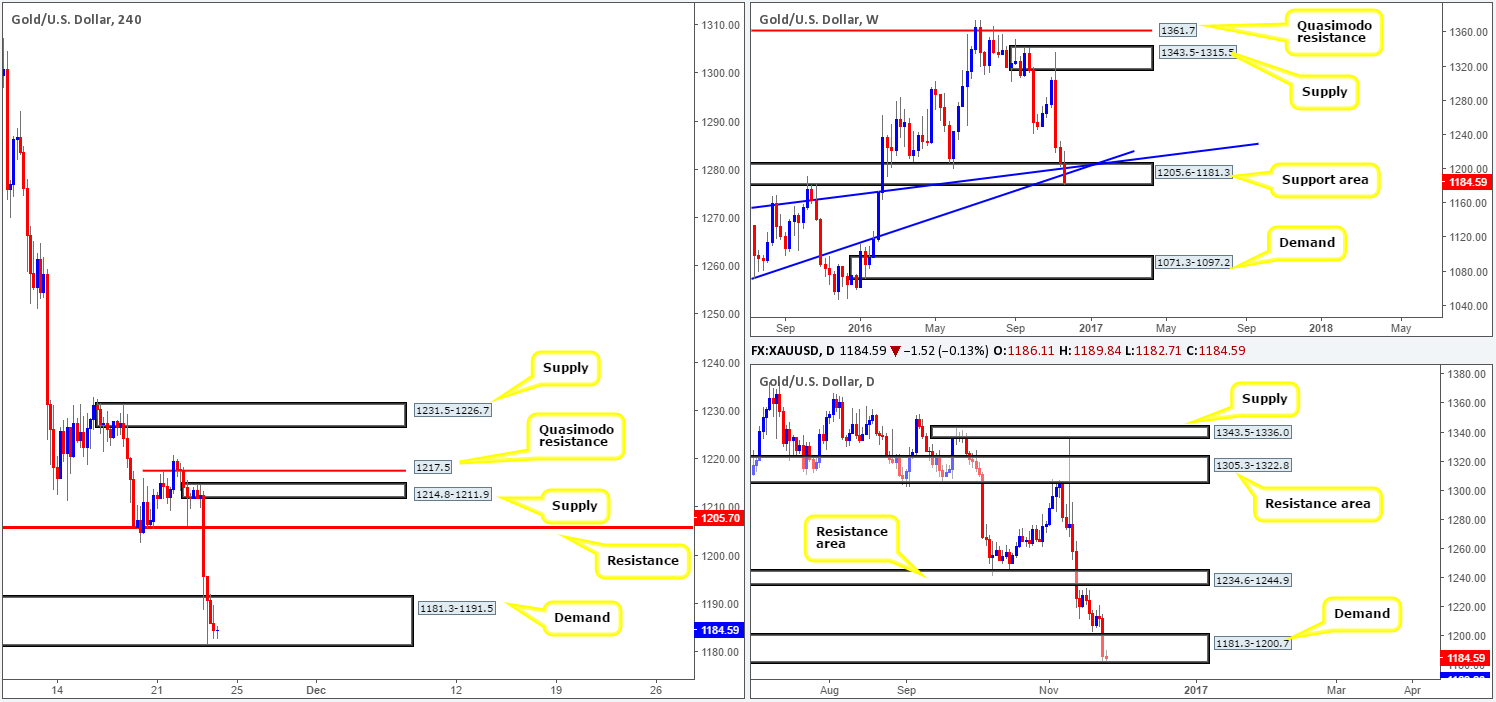
GOLD:
The yellow metal sustained further losses yesterday, as the US dollar benefitted from upbeat US data. Gold’s weekly candle sliced through two trendline supports (1130.1/1071.2), and is now seen kissing the lower edge of a major support area coming in at 1205.6-1181.3. A decisive push below this weekly zone could open up the trail down to demand coming in at 1071.3-1097.2. The daily demand at 1181.3-1200.7, which formed from the break of the 15/10/15 high at 1191.4, also came under pressure yesterday. The only difference between the weekly and daily charts is the next downside projection on the daily scale comes in at 1169.8: a support level that boasts strong history.
Our suggestions: With H4 demand at 1181.3-1191.5 still in play, and considering that it sits within the extremes of the current daily demand area at 1181.3-1200.7, which by extension, is positioned within the extremes of the weekly support area at 1205.6-1181.3, selling right now is just too risky for our team. Granted, the bears do look incredibly strong around the current demands, but we’d prefer to see at least a decisive H4 close below the current H4 demand base before looking to enter short down to daily support at 1169.8.
Concerning longs in this market, we would recommend treading carefully here. Gold has been under pressure since Trump’s presidential victory over Clinton, and has shown very little sign of easing. From a technical perspective, however, should a H4 bullish engulfing candle take shape within the current H4 demand, one could consider buying here and targeting H4 resistance at 1205.7.
Levels to watch/live orders:
- Buys: Before considering buys in this market, consider waiting for at least a H4 bullish engulfing candle to form within the current H4 demand (stop loss: either below the H4 demand at 1180.0, or below the bullish engulfing formation).
- Sells: Shorts, at least for our team, will not be considered until the current H4 demand base is consumed.


