
EUR/USD:
The minutes of the FOMC’s July/August meeting hinted at a September hike, though in chorus added a mildly dovish note. The central bank warned escalation of trade disputes was a potential downside risk to the economy.
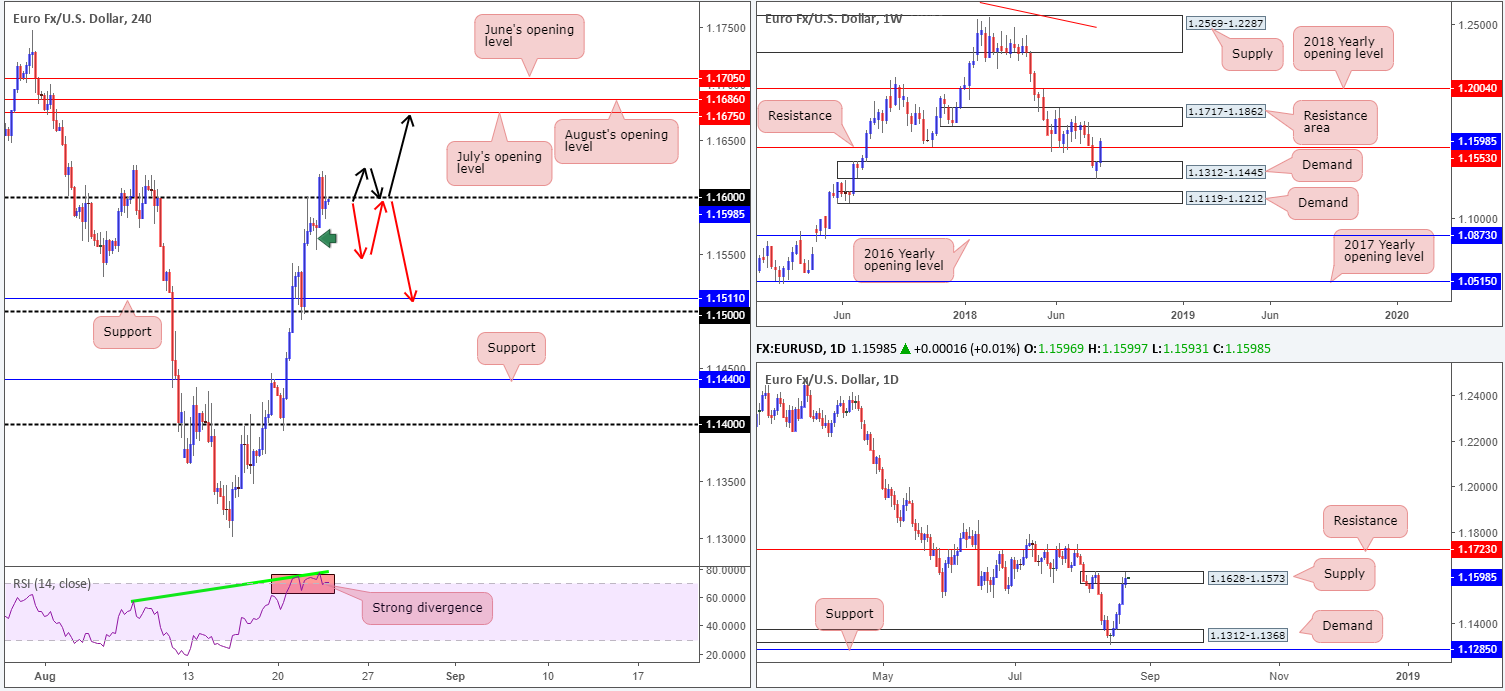
The Fed’s latest movement produced a H1 bearish pin-bar formation on the EUR/USD that pierced through the 1.16 handle on the H4 timeframe. Another key thing to remain aware of on the H4 timeframe this morning is the divergence/overbought reading seen on the RSI indicator.
Daily price continues to interact with strong supply coming in at 1.1628-1.1573, despite upside. The majority of sellers’ orders have likely been filled within this region, given we tested the width of the zone yesterday. A rejection from here has demand at 1.1312-1.1368 to target, whereas a break north places resistance at 1.1723 in the spotlight.
Weekly movement, however, recently crossed above resistance at 1.1553. The next upside objective on this scale does not come into view until the resistance area marked at 1.1717-1.1862 (holds the daily resistance at 1.1723 within its lower limits). Whether or not sellers are consumed here is difficult to judge, as the break is still relatively minor on this timeframe.
Areas of consideration:
A H4 close above 1.16 that’s followed up with a retest in the shape of a full or near-full-bodied bull candle could ignite further buying in this market, targeting July’s opening level at 1.1675, and ultimately the underside of the weekly resistance area at 1.1717. Entry on the close of the candle, with stop-loss orders positioned below the rejecting candle’s tail, could be an option here.
To the downside, nevertheless, an engulf of the nearby H4 support (marked with a green arrow) at 1.1553 would be considered a strong cue for sellers we believe. Removal of this support permits shorts on any retest to the underside of 1.16 (preferably alongside additional candle confirmation), targeting H4 support at 1.1510. Do remember here, traders, we still have daily supply in the fight!
Today’s data points: Slew of Eurozone manufacturing PMIs; ECB monetary policy meeting accounts; Jackson Hole symposium begins today.
GBP/USD:
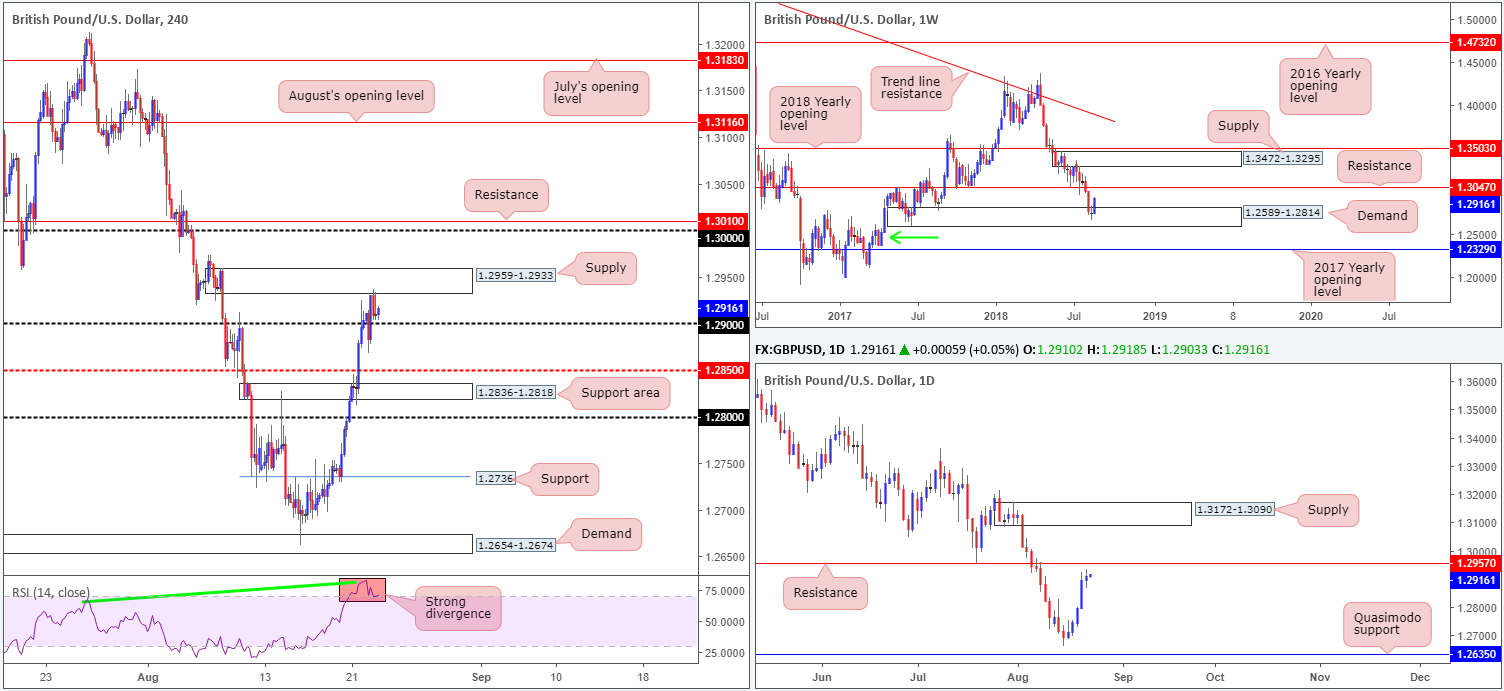
Alongside the euro, sterling was also firmer against its US counterpart on Wednesday, though remains somewhat subdued on Brexit-related news. 1.29, as you can see, put up little fight as resistance in recent movement, allowing the H4 candles to shake hands with nearby supply coming in at 1.2959-1.2933. As is evident from the chart, this area has capped upside thus far, though has yet to challenge 1.29 as support. Beyond the current supply, the 1.30 handle is in view, while below 1.29, mid-level support at 1.2850 is seen, shadowed closely by a support area at 1.2836-1.2818. Also worthy of note is the H4 RSI indicator is seen displaying a strong divergence/overbought reading.
From a technical standpoint on the higher timeframes, strong buying continues to be observed out of weekly demand at 1.2589-1.2814, poised to possibly advance further and test weekly resistance plotted at 1.3047. The story on the daily timeframe, nonetheless, places the candles within close proximity to resistance at 1.2957, which boasts a relatively sound history (check out the daily demand [now acting resistance area] formed around this region at 1.2905-1.2966 in early September 2017).
Areas of consideration:
The aforesaid H4 supply zone will likely continue holding price today, given it houses nearby daily resistance at 1.2957 within its upper limit. However, with weekly price flexing its bullish muscle, we do not expect much beyond 1.29 from this region. Therefore, trade with caution.
Eventually we are expecting the key figure 1.30 to re-enter the fight, and quite possibly the weekly resistance mentioned above at 1.3047. Between 1.3047/1.30 is certainly an area to keep on the watchlist for potential sells in this market in the near future.
Today’s data points: Jackson Hole symposium begins today.
AUD/USD:
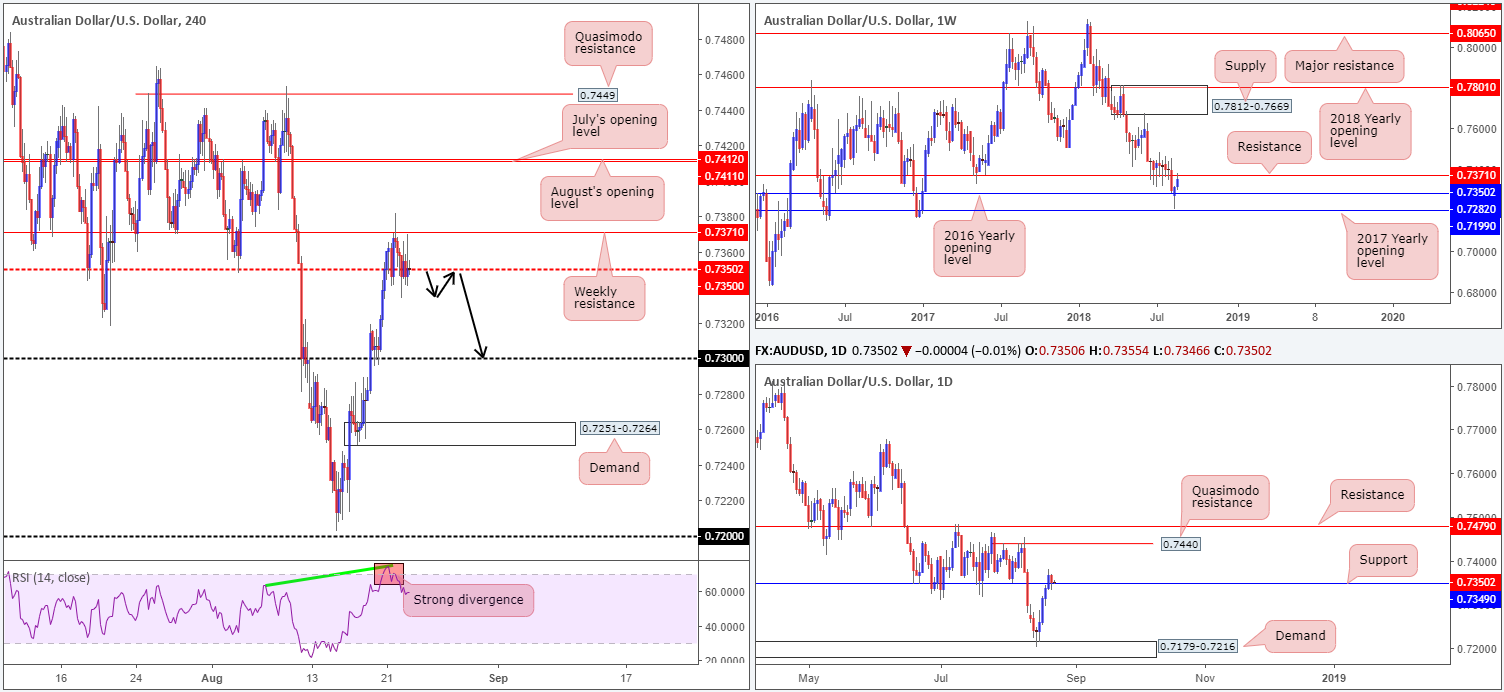
AUD/USD price is little changed this morning. The H4 candles, as is shown on the chart, spent the day flipping between gains and losses around H4 mid-level resistance at 0.7350, while capped by overhead weekly resistance plotted at 0.7371. Given this lackluster performance, much of the following report will resemble a similar outlook to yesterday’s analysis.
Starting at the top this morning, we can see weekly activity recently crossed swords with resistance at 0.7371. Besides this level holding strongly as support back in May 2017, it also proved a problematic support to overcome in June/July of this year. Therefore, this level should carry weight as resistance. With that being said, though, daily flow took out resistance at 0.7349 (now acting support) amid Tuesday’s trade this week, potentially freeing upside towards a Quasimodo resistance located at 0.7440.
Also worthy of note on the H4 timeframe is the RSI indicator, similar to the euro and pound, seen displaying a strong divergence/overbought reading. To our way of seeing things, should the market observe a decisive H4 close below H4 mid-level support at 0.7350, the 0.73 handle will likely be retested, and quite possibly the H4 demand beneath it at 0.7251-0.7264.
Areas of consideration:
A H4 close beneath 0.7350 that’s followed up with a successful retest (preferably in the shape of a full or near-full-bodied bearish candle) as resistance would, according to the overall technical picture, likely be enough to draw in sellers down to at least the 0.73 region. Therefore, do keep tabs on this market today, traders.
Today’s data points: Jackson Hole symposium begins today.
USD/JPY:
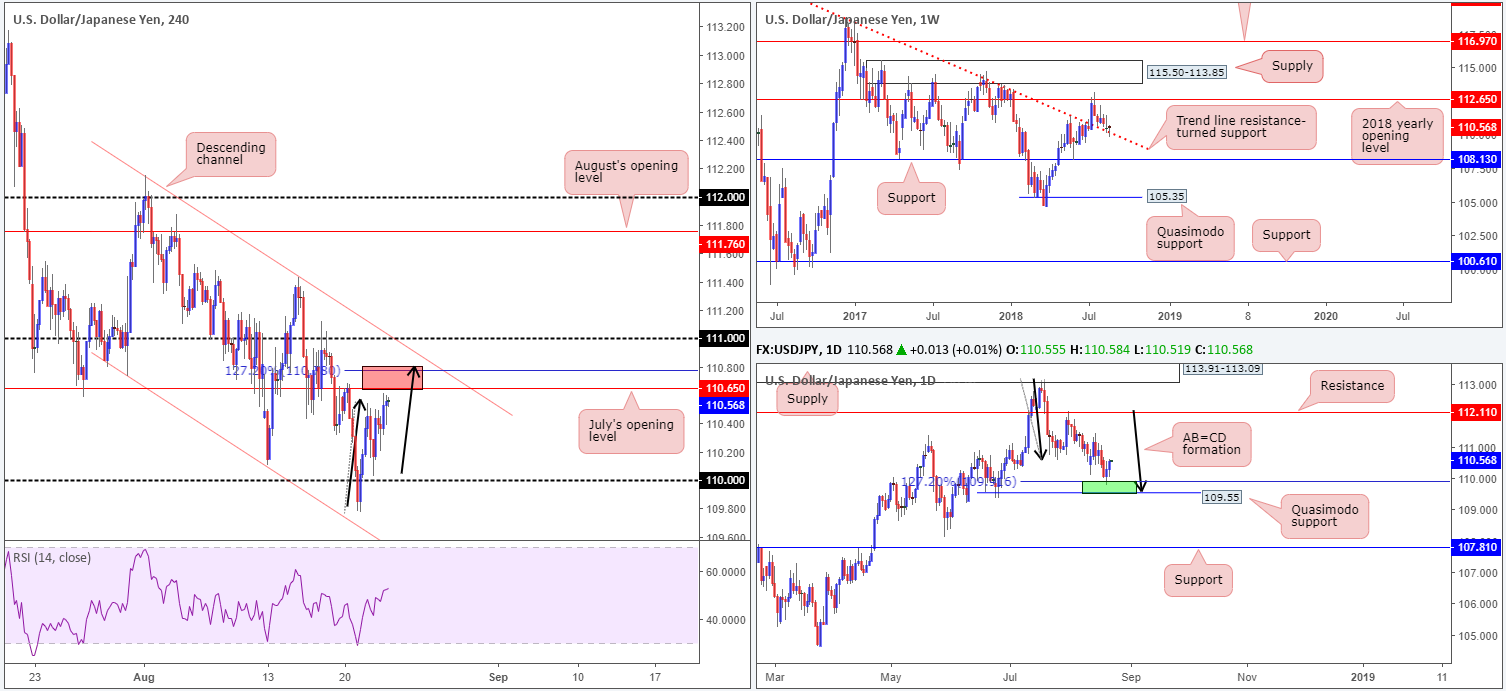
Leaving the 110 handle on the H4 timeframe unchallenged, USD/JPY bulls continued to build on Tuesday’s gains amid yesterday’s sessions. The pair wrapped up the day settling just south of July’s opening level at 110.65. Traders may have also noticed recent upside movement is in the shape of a H4 AB=CD (black arrows) formation that terminates around the 127.2% Fib ext. point at 110.78. Between 110.78 and 110.65 (red zone), therefore, is an area we may observe active selling.
On the other side of the spectrum, though, both weekly and daily price emphasize a bullish presence right now. Weekly movement, as you can see, remains toying with a trend line resistance-turned support (taken from the high 123.57). Having seen this line hold firm as resistance on a number of occasions in the past, it’s likely to remain a defensive barrier going forward. In conjunction with weekly flow, an AB=CD formation (black arrows) recently completed around the 127.2% Fib ext. point at 109.91, which happens to be positioned nearby a Quasimodo support at 109.55 (green area). The next obvious upside target on this scale does not come into view until resistance at 112.11.
Areas of consideration:
We’re sure most technicians will agree there’s a large portion of H4 wood to chop through before higher-timeframe buyers can push higher. Besides the 110.78/110.65 region highlighted above, H4 channel resistance (extended from the high 112.15) and the 111 handle could also hinder upside.
Therefore, to become buyers in this market, as the higher timeframes suggest, traders are urged to hold fire. Should H4 price cross back above 111, room to maneuver is then seen on all three timeframes. A retest to the top edge of 111 by way of a full or near-full-bodied H4 bull candle would be considered a strong bullish cue price is headed for higher ground, ultimately targeting 112.11: daily resistance, followed by weekly resistance at 112.65 (the 2018 yearly opening level).
Today’s data points: Jackson Hole symposium begins today.
USD/CAD:
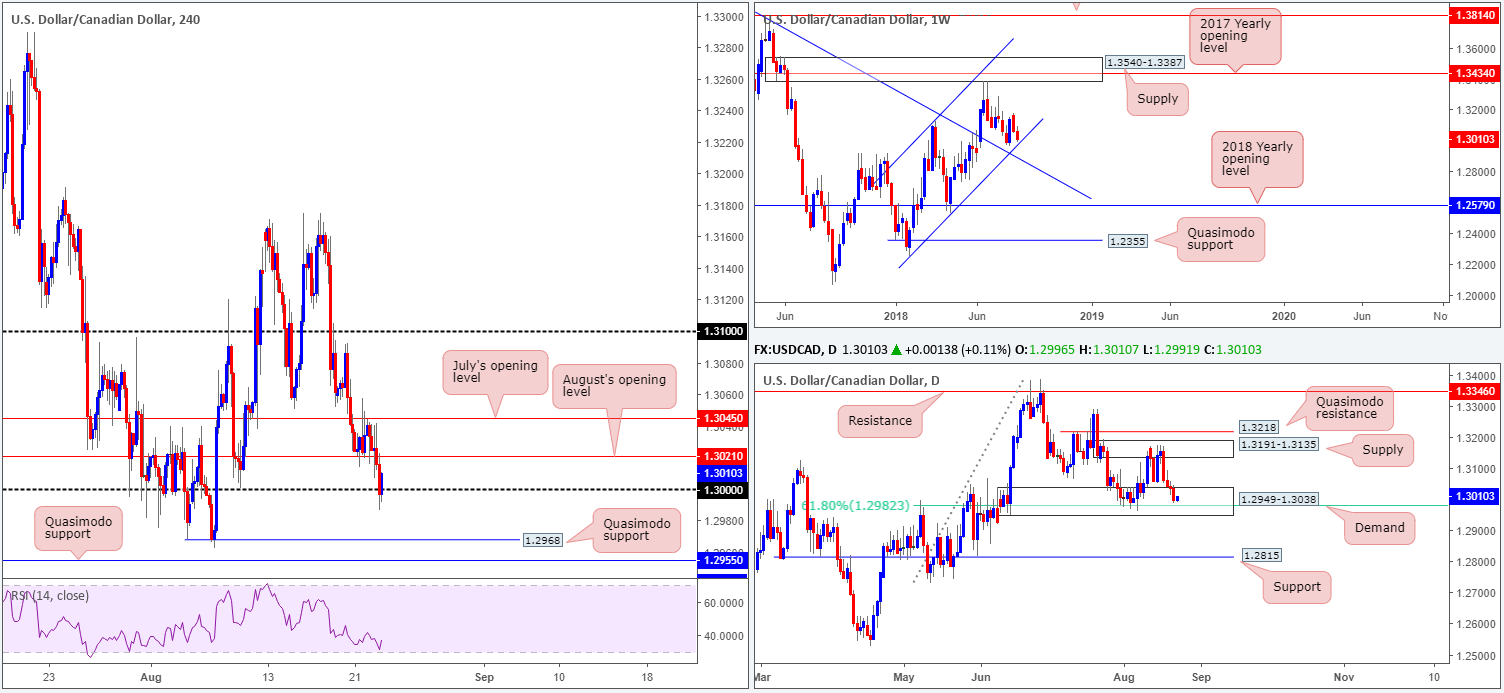
USD/CAD movement slumped to a weekly low of 1.2986 on Wednesday, bolstered by persistent USD selling and a strong oil market. Although H4 action ripped through stop-loss orders beneath the key figure 1.30 yesterday, the base remains in the fight, though could struggle around August’s opening level seen nearby at 1.3021.
Below 1.30, two H4 Quasimodo supports are seen at 1.2968 and 1.2955. On the daily scale, buyers and sellers continue to battle for position within the walls of a demand zone drawn from 1.2949-1.3038. The other key thing to note here is the nearby 61.8% Fib support at 1.2982. In terms of weekly movement, nevertheless, channel support (extended from the low 1.2247) is seen close by: a line that’s supported upside since the beginning of the year!
Areas of consideration:
The threat of a move lower on the weekly timeframe to bring in the channel support (around 1.2976), along with the possibility of a move south to test the daily 61.8% Fib support at 1.2982, as well as nearby resistances seen on the H4 timeframe (August’s opening level at 1.3021 and July’s opening level at 1.3045), makes buying this market tricky.
Ultimately, the H4 Quasimodo support at 1.2968 is attractive for a buy, with stop-loss orders planted below the other nearby H4 Quasimodo support (1.2955) at 1.2947, simultaneously clearing the lower edge of daily demand (1.2949).
Should H4 price continue to advance following the breach of 1.30, however, longs are of interest beyond 1.3045 (preferably on the retest of this level in the form of a full or near-full-bodied H4 bull candle – stops best positioned beyond the candle’s tail), targeting 1.31, followed by daily supply at 1.3191-1.3135 (the next upside target on the daily timeframe).
Today’s data points: Jackson Hole symposium begins today.
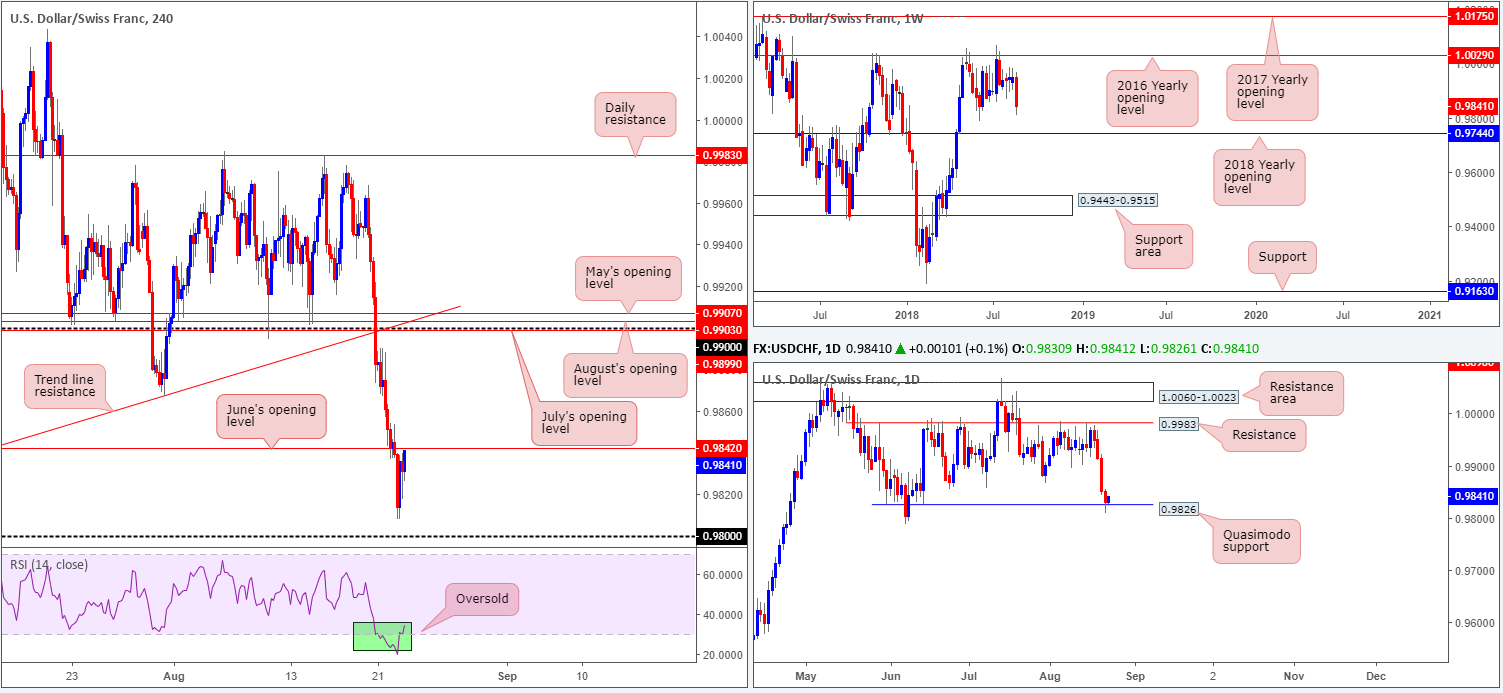
USD/CHF:
In recent trade, the US dollar staged a modest recovery just north of the 0.98 handle, fast approaching the underside of June’s opening level seen on the H4 timeframe at 0.9842. Although this move is bolstered by broad-based USD buying and a daily Quasimodo support at 0.9826, weekly price exhibits space to probe lower: June’s low 0.9788, followed by the 2018 yearly opening level at 0.9744
Areas of consideration:
A H4 close above June’s opening level at 0.9842 would, technically speaking, help confirm buyer intent from the aforementioned daily Quasimodo support. Even better would be for H4 price to retest 0.9842 as support in the mold of a full or near-full-bodied bull candle, as this then presents a high-probability buying opportunity, ultimately targeting the 0.99 region and its collection of monthly opening levels.
A rejection off 0.9482, nonetheless, has yesterday’s low 0.9808 to target, shadowed closely by the 0.98 handle.
Today’s data points: Jackson Hole symposium begins today.
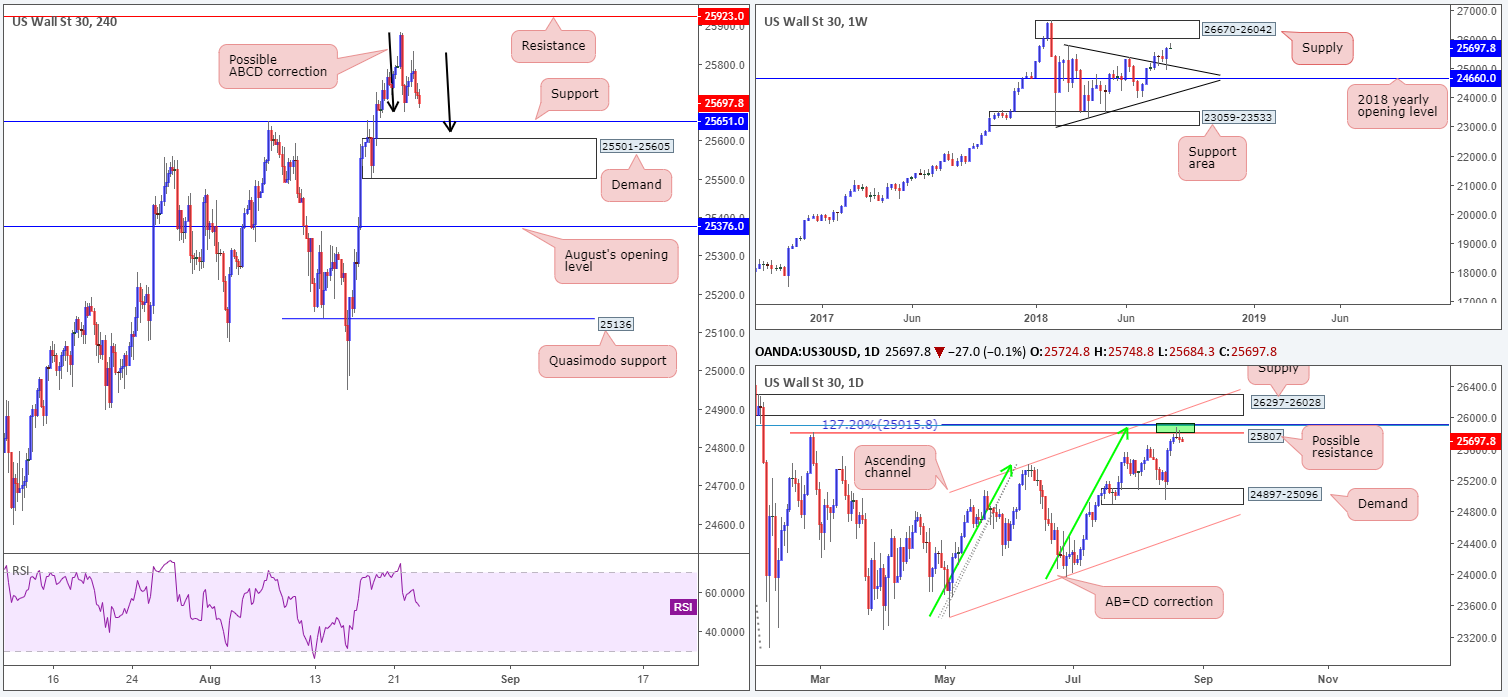
Dow Jones Industrial Average:
Amid the FOMC voicing concern regarding trade policy, along with trade tariffs that come into effect this week, it was another mixed day for the Dow Jones on Wednesday. Given this somewhat lackluster performance, the technical picture remains unchanged.
H4 price, as you can see, remains capped ahead of resistance at 25923. From a technical perspective, we believe this to be a result of a small area of confluence on the daily timeframe at 25915/25807 (green zone). Comprised of a resistance level at 25807 (Feb 27 high), a 127.2% AB=CD (green arrows) correction point at 25915 and a 78.6% Fib resistance at 25904, this zone, as you can see, has held ground in the shape of two bearish pin-bar formations.
While yesterday’s daily bearish candle may excite candlestick traders, H4 support at 25651, followed closely by demand at 25501-25605 (which happens to align closely with a H4 ABCD completion at 25624) could hamper downside.
Also worth highlighting is weekly action showing room to press as far north as supply coming in at 26670-26042, following a strong retest off a trend line resistance-turned support (etched from the high 25807) last week.
Areas of consideration:
In regards to selling this market at current price based on the daily bearish pin-bar formation, traders should expect active buying to come into the market from the aforementioned H4 structures. Waiting for August’s opening level on the H4 timeframe at 25376 to be engulfed is likely the safer (more conservative) route to take. Trade will then be free to challenge the H4 Quasimodo support at 25136.
The H4 resistance mentioned above at 25923 is also still an area worth watching for shorts. Positioned between the daily area of (green) confluence and supply at 26297-26028, a response from this angle is likely. Yet, do not go into this full throttle! There’s a chance this level could break as the index may want to test the underside of the aforementioned daily supply or even bring the market towards weekly supply at 26670-26042. For that reason, tread carefully!
Today’s data points: Jackson Hole symposium begins today.
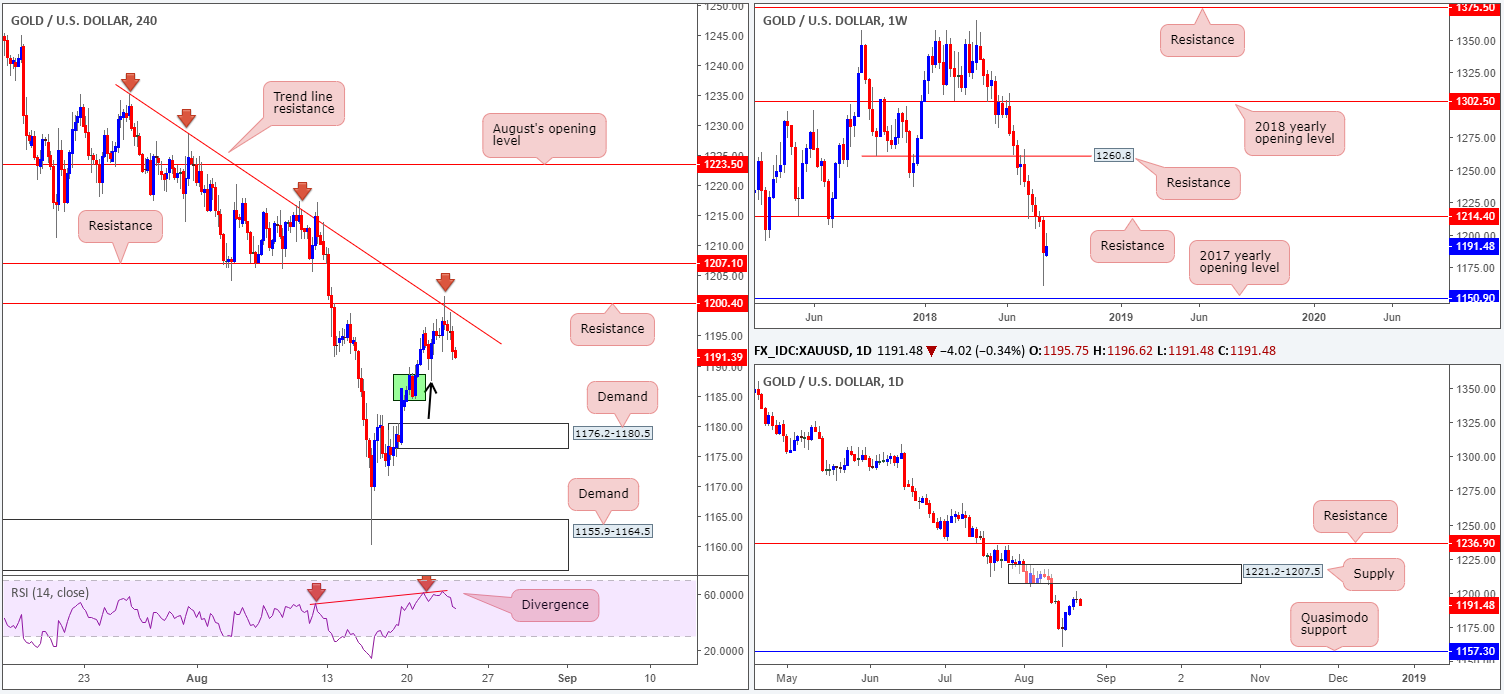
XAU/USD (Gold)
XAU/USD bulls swiftly lost their flavor on Wednesday as H4 price shook hands with resistance at 1200.4. Not only did this resistance merge beautifully with trend line resistance (etched from the high 1235.2), the RSI indicator displayed a divergence reading. Looking at H4 candle structure going forward, downside appears reasonably free to stretch lower. The H4 demand marked in green at 1184.4-1188.5 has likely had the majority of its buyers picked up on the consumption tail seen marked with a black arrow at 1187.4. The next fresh base of demand can be seen at 1176.2-1180.5.
Both weekly and daily activity is seen trading in no man’s land in terms of structure. Weekly price is currently loitering between resistance at 1214.4 and the 2017 yearly opening level at 1150.9. On the daily timeframe, however, supply is seen at 1221.2-1207.5 (encases the current weekly resistance) along with a Quasimodo support at 1157.3.
Areas of consideration:
Although H4 price action indicates further selling may be on the horizon, there’s little structure offering a base to short from at current price. The only alternative, as far as we can see, is to wait and see if H4 price pulls back and retests the H4 resistance at 1200.4 in the shape of a full or near-full-bodied bearish candle. One is then free to position stops above the wick of the rejecting candle, targeting the H4 demand mentioned above at 1176.2-1180.5 as the initial port of call.
The use of the site is agreement that the site is for informational and educational purposes only and does not constitute advice in any form in the furtherance of any trade or trading decisions.
The accuracy, completeness and timeliness of the information contained on this site cannot be guaranteed. IC Markets does not warranty, guarantee or make any representations, or assume any liability with regard to financial results based on the use of the information in the site.
News, views, opinions, recommendations and other information obtained from sources outside of www.icmarkets.com.au, used in this site are believed to be reliable, but we cannot guarantee their accuracy or completeness. All such information is subject to change at any time without notice. IC Markets assumes no responsibility for the content of any linked site. The fact that such links may exist does not indicate approval or endorsement of any material contained on any linked site.
IC Markets is not liable for any harm caused by the transmission, through accessing the services or information on this site, of a computer virus, or other computer code or programming device that might be used to access, delete, damage, disable, disrupt or otherwise impede in any manner, the operation of the site or of any user’s software, hardware, data or property.


