
Key risk events today:
Eurozone Flash Manufacturing/Services PMIs; UK Flash Manufacturing/Services PMIs; US Unemployment Claims; US Flash Manufacturing/Services PMIs.
EUR/USD:
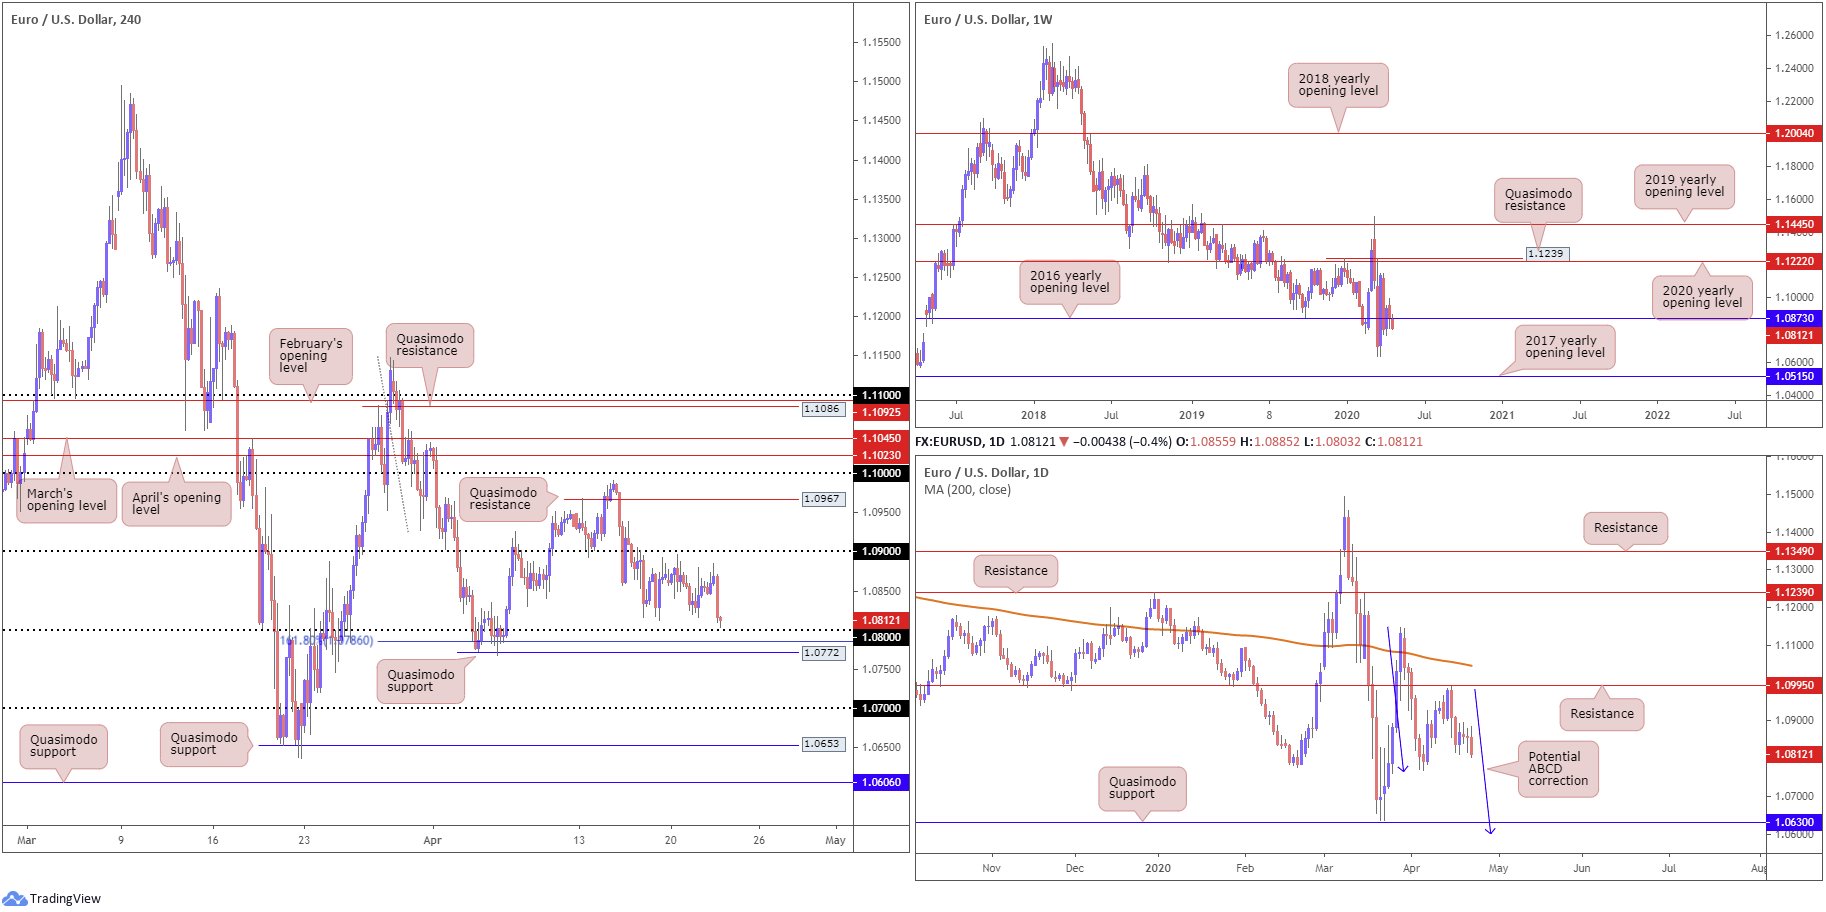
The US dollar index retained its underlying bid Wednesday, establishing a reasonably firm position north of 100.00. EUR/USD found thin air south of 1.09 into US hours and retreated sub 1.0850, with (technical) eyes likely fixed on the 1.08 handle as feasible support going forward, reinforced closely by a 161.8% Fibonacci extension point at 1.0786 and Quasimodo support at 1.0772 on the H4 timeframe.
Further afield, action based on the weekly timeframe reveals the pair exploring ground south of its 2016 yearly opening level at 1.0873. To the downside, multi-year lows at 1.0635 are in view, with follow-through moves shining the spotlight on the 2017 yearly opening level at 1.0515. The story on the daily timeframe shows price action chalked up a bearish outside day pattern yesterday, closing not too far off session lows. Continued downside could have the 1.0768 April 6 low come into existence. Beyond here, Quasimodo support at 1.0630 is also a viable floor, closely tracked by a potential ABCD correction (blue arrows) at 1.0597.
Areas of consideration:
1.08, given its close connection with a 161.8% Fibonacci extension point at 1.0786 and Quasimodo support at 1.0772, could prompt an intraday rebound if brought into play today. Conservative traders may seek additional candlestick confirmation prior to pulling the trigger, however, as not only are round numbers prone to whipsaws, the H4 area between 1.0772/1.08 houses limited higher-timeframe support.
In the event we conquer 1.0768 (the April 6 low mentioned above on the daily timeframe), the pathway south on the H4 appears clear for a run to 1.07, potentially unlocking the door for bearish scenarios.
GBP/USD:
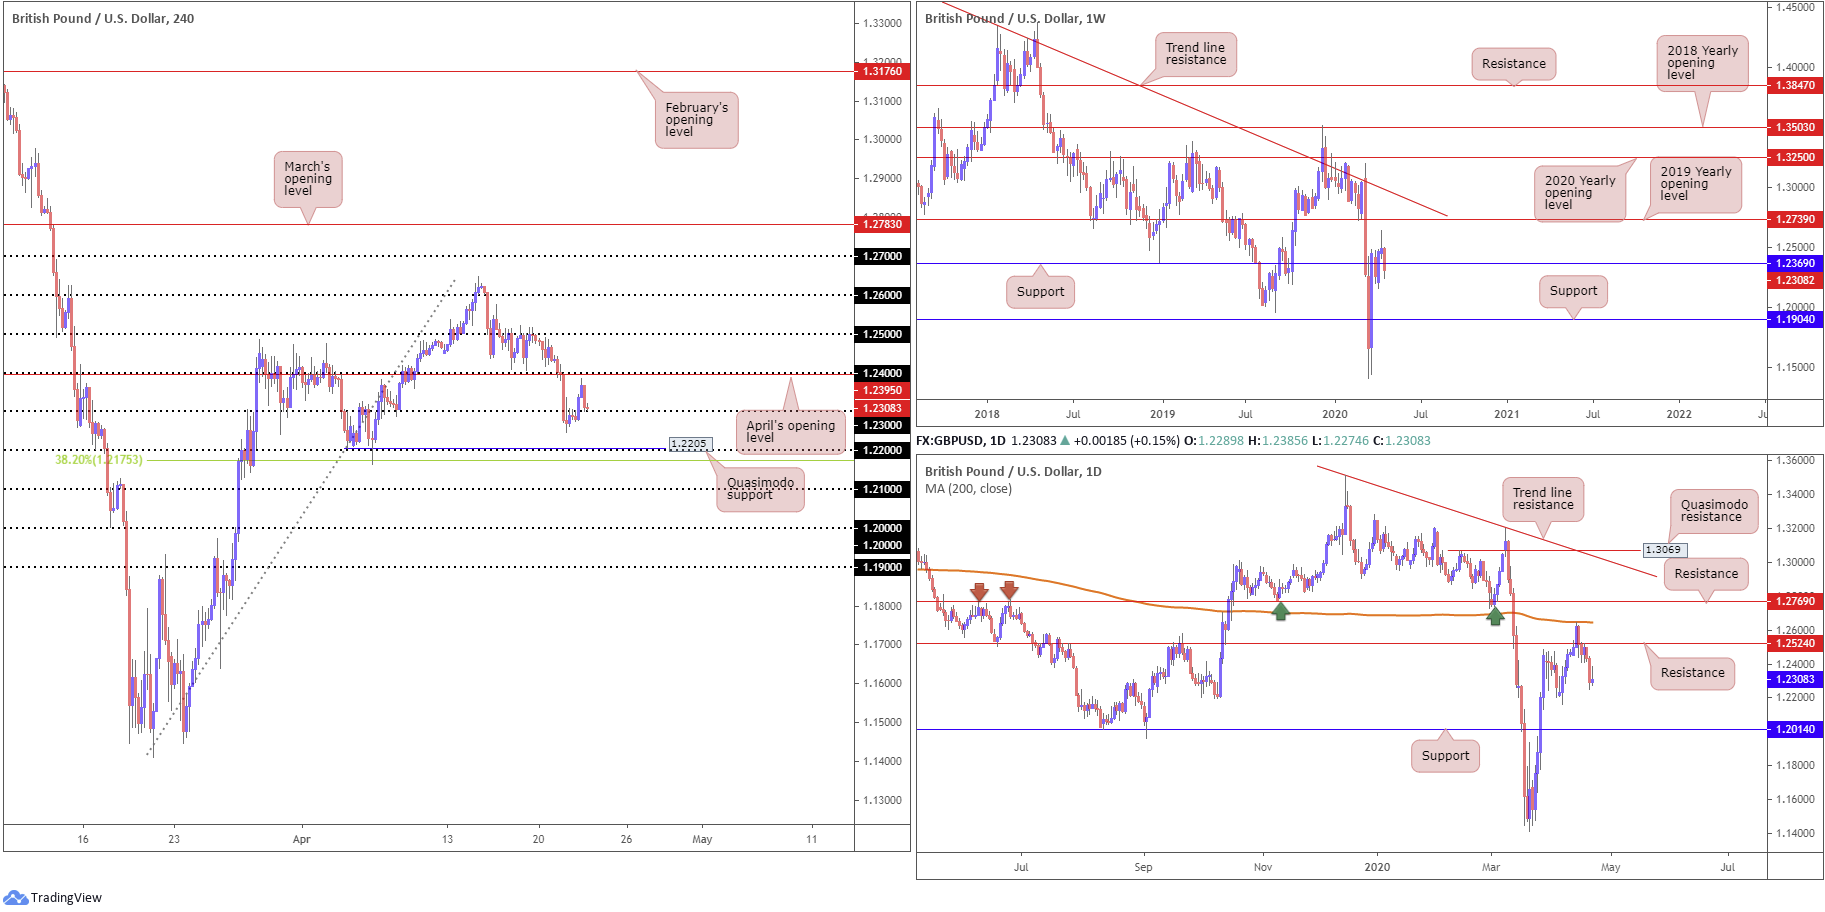
The British pound staged an impressive comeback off Tuesday’s lows in early trade Wednesday, though topped ahead of 1.24 vs. its US counterpart as the US dollar index registered its third consecutive daily gain. Despite the day’s oscillations, we closed Wednesday not far off Tuesday’s close at 1.2289.
The view from the H4 timeframe shows price movement testing the mettle of 1.23, which if a notable rejection comes to pass, April’s opening level at 1.2395 and the 1.24 handle offer the next layer of obvious resistance. A break of 1.23 to the downside will immediately light up Tuesday’s low at 1.2247 and quite possibly Quasimodo support at 1.2205, fixed a few points north of 1.22 and a 38.2% Fibonacci retracement ratio at 1.1753.
On more of a broader perspective, weekly price crossed below support at 1.2369 following a clear-cut shooting star pattern formed the week prior, targeting support at 1.1904. While sellers may not have the fire power to reach this far south this week, it’s certainly a support worthy of the watchlist.
After retesting the underside of resistance on the daily timeframe at 1.2524 and closing mostly unmoved Wednesday, focus remains on the 1.2163 April 7 low as the next viable support on this chart, followed by support at 1.2014.
Areas of consideration:
Having noted weekly price overrunning support at 1.2369 and daily price eyeing the 1.2163 April 7 low, it’s unlikely the 1.23 handle based on the H4 timeframe holds much enthusiasm. As a result, a H4 close sub 1.23 may spark breakout selling, either on the breakout candle’s close or on any retest seen at 1.23 as resistance. The latter is likely the more favoured approach among conservative traders; it helps avoid whipsaws which are common around psychological levels.
AUD/USD:
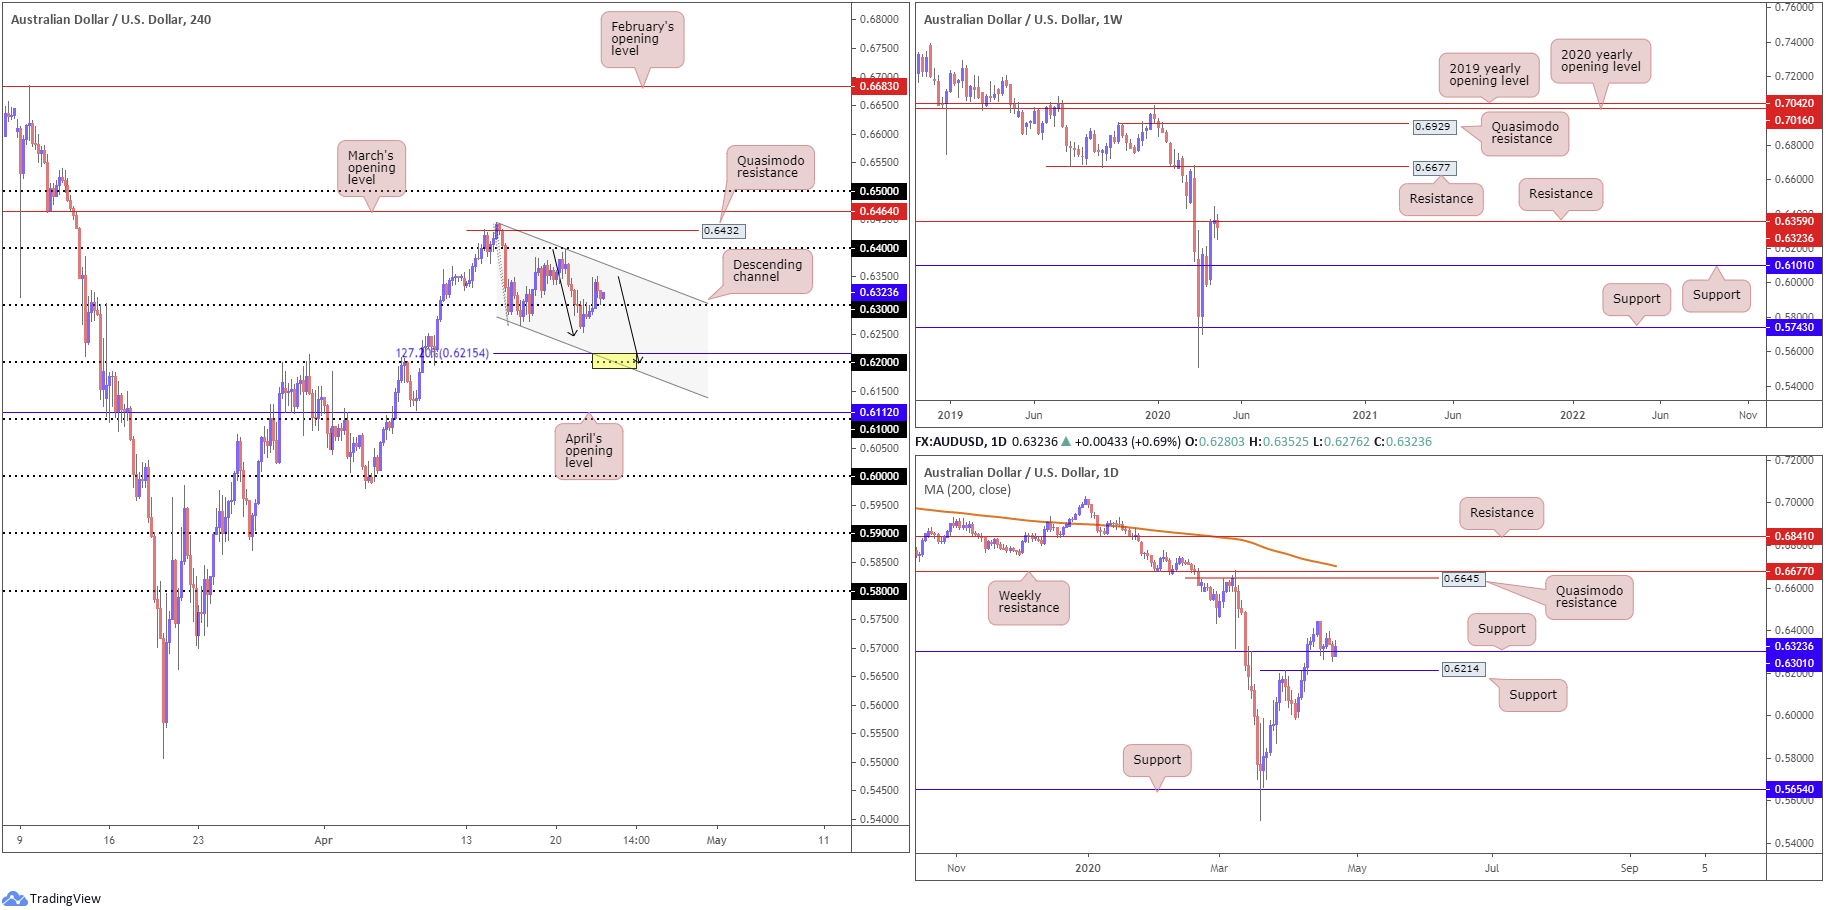
Market sentiment improved Wednesday with European and US equity markets closing higher across the board. Bolstered on the back of risk-on flows as well as retail turnover in Australia for March rising sharply higher, the AUD/USD wrapped up trade in positive territory.
Technically, the H4 candles firmed above 0.63 with price action currently poised to retest the figure. Overall, we can still see the pair remains compressing within a descending channel pattern (0.6444/0.6264). What’s also notable from a technical perspective is a possible 127.2% ABCD correction (black arrows) may terminate just ahead of 0.62, intersecting closely with channel support (yellow).
Price action, based on the weekly timeframe, is seen languishing south of resistance at 0.6359, threatening the possibility of retesting support priced in at 0.6101. The daily timeframe has the unit engaging with support at 0.6301, with buyers not doing much to turn the dial thus far. This suggests scope for a run to nearby support from 0.6214.
Areas of consideration:
0.62 remains an area of interest in this market as possible support. The combination of this psychological number, the 127.2% ABCD correction at 0.6215, H4 channel support and daily support from 0.6214 is likely to appeal to buyers (yellow).
Another possibility is sellers making a showing should we break through 0.63 to the downside, targeting 0.62.
Although unlikely to make an appearance today, albeit still a worthy contender as resistance, the H4 Quasimodo formation at 0.6432 is interesting, having seen it positioned above 0.64 (buy-stop liquidity north of 0.64 could fuel sellers off 0.6432).
USD/JPY:
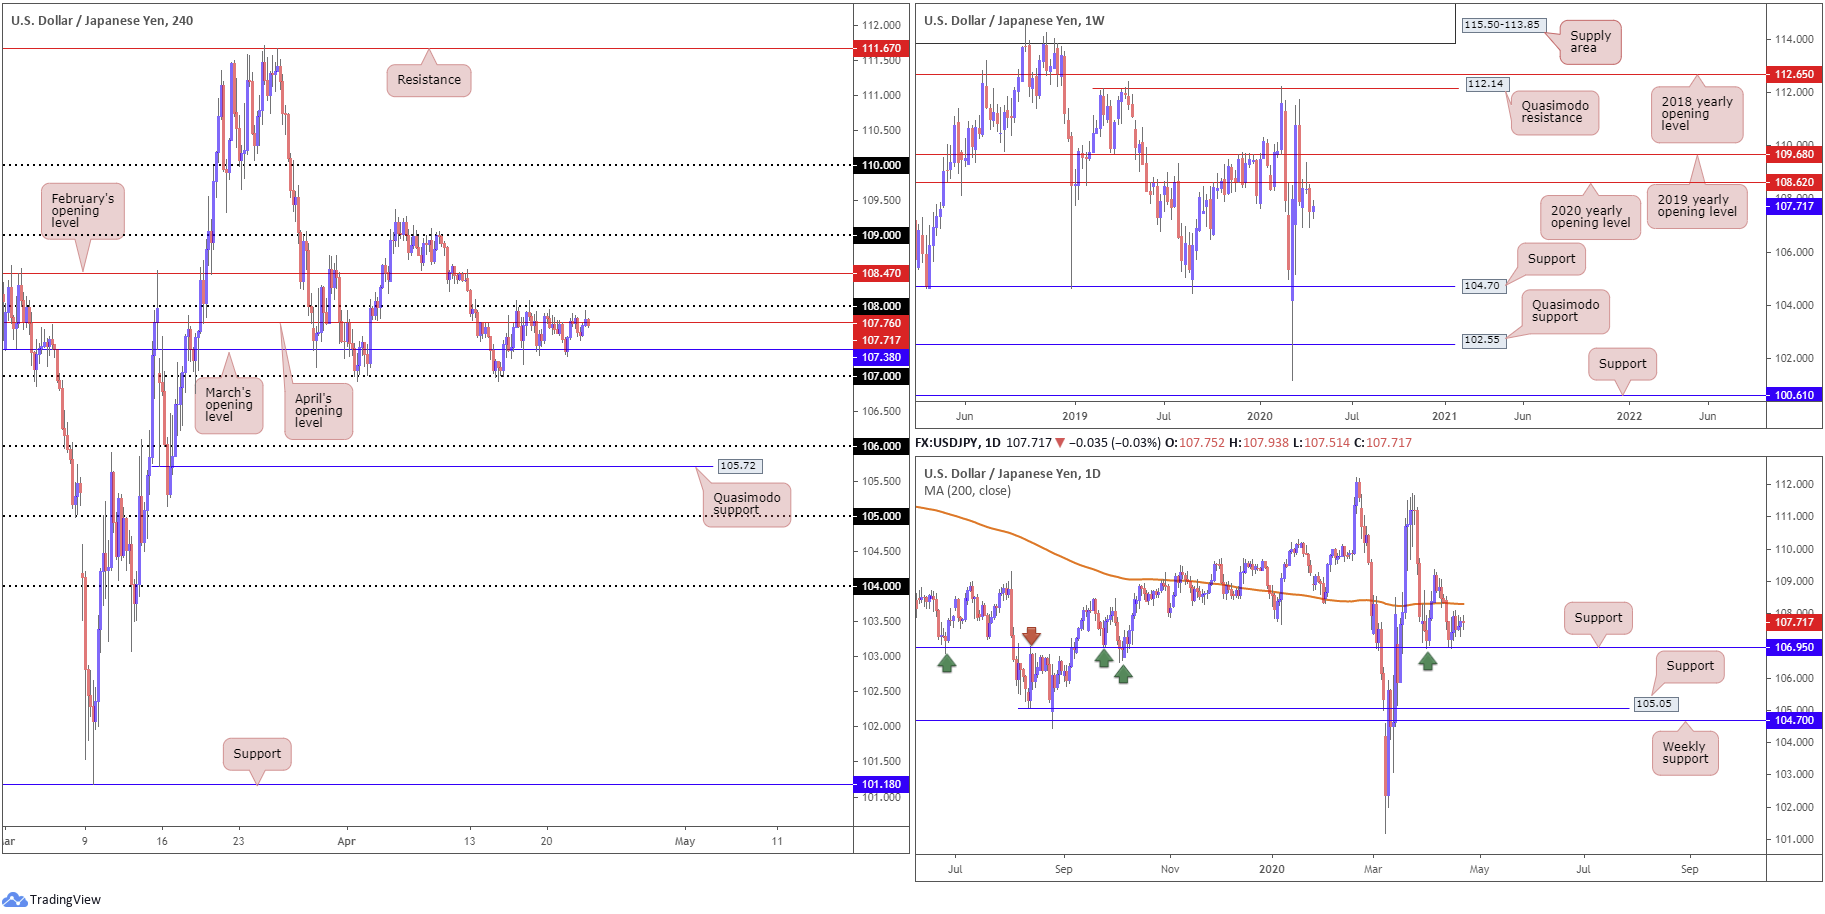
Risk-flows dominated markets Wednesday, with the US dollar index gathering traction above 100.00 and US Treasury yields putting in a healthy recovery. USD/JPY, nonetheless, remained entrenched within its H4 range between the 108 handle and March’s opening level at 107.38 (note in between this range we also have April’s opening level at 107.76 present). 107 is seen as viable support outside of the consolidation, along with February’s opening level at 108.47 as resistance.
The vibe on the weekly timeframe continues to represent a bearish tone. Price action recently produced a clear-cut shooting star candlestick configuration off the 2020 yearly opening level at 108.62, with last week putting in a strong follow-through move to the downside to lows of 106.92. The next support target is not seen until 104.70. Note this figure also represents the lower boundary of a multi-month range between Quasimodo resistance at 112.14.
Daily support at 106.95 made an appearance mid-week and held ground last week. The 200-day SMA (orange – 108.30) stands as possible resistance, whereas a break through 106.95 could land the 105.05 support in the mix, followed by weekly support highlighted above at 104.70.
Areas of consideration:
Outlook unchanged due to the lacklustre performance of late.
Traders may wish to acknowledge 107 aligns closely with daily support at 106.95, while February’s opening level at 108.47 comes in closely with the 200-day SMA at 108.30.
Weekly price suggesting lower levels certainly places a question mark on further gains above 108, though if we’re able to reach 108.47, active sellers are likely to enter the fray. The combination of daily support at 106.95 and 107 could also spark a reaction if tested.
USD/CAD:
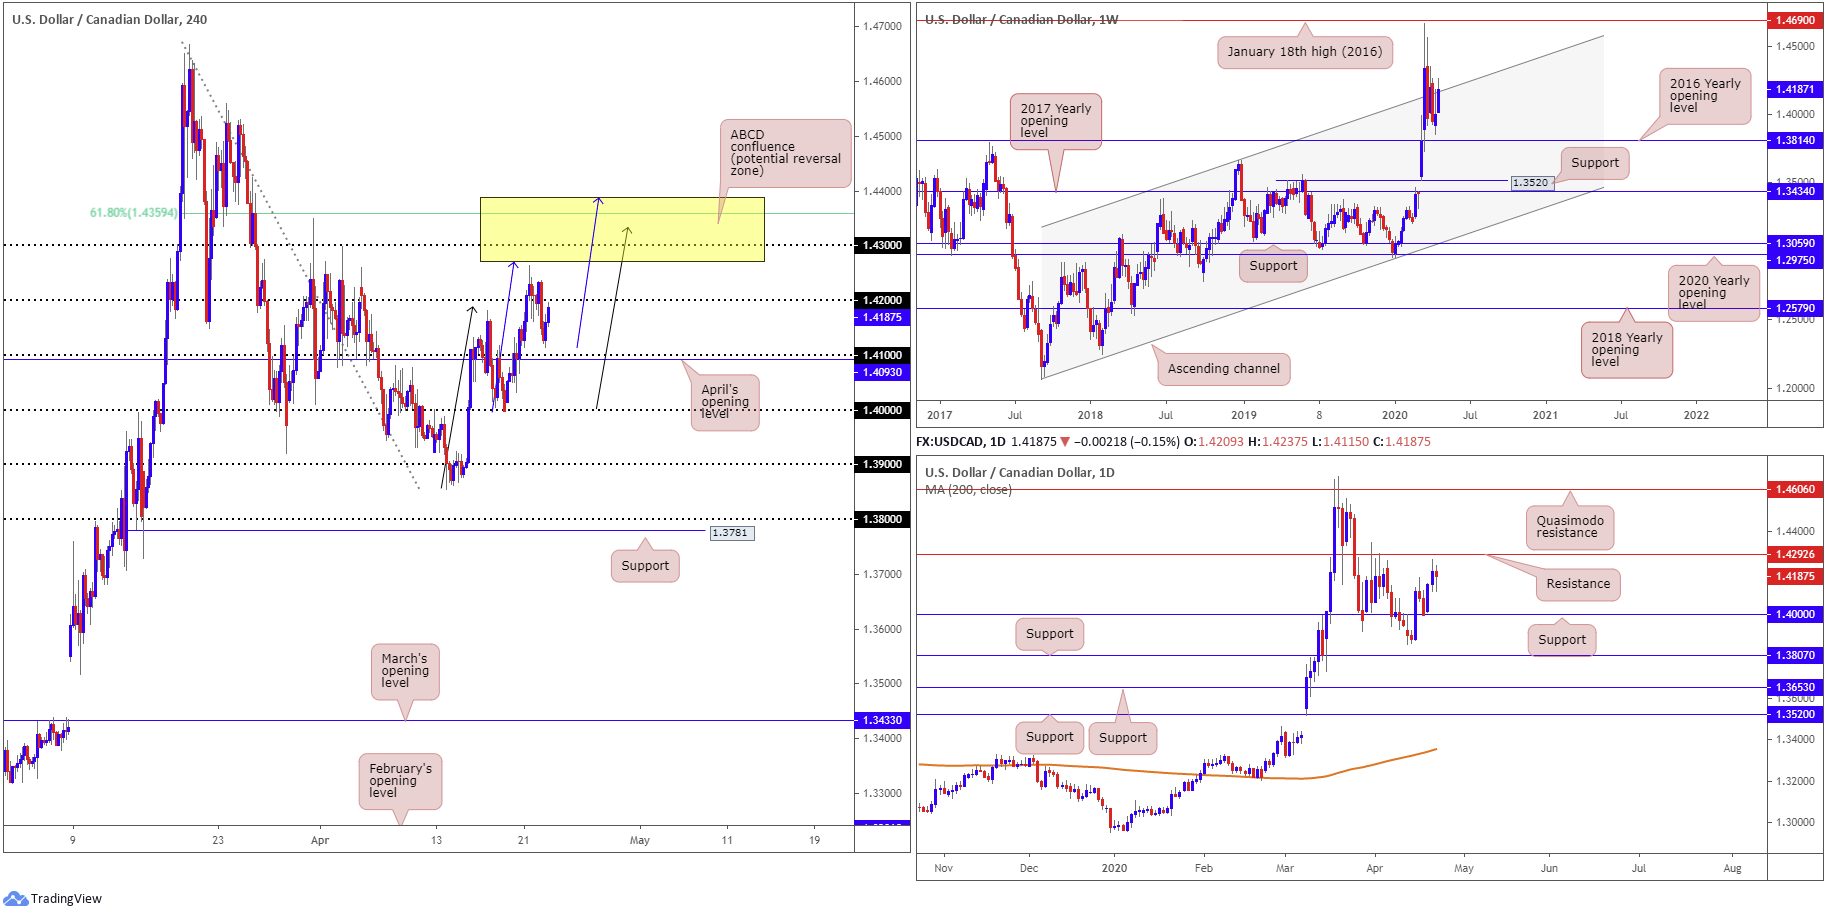
According to Statistics Canada, the Consumer Price Index (CPI) rose 0.9% on a year-over-year basis in March, down from a 2.2% gain in February. The report triggered modest selling to lows of 1.4115, though price swiftly reclaimed earlier losses and made a run back up to just under 1.42.
In the event we cross above 1.42 on the H4 scale, an interesting area of resistance made up of a 61.8% Fibonacci retracement at 1.4359, the 1.43 handle and two ABCD patterns at 1.4388 (blue arrows) and at 1.4335 (black arrows) is in sight.
Over on the weekly timeframe, price is seen engaging with a long-term channel resistance, extended from the high 1.3661. This follows a near-test of the 2016 yearly opening level at 1.3814 the week prior. Coming from the daily timeframe, we can see the couple came within striking distance of resistance at 1.4292 before rotating southbound. Support on the daily timeframe remains around 1.4000.
Areas of consideration:
Technically, there’s still a chance we may connect with 1.4388/1.43 on the H4 timeframe today which may offer possible shorting opportunities, given its local confluence and close relationship with daily resistance at 1.4292.
USD/CHF:
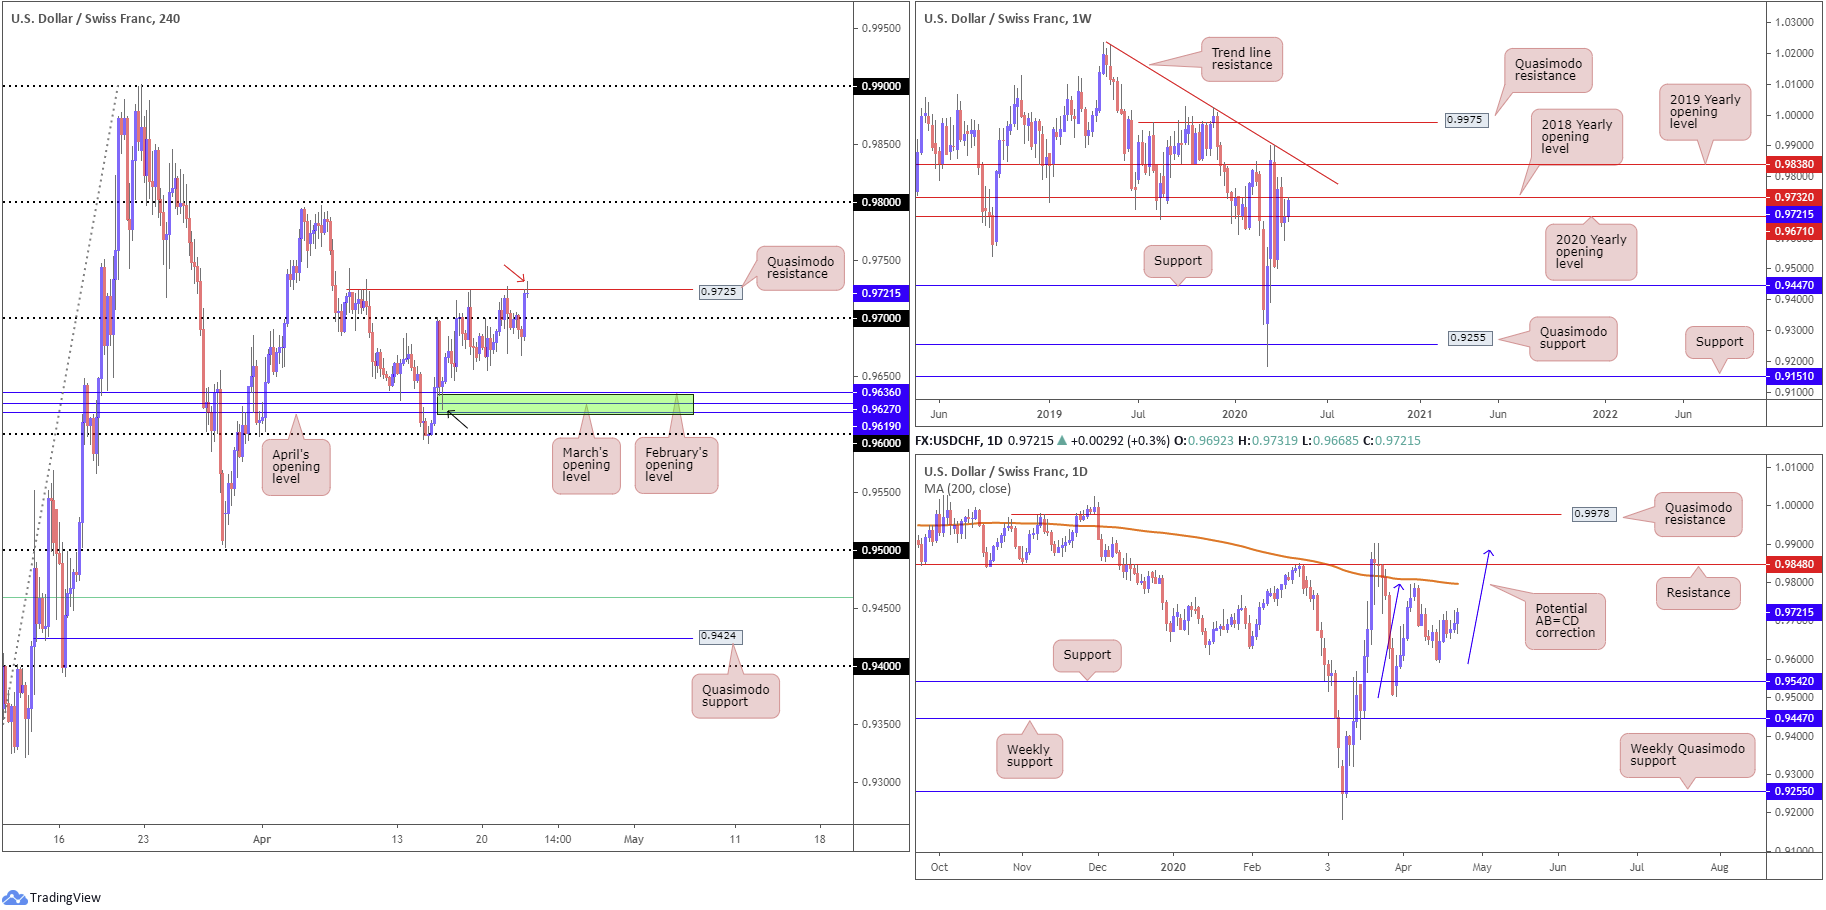
Upbeat market sentiment along with a moderately bullish greenback recently saw the H4 candles pursue ground above 0.97 and reconnect with a Quasimodo resistance priced in at 0.9725. As of current price, as you can see, the action is forming what appears to be a shooting star candlestick pattern (bearish signal – red arrow).
Note upon exploring higher ground above 0.97, price action shook hands with the 2018 yearly opening level at 0.9732 on the weekly timeframe. Traders will also likely acknowledge that beneath current price on the weekly chart, the 2020 yearly opening level at 0.9671 resides close by.
The daily timeframe, as of the current close, offers little in terms of support or resistance. To the upside, resistance is unlikely to emerge until reaching the 200-day SMA (orange – 0.9796), accompanied by 0.9848 and a potential AB=CD correction (blue arrows) at 0.9886. Lower on the curve we have support priced in at 0.9542, situated just ahead of weekly support at 0.9447.
Areas of consideration:
With H4 Quasimodo resistance at 0.9725 in the spotlight and weekly price recently touching gloves with its 2018 yearly opening level at 0.9732, sellers may look to make an appearance today and close things beneath 0.97. Conservative traders may wait and see if H4 price closes south of 0.97 before committing as this would likely serve as bearish intent. The next downside target beneath the said round number can be seen at a H4 support zone from 0.9619/0.9636 (green), an area made up of April, March and February’s opening levels.
Dow Jones Industrial Average:
Global equities rebounded Wednesday as investors gathered confidence from steadying oil markets and modest earnings. The Dow Jones Industrial Average added 456.94 points, or 1.99%; the S&P 500 also added 62.75 points, or 2.29%, and the tech-heavy Nasdaq 100 concluded higher by 261.63 points, or 3.11%.
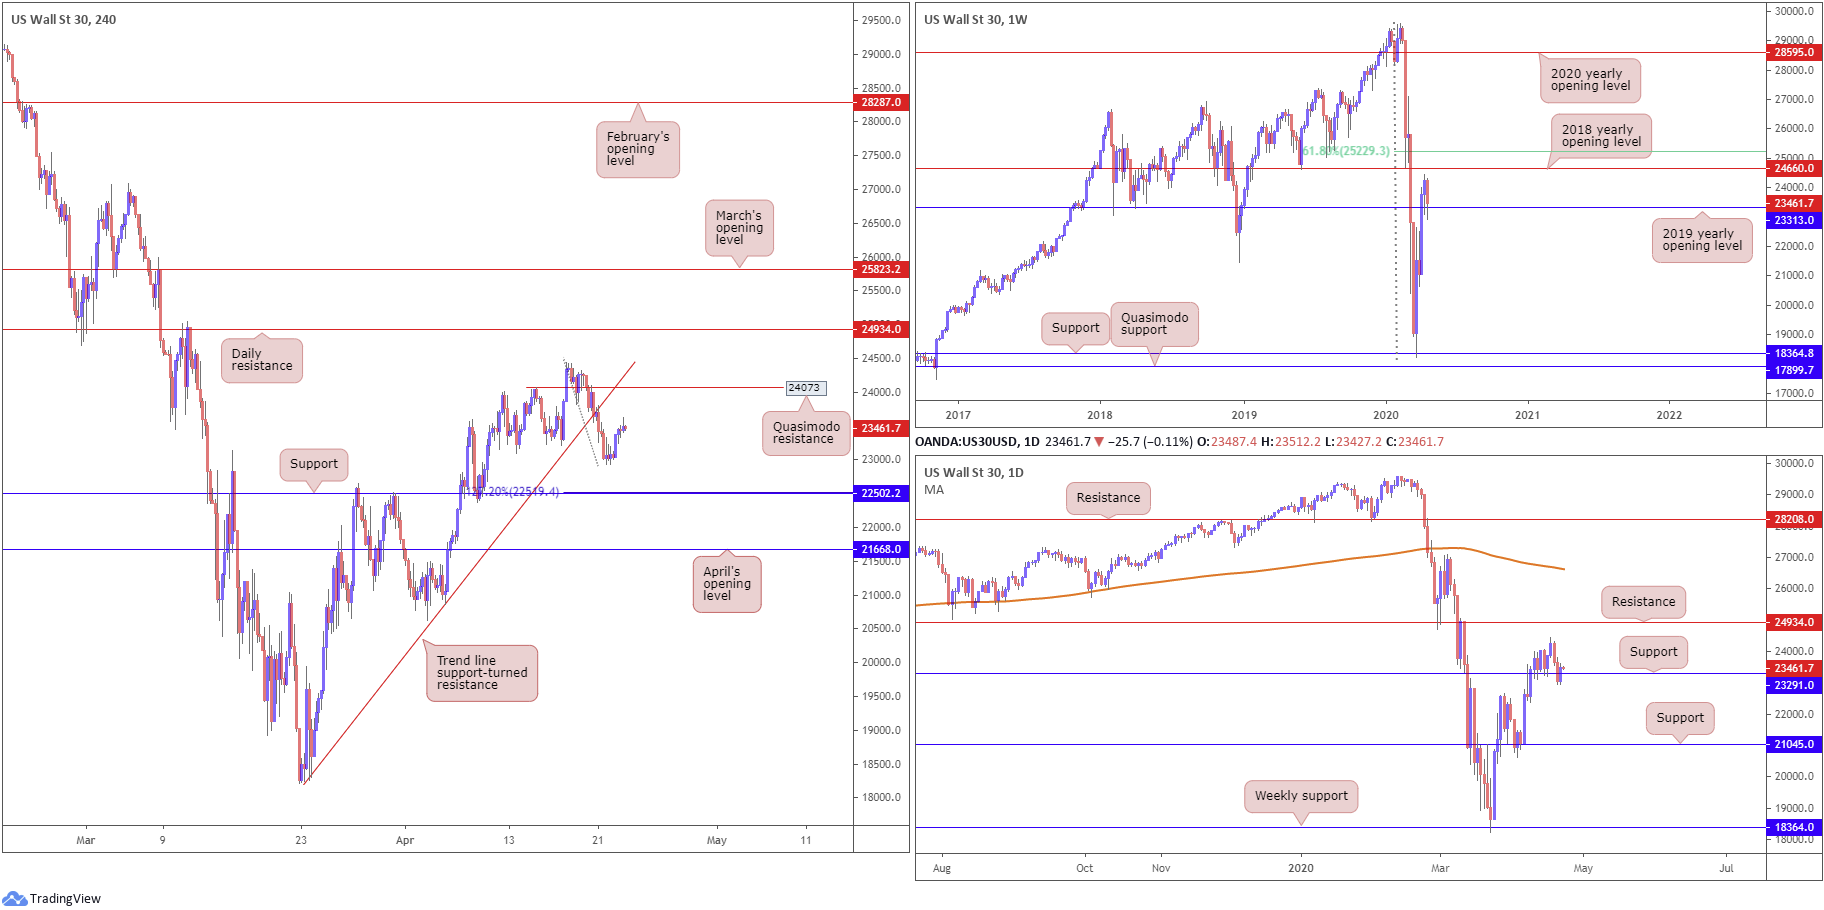
From the weekly timeframe, support by way of the 2019 yearly opening level at 23313 is in play. While it is far too early to tell if we’ll see anything meaningful to the upside from here, traders are urged to pencil in the 2018 yearly opening level at 24660 as potential resistance. South of 23313, however, research reveals limited support until reaching 18364.
A closer reading of price action on the daily timeframe shows support at 23291 entered the mix in recent trading, with buyers snapping a two-day bearish phase. Resistance may emerge off the 24442 April 17 high, with a break exposing resistance priced in at 24934.
Across the page on the H4 timeframe, after tripping sell-stops beneath the 23090 April 13 low, the candles put in a reasonably healthy recovery, consequently shifting focus to a Quasimodo resistance at 24073 and nearby trend line support-turned resistance, extended from the low 18235. Downside support can be found at 22502, with a breach underlining the possibility of a run to April’s opening level at 21668.
Areas of consideration:
Chart studies suggest we’re likely to bring in H4 Quasimodo resistance at 24073. Aside from the H4 trend line resistance noted above, however, there’s limited confluence supporting this base, which could lead to a move towards weekly resistance (2018 opening level) at 24660, followed by daily resistance at 24934, forming.
Therefore, moves above 24073 will likely be viewed as a solid breakout signal.
Another level worthy of attention is H4 support at 22502. Although limited higher-timeframe confluence is seen here, we do have a 127.2% Fibonacci extension converging at 22519.
XAU/USD (GOLD):
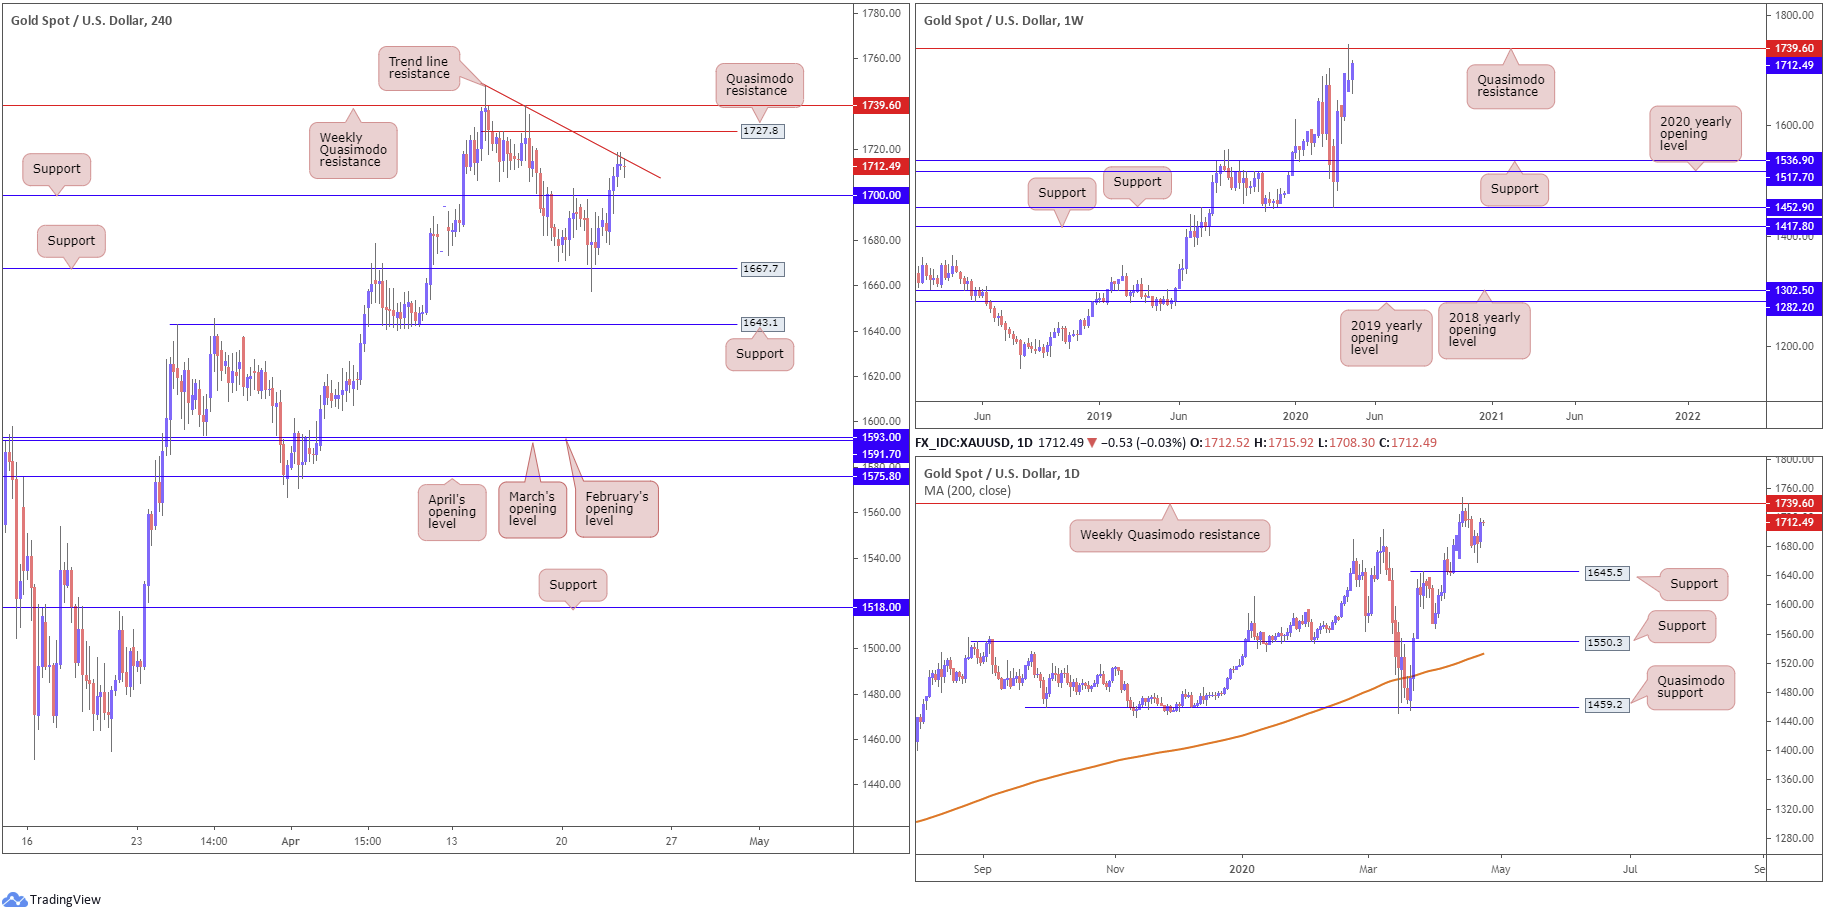
Demand for the yellow metal increased Wednesday, reaching highs at 1718.7, forming a near-full-bodied bullish candle. H4 resistance at 1700.0 was taken amid yesterday’s advance (now a serving support), drawing bullion towards a local H4 trend line resistance, taken from the high 1747.7. North of here we have a H4 Quasimodo resistance at 1727.8, followed by weekly Quasimodo resistance at 1739.6.
Support in this market, aside from 1700.0, can be seen at 1667.7 and 1643.1 on the H4, while on the daily timeframe, we have 1645.5 in sight.
Areas of consideration:
Weekly price bringing in Quasimodo resistance and forming a strong bearish candlestick signal last week (hammer pattern) appears to have been overlooked thus far, with the week notching gains of 1.70% as we write.
Despite the clear uptrend, entering long in this market is chancy right now, owing to the weekly Quasimodo resistance. Therefore, traders may still attempt short positions off the local trend line resistance and Quasimodo resistance at 1727.8.
A break above 1739.6, however, will likely fuel further buying.
The accuracy, completeness and timeliness of the information contained on this site cannot be guaranteed. IC Markets does not warranty, guarantee or make any representations, or assume any liability regarding financial results based on the use of the information in the site.
News, views, opinions, recommendations and other information obtained from sources outside of www.icmarkets.com.au, used in this site are believed to be reliable, but we cannot guarantee their accuracy or completeness. All such information is subject to change at any time without notice. IC Markets assumes no responsibility for the content of any linked site.
The fact that such links may exist does not indicate approval or endorsement of any material contained on any linked site. IC Markets is not liable for any harm caused by the transmission, through accessing the services or information on this site, of a computer virus, or other computer code or programming device that might be used to access, delete, damage, disable, disrupt or otherwise impede in any manner, the operation of the site or of any user’s software, hardware, data or property.


