
EUR/USD:
(Outlook remains unchanged)
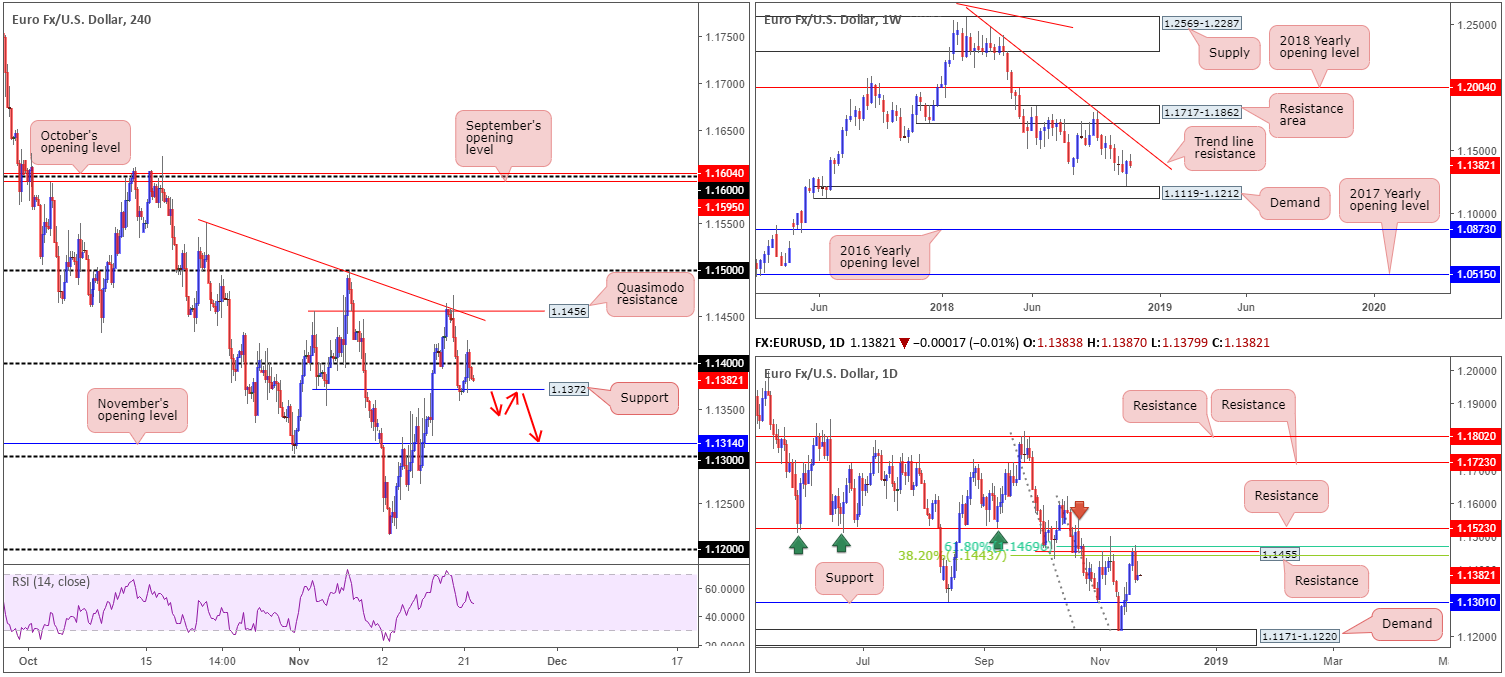
Mid-way through Wednesday’s London session, the pair reclaimed 1.14+ status after modestly recovering from H4 support at 1.1372 amid Asia’s segment. US durable goods orders fell by 4.4% in October, significantly more than the expected 2.5% and the largest fall since October 2017. As a result of this, the euro immediately rose higher against its US counterpart (check the M5 chart), though failed to sustain gains beyond 1.1424: the session high for the day. As can be seen from the H4 chart, the 1.14 handle was eventually recaptured to the downside, with the unit concluding the day suspended just north of the aforementioned H4 support level.
On the whole, little change is observed on the higher timeframes in terms of structural position. Daily flow displays room to press lower towards support at 1.1301, after Tuesday witnessed price action respond from resistance priced in at 1.1455/two daily Fibonacci resistances: 38.2%/61.8% at 1.1443 and 1.1469, respectively. Weekly movement, on the other hand, is seen meandering between a notable trend line resistance (extended from the high 1.2476) and a demand zone coming in at 1.1119-1.1212.
Areas of consideration:
On account of the above reading, the research team remains bearish this market, looking for a decisive H4 close below 1.1372. This, followed up with a retest is likely adequate enough to draw in sellers towards 1.13ish (see red arrows).
While aggressive traders are unlikely to wait for additional confirmation, conservative traders may opt to wait and see how price action behaves before pulling the trigger from 1.1372. A bearish candlestick formation would not only help confirm seller intent, it’d also provide entry/stop parameters.
Today’s data points: ECB Monetary Policy Meeting Accounts; US banks closed in observance of Thanksgiving Day.
GBP/USD:
(Outlook remains unchanged)
Sterling displayed a degree of resilience in the face of ongoing Brexit uncertainty and contradictory headlines. UK Prime Minister Theresa May will return to Brussels for Brexit talks this weekend as the UK and EU strive to fix a deal in time for Sunday’s summit of European leaders. After a two-hour meeting with EU officials yesterday, May stated progress was being made on the future shape of EU-UK relations.
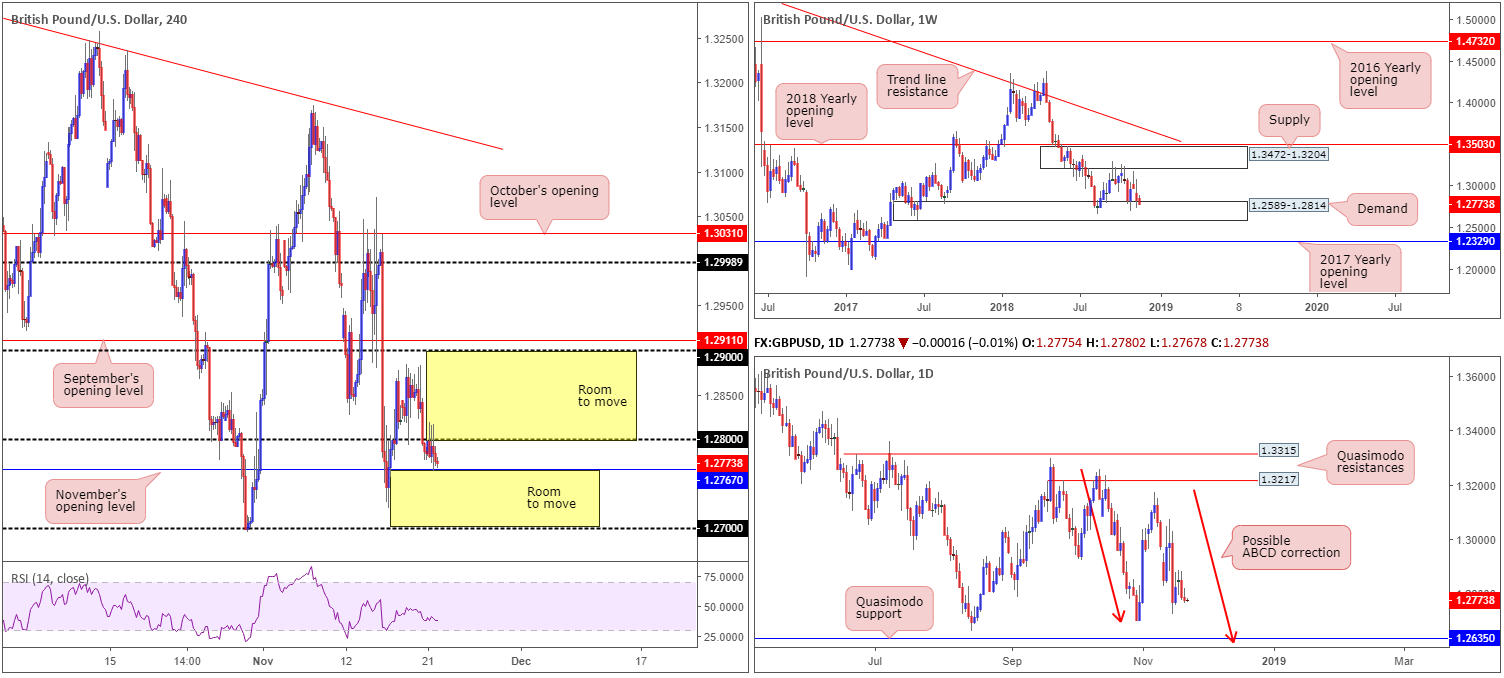
The 1.28 handle on the H4 timeframe capped upside throughout Wednesday’s sessions, though this failed to generate much follow-through selling, ending the day relatively unchanged. As highlighted in yesterday’s briefing, November’s opening level at 1.2767 is the next downside support on the H4, which if overthrown could lead to a challenge of the 1.2723 Nov 15 low/1.27 handle.
Weekly price, as highlighted in previous reports, remains limited to a consolidation carved from demand at 1.2589-1.2814 and a supply drawn from 1.3472-1.3204 (price is currently testing the lower edge of this range). A closer look at price action on the daily timeframe, nevertheless, shows the unit positioned within close proximity to the 1.2695 Oct 30 low. While a response from this neighbourhood is possible, the Quasimodo support seen at 1.2635 remains an appealing level, given the amount of stop-loss orders likely positioned beneath the said low and the 1.2661 Aug 15 low (taking out these stops provide liquidity for pro money to buy), along with a possible ABCD approach (red arrows) terminating just south at 1.2614.
Areas of consideration:
A H4 close back above 1.28 today has Tuesday’s highs of 1.2883 to target, followed closely by 1.29. A retest of 1.28 as support is likely to secure buyer interest – even more appealing would be if the retest formed in the shape of a bullish candlestick pattern (entry/stop parameters can be decided through this structure).
The research team is also looking at the possibility of a break of 1.2767, conceivably freeing downside towards 1.27ish. Similar to above, a retest of 1.2767 (by way of a candlestick pattern) as resistance is likely to secure seller interest.
Today’s data points: MPC Member Saunders Speaks; US banks closed in observance of Thanksgiving Day.
AUD/USD:
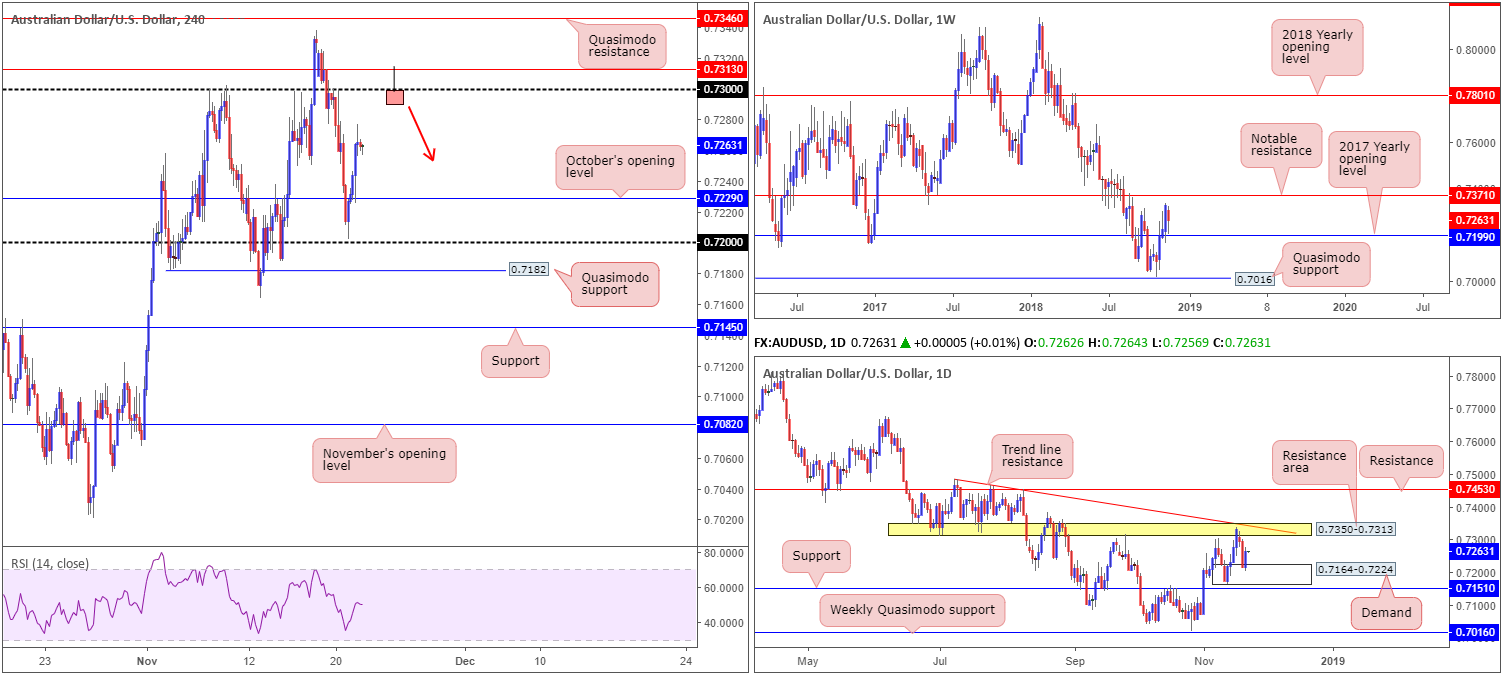
Swiftly recovering from a mid-European session dip to 0.7225, Wednesday’s movement witnessed the AUD/USD overthrow October’s opening level at 0.7229 and advance to fresh session highs of 0.7277. Renewed US-China trade optimism and a broad revival in risk sentiment has firmly positioned the 0.73 handle in view as the next upside target on the H4 timeframe. Note this psychological level held beautifully as resistance on Nov 8 and 15 and also on Monday after the barrier failed to offer support.
According to our technical studies on the daily timeframe, further buying could be on the table today/tomorrow after a solid recovery candle printed from demand at 0.7164-0.7224. The next area of interest on this scale falls in at a resistance zone drawn from 0.7350-0.7313/trend line resistance (taken from the high 0.7483). On a wider perspective, however, the weekly candles are seen trading between a notable resistance at 0.7371 and the 2017 yearly opening level at 0.7199.
Areas of consideration:
The 0.73 handle is an attractive resistance, not only due to its historical significance but also because it is sited just south of the current daily resistance area at 0.7350-0.7313. Therefore, a possible shorting opportunity may arise should a H4 bearish pin-bar pattern form that pierces through 0.73 and tests the underside of the daily resistance zone (see H4 chart for a visual). Entry/stop parameters can be sited according to the candlestick structure’s rules, with the initial take-profit target (at the time of writing) set at 0.7229: October’s opening level.
Today’s data points: US banks closed in observance of Thanksgiving Day.
USD/JPY:
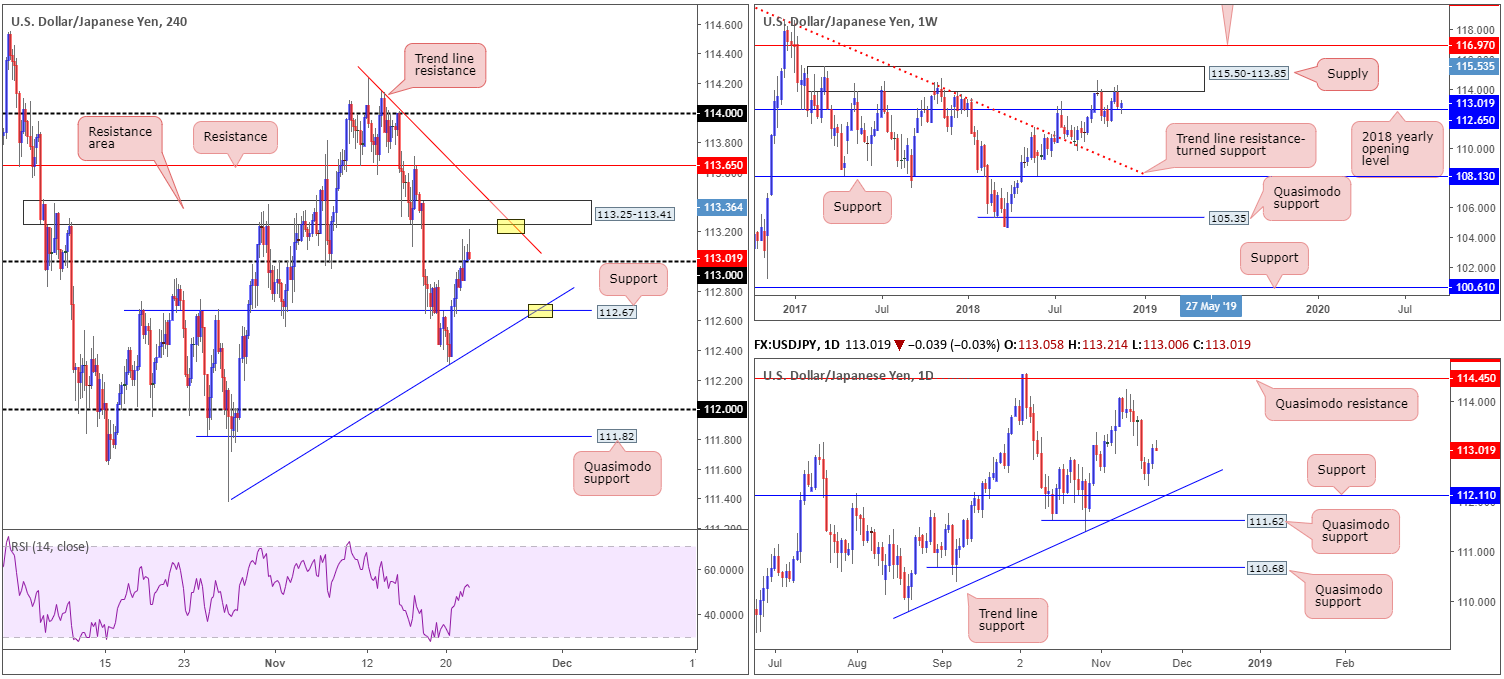
Demand for the safe-haven Japanese yen diminished Wednesday as risk appetite resurfaced. A reasonably upbeat US equity market and rising US Treasury yields helped the USD/JPY conquer its 113 handle.
Although weekly price indicates further upside could be in store from its 2018 yearly opening level at 112.65 towards notable supply priced in at 115.50-113.85, a hefty H4 resistance area is seen lurking nearby at 113.25-113.41. Note the H4 zone also merges closely with a trend line resistance (extended from the high 114.23). In terms of daily structure, areas worth keeping an eyeball on are support at 112.11 and Quasimodo resistance plotted at 114.45.
Areas of consideration:
With a reasonably strong resistance area planted directly above 113, entering long in this market is challenging despite where we’re trading from on the weekly timeframe at the moment.
On the whole, the only points of interest in this market this morning for a possible bounce are marked in yellow:
- H4 support at 112.67 that converges with trend line support (taken from the low 111.95.
- H4 resistance area at 113.25-113.41 that merges with trend line resistance (extended from the high 114.23).
Today’s data points: US banks closed in observance of Thanksgiving Day.
USD/CAD:
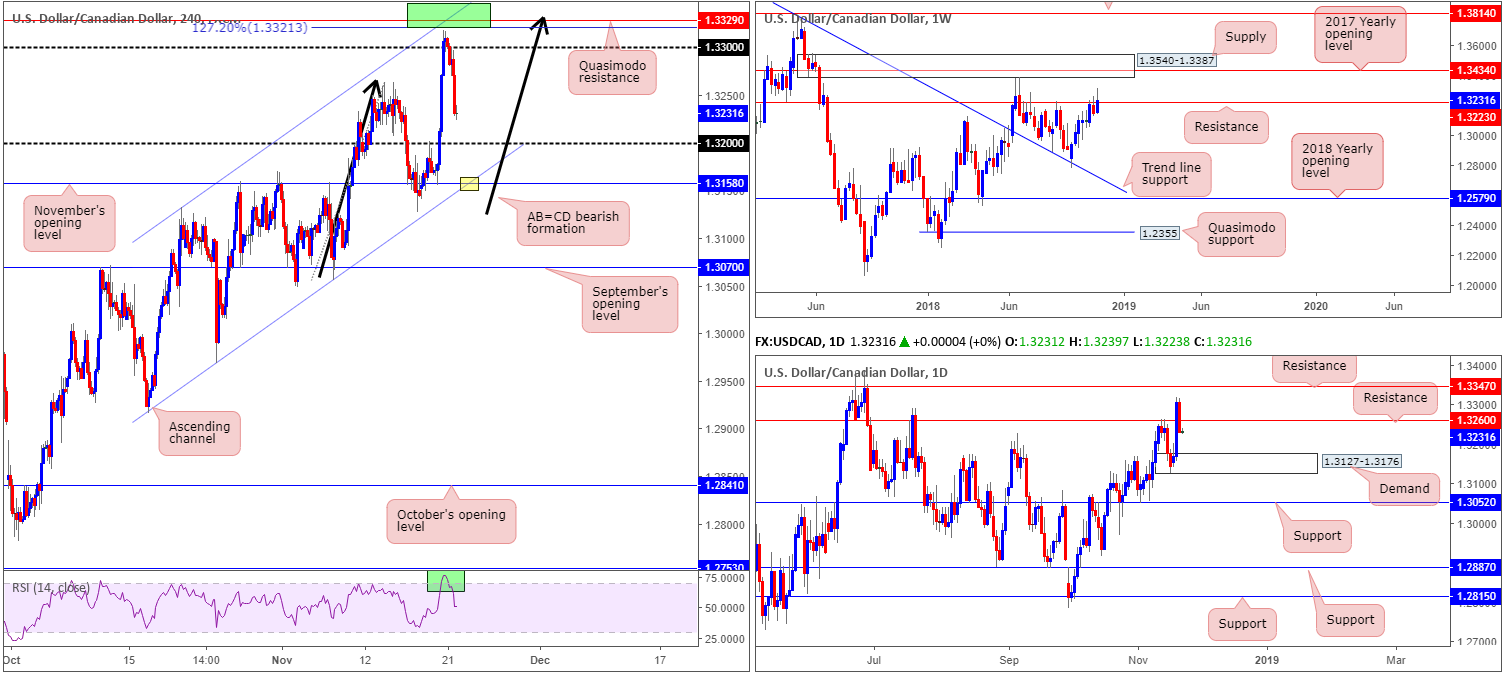
For those who read Wednesday’s briefing you may recall the piece highlighted a possible sell zone from 1.3347/1.3321 (green – comprised of a H4 Quasimodo resistance level at 1.3329, a H4 AB=CD (black arrows) 127.2% bearish pattern at 1.3321, a H4 channel resistance [taken from the high 1.3132], the H4 RSI indicating an overbought reading and a daily resistance level at 1.3347).
Unfortunately, price action turned south a few pips of this zone and reclaimed 1.33 to the downside. Influenced largely on the back of rising crude oil prices, the H4 candles are now seen poised to approach 1.32. Beyond 1.32, however, the research team has spotted an interesting point of convergence (yellow) between November’s opening level at 1.3158 and a channel support (extended from the low 1.2916).
In terms of weekly flow, the market is seen grappling with a resistance level at 1.3223. In the event we close back beneath this level, there’s ample room for the sellers to stretch their legs on this scale. Daily movement also reclaimed support at 1.3260 (now acting resistance), potentially clearing the runway towards demand at 1.3127-1.3176.
Areas of consideration:
While many likely have their radar pointing firmly at 1.32 for a possible bounce higher, particularly given we recently printed a fresh higher high in this market, the team here has noted November’s opening level mentioned above at 1.3158 as the more attractive base for longs. Not only does it converge with H4 channel support, it is positioned within the walls of daily demand at 1.3127-1.3176.
Conservative traders may look to position stop-loss orders beyond daily demand (1.3127), providing over a 1:1 ratio in terms of risk/reward towards 1.32 (the initial upside target from 1.3158).
Today’s data points: US banks closed in observance of Thanksgiving Day; (CAD) Gov. Council Member Wilkins Speaks.
USD/CHF:
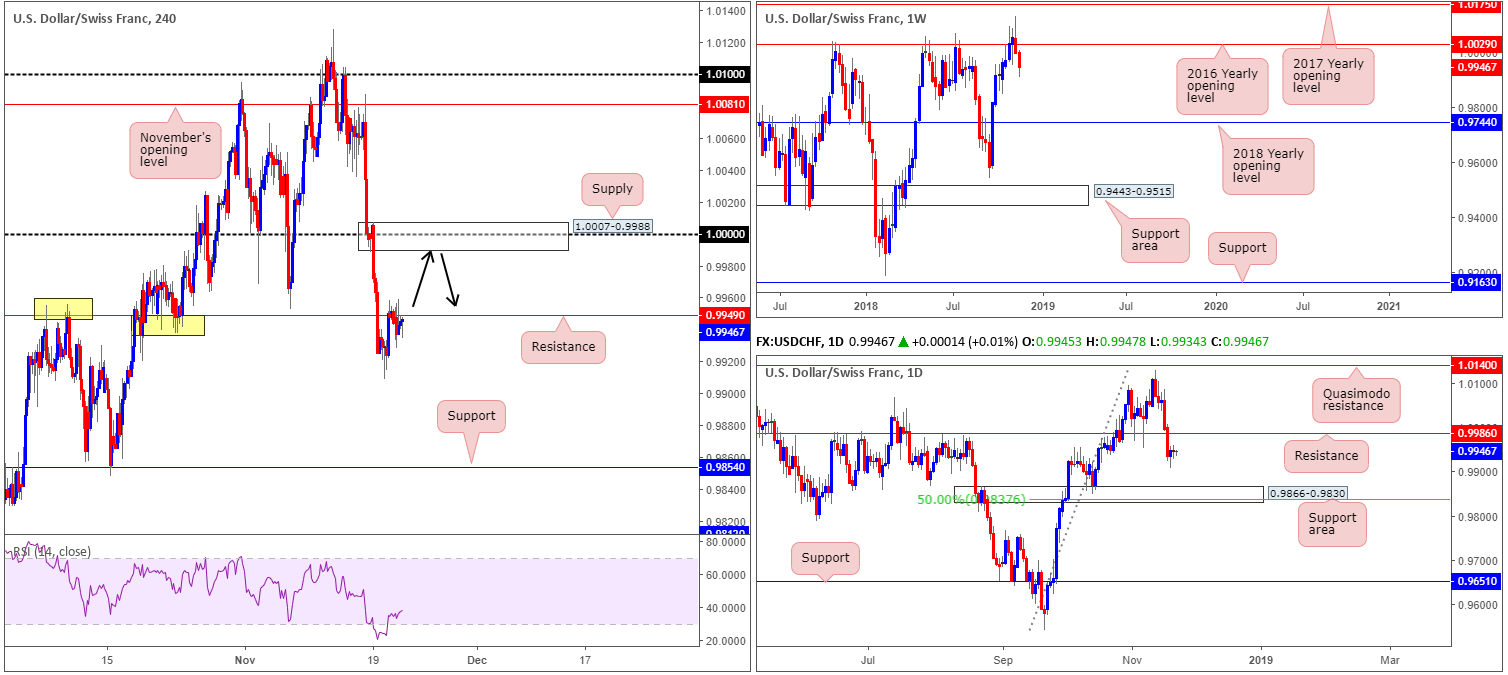
USD/CHF price is effectively unchanged this morning, as H4 action spent the day hugging the underside of resistance priced in at 0.9949. Given the lackluster performance observed Wednesday, much of the following analysis will echo thoughts put forward in yesterday’s briefing…
Though the current H4 resistance level is holding ground, 1.0000 (parity) is seen lurking directly above it, which, as you can see, happens to be encased within a rather attractive H4 supply area at 1.0007-0.9988. On a wider perspective, however, weekly movement continues to reflect a bearish stance beneath its 2016 yearly opening level at 1.0029, with the possibility of price pushing as far south as the 2018 yearly opening level at 0.9744. Daily flow, on the other hand, shows resistance resting nearby at 0.9986.
Areas of consideration:
1.0000, in particular the H4 supply area surrounding the number at 1.0007-0.9988, is attractive for shorts today. The lower edge of the H4 supply is seen sited two pips above daily resistance at 0.9986, making it a prime location for active sellers to make an appearance.
As for stop-loss placement, above the aforementioned H4 supply appears reasonable. With respect to an initial take-profit target, the top edge of a daily support area at 0.9866-0.9830 appears logical (next downside target on the daily scale), followed closely by H4 support at 0.9949.
Today’s data points: US banks closed in observance of Thanksgiving Day.
Dow Jones Industrial Average:
(Outlook remains unchanged)
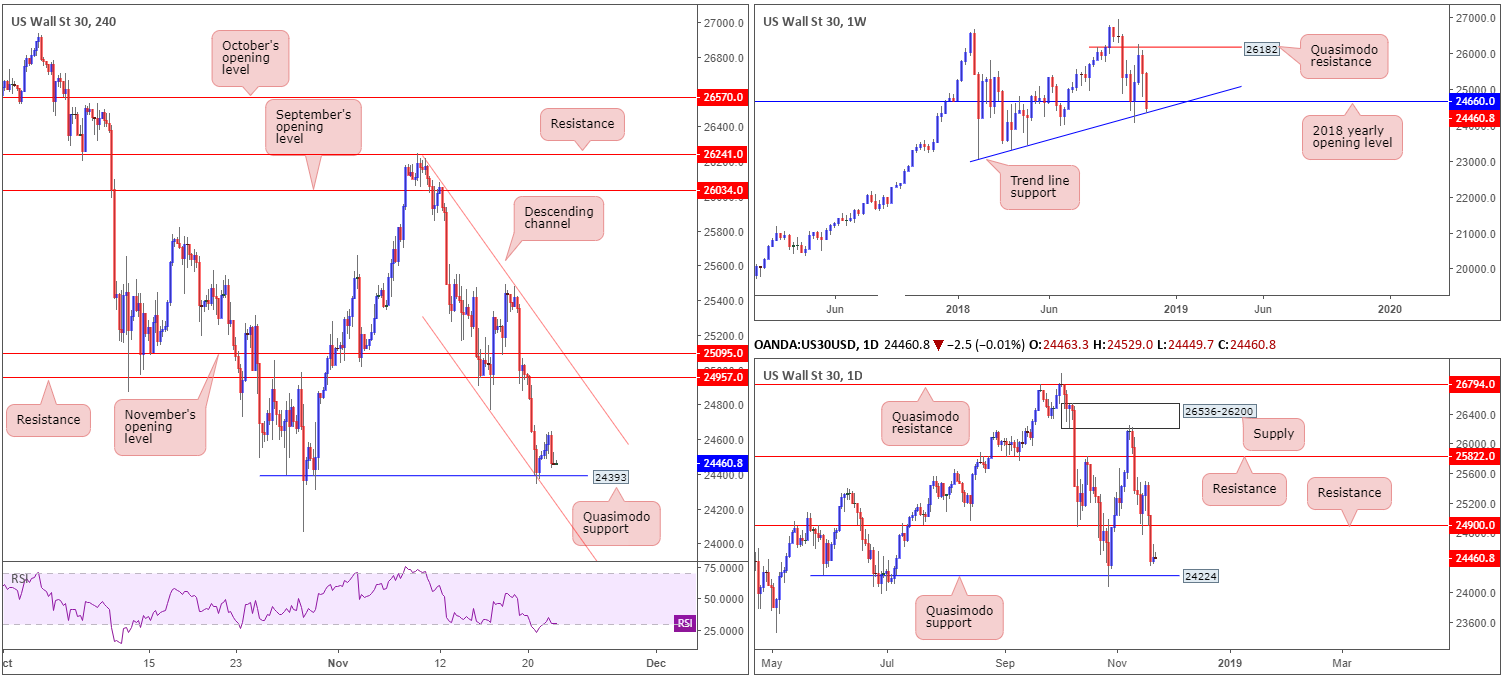
Kicking off this morning’s report with a look at the weekly timeframe, we can see the unit trading beneath its 2018 yearly opening level at 24660, though remains supportive off nearby trend line support (extended from the low 23055). A closer read brings in the daily candles, which, as you can see, remain loitering mid-range between resistance at 24900 and a Quasimodo support priced in at 24224.
Lower down on the curve, the H4 Quasimodo support at 24393 remains in the fight. On the back of a reasonably decisive recovery in crude oil prices, the index clocked highs of 24649 Wednesday, though erased the majority of the day’s gains into the close. As highlighted in Wednesday’s briefing, the H4 Quasimodo support lines up perfectly with the aforementioned weekly trend line support and a H4 channel support (extended from the low 24769). Therefore, the research team still believes there’s a strong chance we may observe a move north from here towards H4 resistance at 24957.
Areas of consideration:
Although daily price shows room to push lower, the combination of weekly and H4 support remains attractive. Should H4 price retest 24393 today and chalk up a bullish candlestick configuration, a long position could be considered (entry/stop parameters can be sited according to the candlestick structure’s rules).
Today’s data points: US banks closed in observance of Thanksgiving Day.
XAU/USD (Gold):
(Outlook remains unchanged)
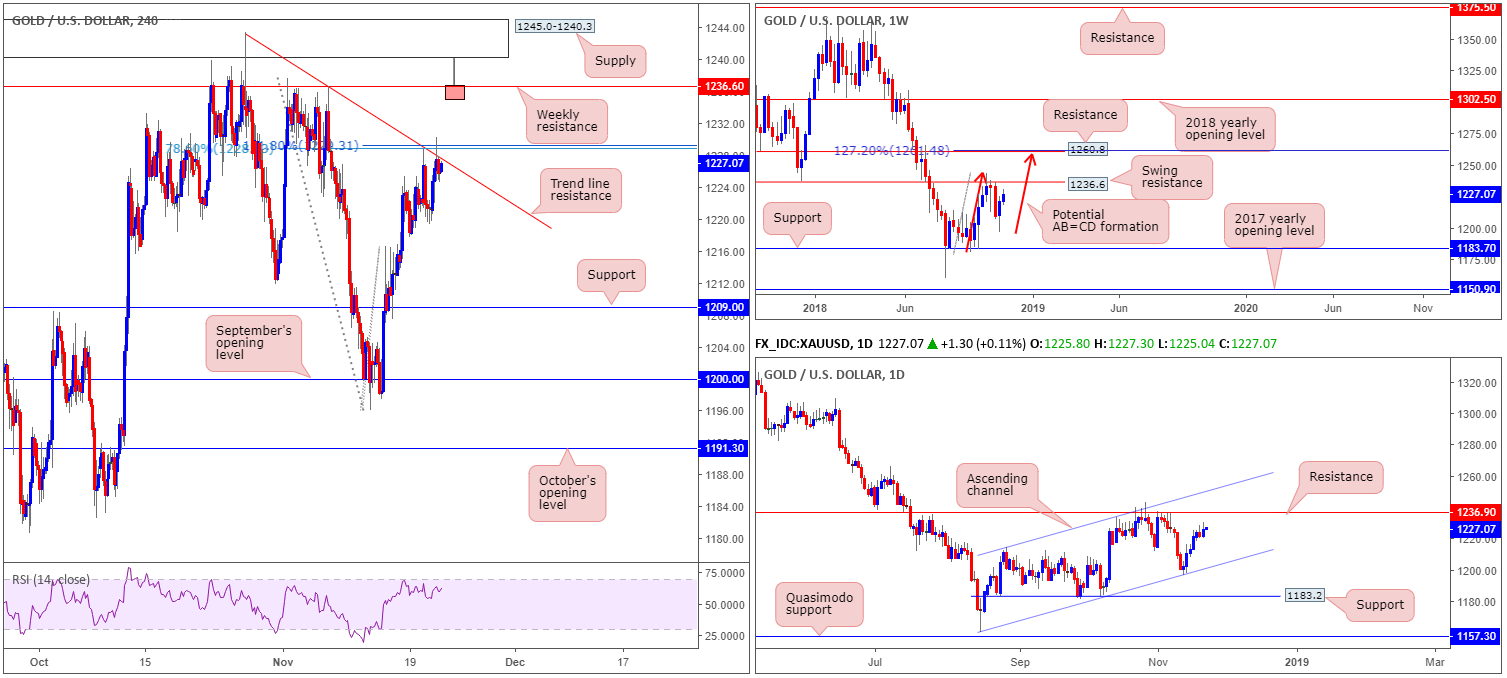
The H4 trend line resistance (extended from the high 1243.4), as you can see, remains back in the fight. As highlighted in Wednesday’s briefing, this trend line converges with a 78.6% Fib resistance at 1228.7/161.8% Fib ext. point at 1229.3.
Whether additional selling will take place from the noted trend line remains difficult to judge. We say this simply because both weekly and daily timeframes exhibit room to track higher ground:
- Weekly price shows space to maneuver until swing resistance priced in at 1236.6 is brought into the mix. Another consideration worth noting on the weekly timeframe is the potential for an AB=CD (red arrows) 127.2% bearish formation to complete just north of another layer of resistance (1260.8) at 1261.4.
- Looking at this market in more detail, we can see the yellow metal is currently compressing within an ascending channel formation (1160.3/1214.3) on the daily timeframe, with the candles possibly working their way towards a test of resistance at 1236.9 (essentially representing the weekly swing resistance mentioned above at 1236.6).
Areas of consideration:
With the above in mind, the research team still feels bullion is likely to press higher.
While a bounce from the current H4 trend line resistance has taken form, the majority of traders will still likely be honing in on the weekly resistance level at 1236.6. With H4 supply at 1245.0-1240.3 positioned just north of this weekly line, traders should prepare for the possibility of a fakeout play. Therefore, in the event a H4 bearish pin-bar formation take shape that pierces through the weekly resistance and tests the H4 supply (see H4 chart for a visual), this would be considered a high-probability shorting opportunity (stop-loss orders can be positioned either beyond the noted H4 supply or a few pips above the pin-bar’s wick), targeting the other side of the trend line resistance (at that point support) as an initial take-profit zone.
The use of the site is agreement that the site is for informational and educational purposes only and does not constitute advice in any form in the furtherance of any trade or trading decisions.
The accuracy, completeness and timeliness of the information contained on this site cannot be guaranteed. IC Markets does not warranty, guarantee or make any representations, or assume any liability with regard to financial results based on the use of the information in the site.
News, views, opinions, recommendations and other information obtained from sources outside of www.icmarkets.com.au, used in this site are believed to be reliable, but we cannot guarantee their accuracy or completeness. All such information is subject to change at any time without notice. IC Markets assumes no responsibility for the content of any linked site. The fact that such links may exist does not indicate approval or endorsement of any material contained on any linked site.
IC Markets is not liable for any harm caused by the transmission, through accessing the services or information on this site, of a computer virus, or other computer code or programming device that might be used to access, delete, damage, disable, disrupt or otherwise impede in any manner, the operation of the site or of any user’s software, hardware, data or property.


