
Key risk events today:
European Central Bank (ECB) Monetary Policy Meeting Accounts; Philly Fed Manufacturing Index; Bank of Canada (BoC) Governor Stephen Poloz Speaks.
Market news (Wednesday):
- The minutes of the October Fed meeting stated most participants thought this year’s rate cuts would be sufficient to support moderate growth. All in all, the Fed minutes revealed little surprise.
- Completion of a ‘phase one’ US-China trade deal could slide into next year, trade experts and people close to the White House said, as Beijing presses for more extensive tariff rollbacks, and the Trump administration counters with heightened demands of its own – Reuters.
- Canada consumer prices (CPI) data for October were largely in line with the consensus view, seeing headline inflation at 0.3%, reversing September’s -0.4% figure. Statistics Canada also reported CPI rose 1.9% on a year-over-year basis in October, matching the increase in August and in September. Excluding gasoline, the CPI rose 2.3% following three consecutive monthly increases of 2.4%.
EUR/USD:
(Italics = previous analysis).
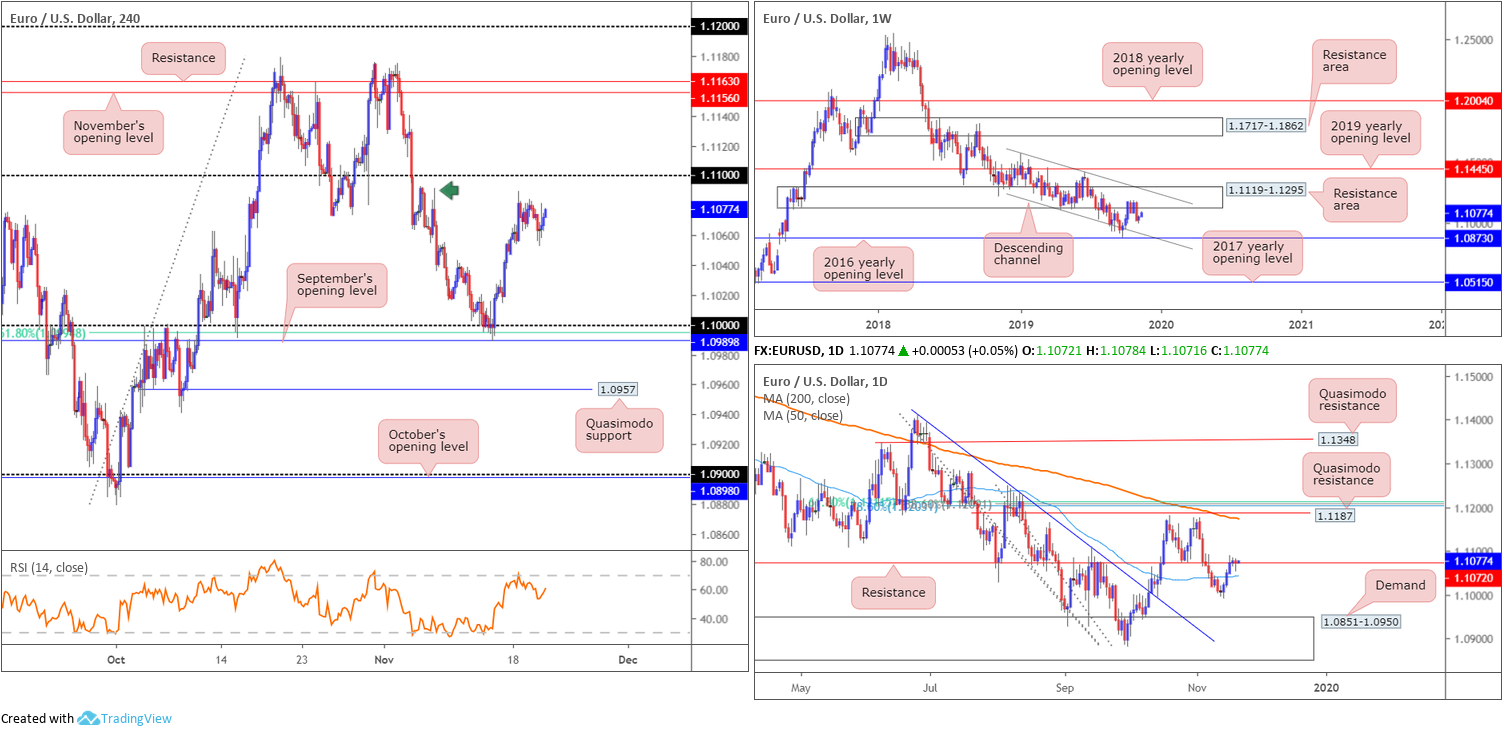
Overall, EUR/USD activity remained sluggish Wednesday, consequently extending the week’s lacklustre movement. Confined within a narrow 40-point range, higher-timeframe action based on the weekly chart positions the market just south of a long-standing resistance area at 1.1119-1.1295. Further selling has the lower boundary of a descending channel to target (extended from the low 1.1109), set a few points north of the 2016 yearly opening level at 1.0873. Concerning trend direction, the primary downtrend has been in motion since topping in early 2018 at 1.2555.
Action on the daily timeframe places the market at notable resistance formed at 1.1072 (price is marginally testing above this region as we write). A decisive close north of the said resistance demonstrates seller weakness out the weekly resistance area mentioned above at 1.1119-1.1295, while a rejection potentially confirms the downside bias. Another area to keep an eye on is demand at 1.0851-1.0950 – houses the 2016 yearly opening level at 1.0873.
The pair kicked off the week (Monday) in reasonably robust fashion, gliding to highs of 1.1090 before entering a consolidative phase. Tops (green arrow) around the 1.1090 neighbourhood on the H4 timeframe are likely viewed as resistance in this market, as is the 1.11 handle. Beyond this point, resistance at 1.1163 and November’s opening level at 1.1156 remains the next upside objective. Indicator-based traders may also wish to acknowledge the relative strength index (RSI) is seen hovering just south of overbought territory.
Areas of consideration:
Outlook unchanged.
From a technical standpoint, daily resistance at 1.1072 is key. Should price action remain beneath this base, further downside is likely in store for EUR/USD, while an upside violation could prompt a retest at the weekly resistance area 1.1119-1.1295.
With the primary downtrend facing south, and price recently exiting a notable weekly resistance area, a rejection off the said daily resistance level by way of a bearish candlestick formation (either H4 or daily scale) will likely be regarded as a strong bearish indicator, with the option of calculating entry/risk levels based off the candle pattern for possible shorts.
GBP/USD:
(Italics = previous analysis).
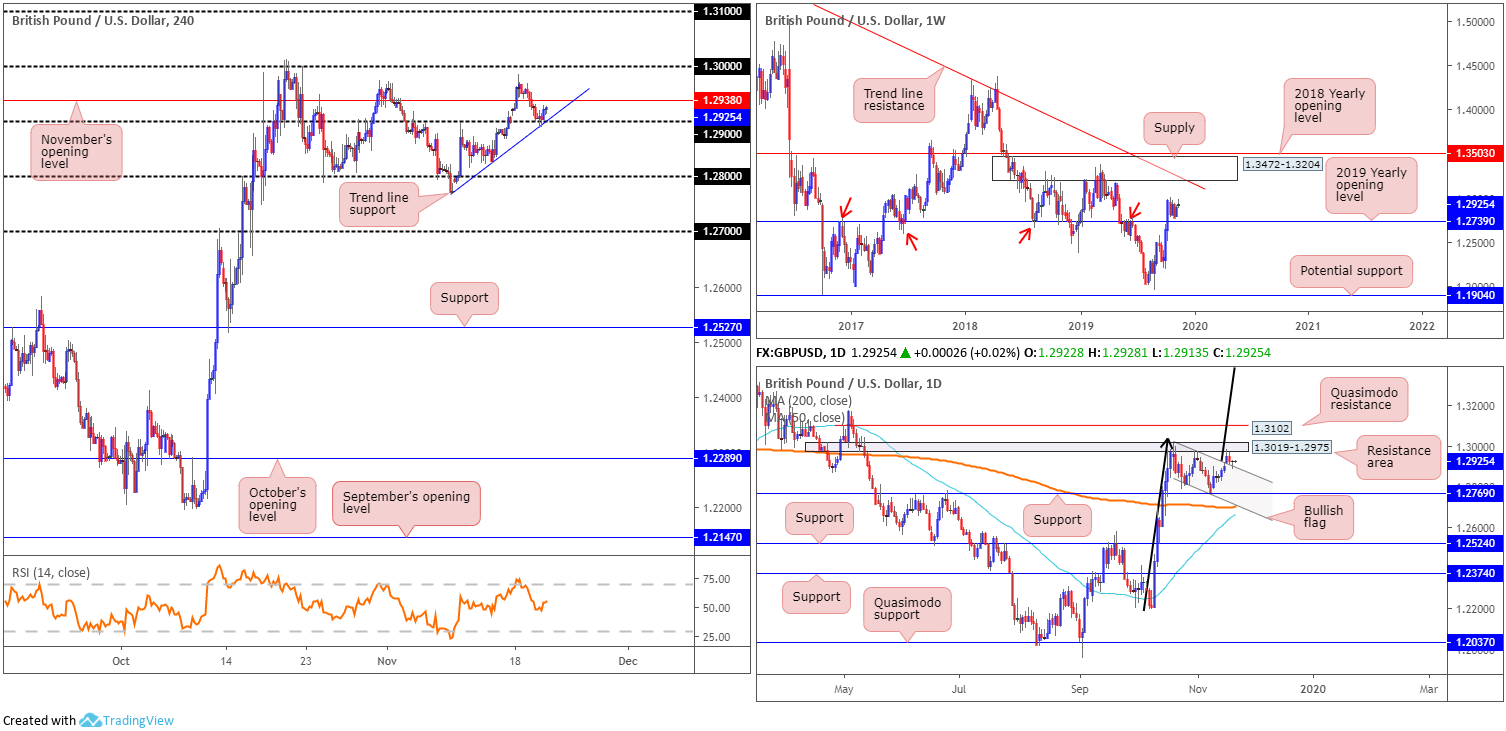
Wednesday, although exhibiting a 40-point range, wrapped up the session unmoved. GBP/USD movement crossed swords with the psychological level 1.29, which happens to align with a local trend line support extended from the low 1.2769, and rotated higher. In terms of resistance, the H4 timeframe has the 1.2938 region in view, November’s opening level, with a break north of here suggesting a run to 1.30 may be on the cards.
Technical research on the daily timeframe, as underscored in Tuesday’s report, reveals a bullish flag pattern (1.3012/1.2804), which has been developing since price broke through resistance at 1.2769 (now a serving support), saw its upper boundary violated Monday in the shape of an opening gap. The resistance area plotted at 1.3019-1.2975, as you can see, capped upside and forced a retest of the recently broken flag yesterday, shaped by way of a hammer candlestick formation (considered a bullish signal at troughs).
Interestingly, the view on the weekly timeframe exhibits scope to extend north, at least until crossing swords with
supply at 1.3472-1.3204 and long-term trend line resistance etched from the high 1.5930. The immediate trend, however, faces a downward trajectory from 1.4376, with a break of the 1.1904 low (labelled potential support) confirming the larger downtrend from 1.7191.
Areas of consideration:
Longer-term traders are likely contemplating a long position based on Wednesday’s reaction off the top edge of the daily bullish flag. Entry at current price is an option, with protective stop-loss orders either positioned beneath the candle’s lower shadow (1.2886 – aggressive approach), below support at 1.2769 or even beneath the flag’s lower limit (extreme conservative approach). The bullish flag’s take-profit target is huge, coming in at 1.3780 (black arrows – measured from the preceding move and added to the breakout point).
An upside violation of 1.30 adds confidence to further buying out of the daily bullish flag, given limited resistance is visible until 1.31. In fact, this could serve as an additional entry point: a retest at 1.30 as support, following a decisive close higher.
AUD/USD:
(Italics = previous analysis).
Despite modest upside Tuesday, sporting a notable bullish outside day candlestick formation on the daily timeframe, sellers strengthened their grip Wednesday.
Traders who read Wednesday’s technical research may recall the following piece:
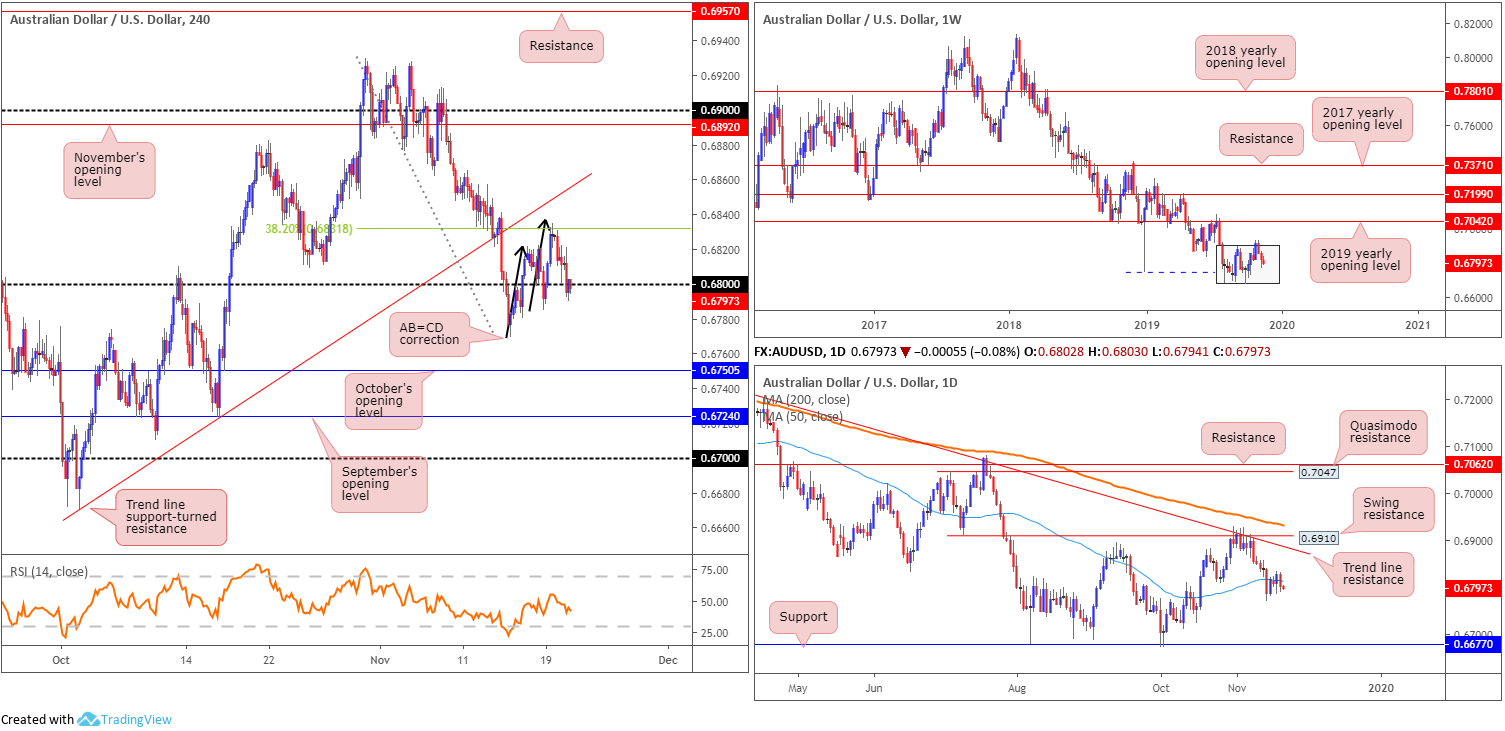
Reclaiming 0.68+ status in early London, price reached highs of 0.6834 and shaped a H4 AB=CD bearish pattern (black arrows). Having seen this correction pattern align with a 38.2% Fibonacci retracement ratio at 0.6831, a pullback to 0.68 is certainly a possibility today.
As evident from the H4 chart this morning, the candles descended from 0.6831ish and did indeed shake hands with 0.68. Traders short this move had the backing of weekly flow, stationed mid-range within its current 3-month long consolidation zone between 0.6894/0.6677 (light grey). The only grumble to a move lower, however, was the daily timeframe, as underlined in Wednesday’s analysis:
Elsewhere, daily price chalked up a standout bullish outside day pattern yesterday, not only engulfing its prior candle but also overthrowing the 50-day SMA (blue – 0.6812). According to the daily scale, this may entice additional buying towards trend line resistance taken from the high 0.7393, closely followed by swing resistance plotted at 0.6910 and the 200-day SMA (orange – 0.6932).
Areas of consideration:
With buyers and sellers squaring off around the 0.68 handle this morning, as well as daily price nudging back beneath its 50-day SMA and weekly flow demonstrating scope to explore lower levels within its current range, further selling is a possibility today. A decisive H4 close beneath 0.68 that’s followed up with a retest, preferably in the shape of a H4 bearish candlestick configuration, would likely be viewed as a potential short, targeting October’s opening level at 0.6750 on the H4 scale as an initial take-profit zone.
USD/JPY:
(Italics = previous analysis).
USD/JPY remained steady Wednesday, largely ignoring latest FOMC minutes and trade headlines (see above). Consequent to this, the following analysis represents similar thoughts put forward in Wednesday’s technical research.
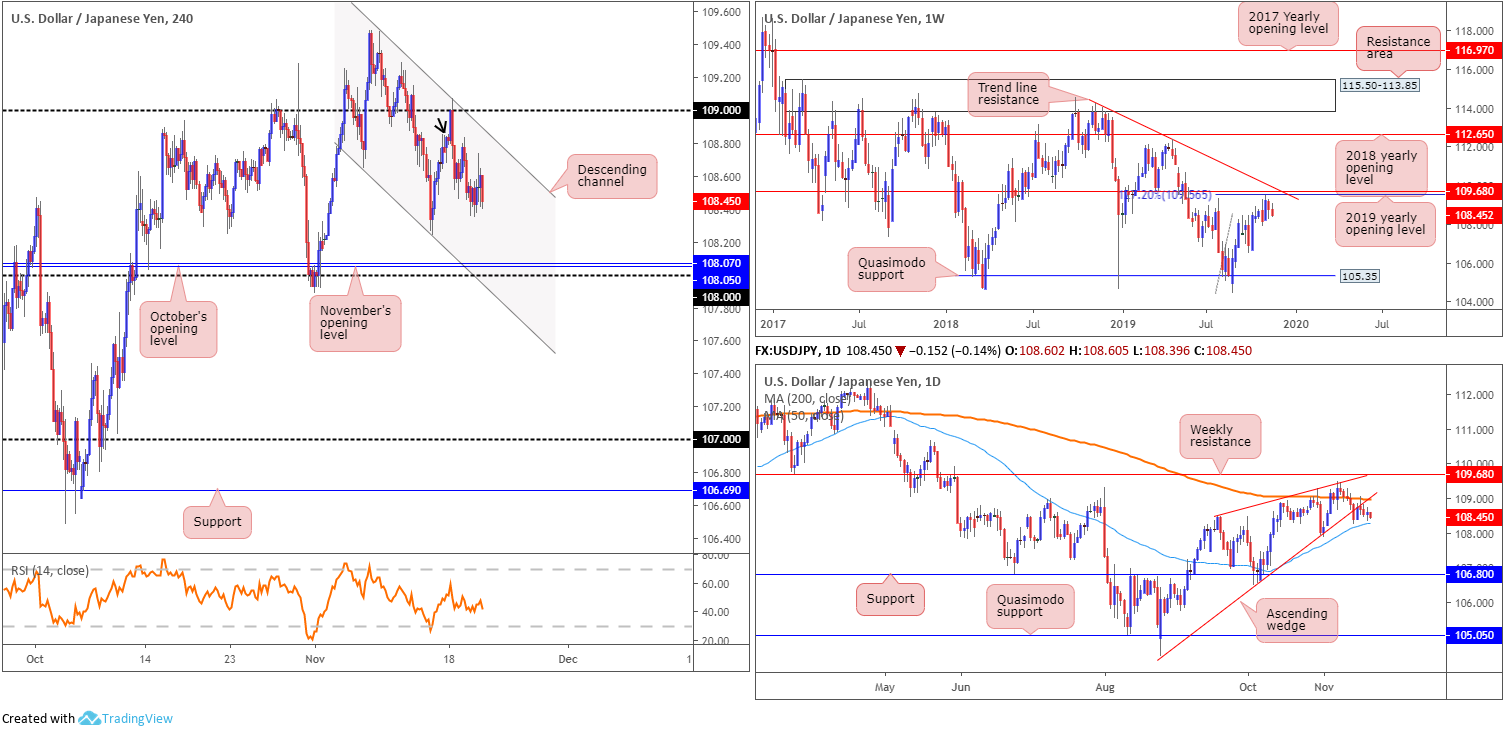
H4 price is currently chalking up a descending channel formation (109.47/108.64), with last Thursday’s low priced in as the next support at 108.24, closely shadowed by the 108 handle, along with November and October’s opening levels at 108.05 and 108.07, respectively.
Supporting the market’s downbeat tone is the 200-day SMA (orange – 108.95) and the lower edge of an ascending wedge formation (104.44), which has been unfolding since early September. Last week ended with the unit retesting the underside of the broken wedge.
Technical research based on the weekly timeframe, as highlighted in Monday’s report, had the USD/JPY contained within the prior week’s range (109.48/108.18) last week. Structurally, resistance is seen close by in the form of the 2019 yearly opening level at 109.68 and a 127.2% Fibonacci ext. point at 109.56 (taken from the low 104.44). Also sited nearby is trend line resistance extended from the high 114.23. In regards to the market’s primary trend, the pair has been entrenched within a range since March 2017, spanning 115.50/105.35.
Areas of consideration:
Traders short from the 109 handle, a noted level for possible shorting opportunities at the beginning of the week, remain in a healthy position. In terms of downside targets, see above in bold; however, traders are also urged to take into account the 50-day SMA (blue – 108.27) applied to the daily timeframe, which may also serve as support.
USD/CAD:
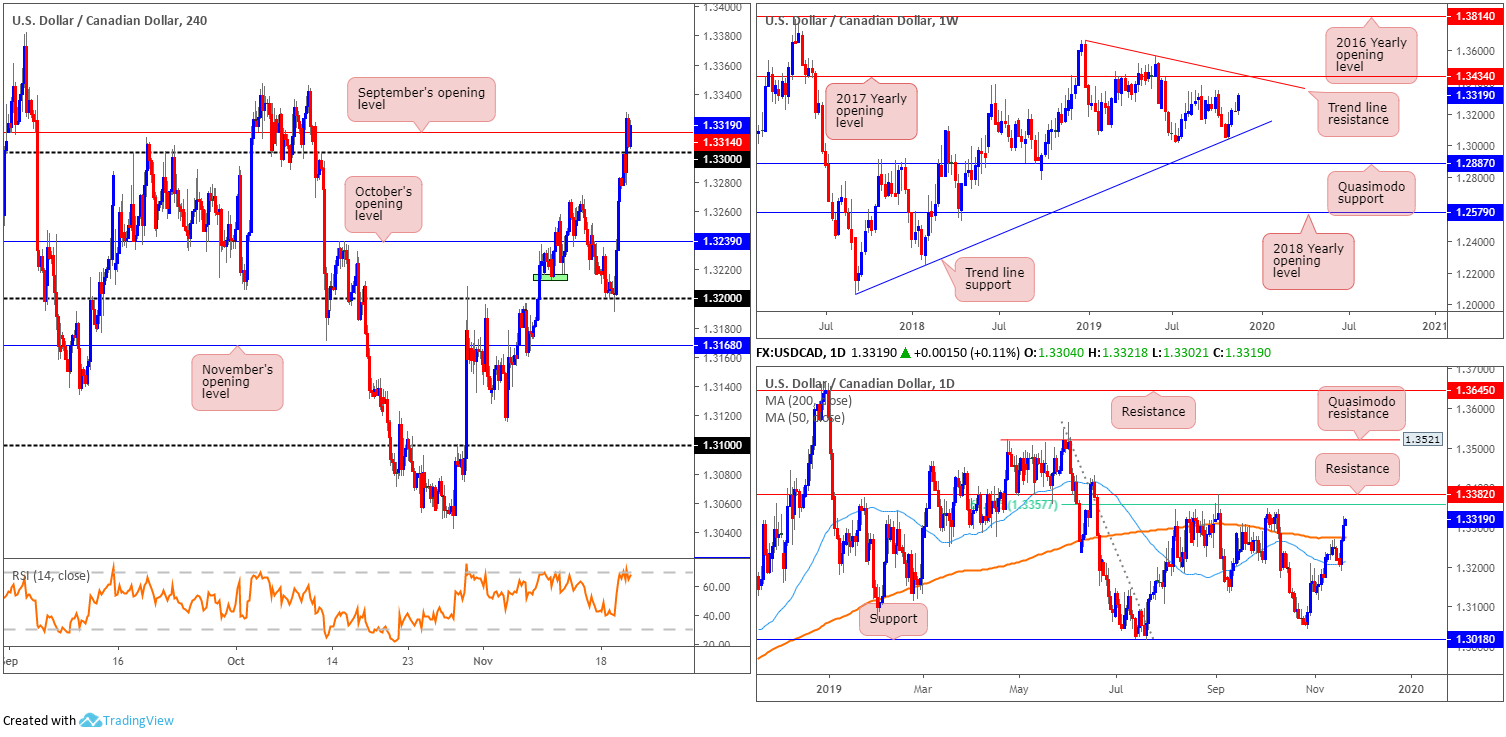
Action on USD/CAD Wednesday witnessed price extend Tuesday’s recovery, adding 37 points, or 0.28%. According to the weekly timeframe, the unit is nearing tops around 1.3342, closely followed by the 2017 yearly opening level at 1.3434 and trend line resistance taken from the peak at 1.3661.
Adding to the upbeat tone, daily movement brushed aside its 200-day SMA (orange – 1.3275) and perhaps set the stage for a move towards resistance around the 1.3382 neighbourhood/61.8% Fibonacci retracement ratio at 1.3357.
Across the page on the H4 timeframe, recent upside pulled the candles through the 1.33 handle and reached highs of 1.3327, likely tripping the majority of buy stops here. Canada consumer prices (CPI) sent USD/CAD prices lower following the release (see above for details), though was a short-lived move. Indicator-based traders may also wish to acknowledge the relative strength index (RSI) trades overbought.
Areas of consideration:
Although many traders will be watching 1.33 today, anticipating a retest motion for possible buying opportunities, September’s opening level at 1.3314 on the H4 timeframe may hamper upside, closely shadowed by tops around 1.3342 on the weekly timeframe.
Well done to any readers who managed to hold longs off 1.32 earlier this week; 1.33 was considered the second take-profit target. The final take-profit zone has the said weekly levels in sight.
USD/CHF:
(Italics = previous analysis).
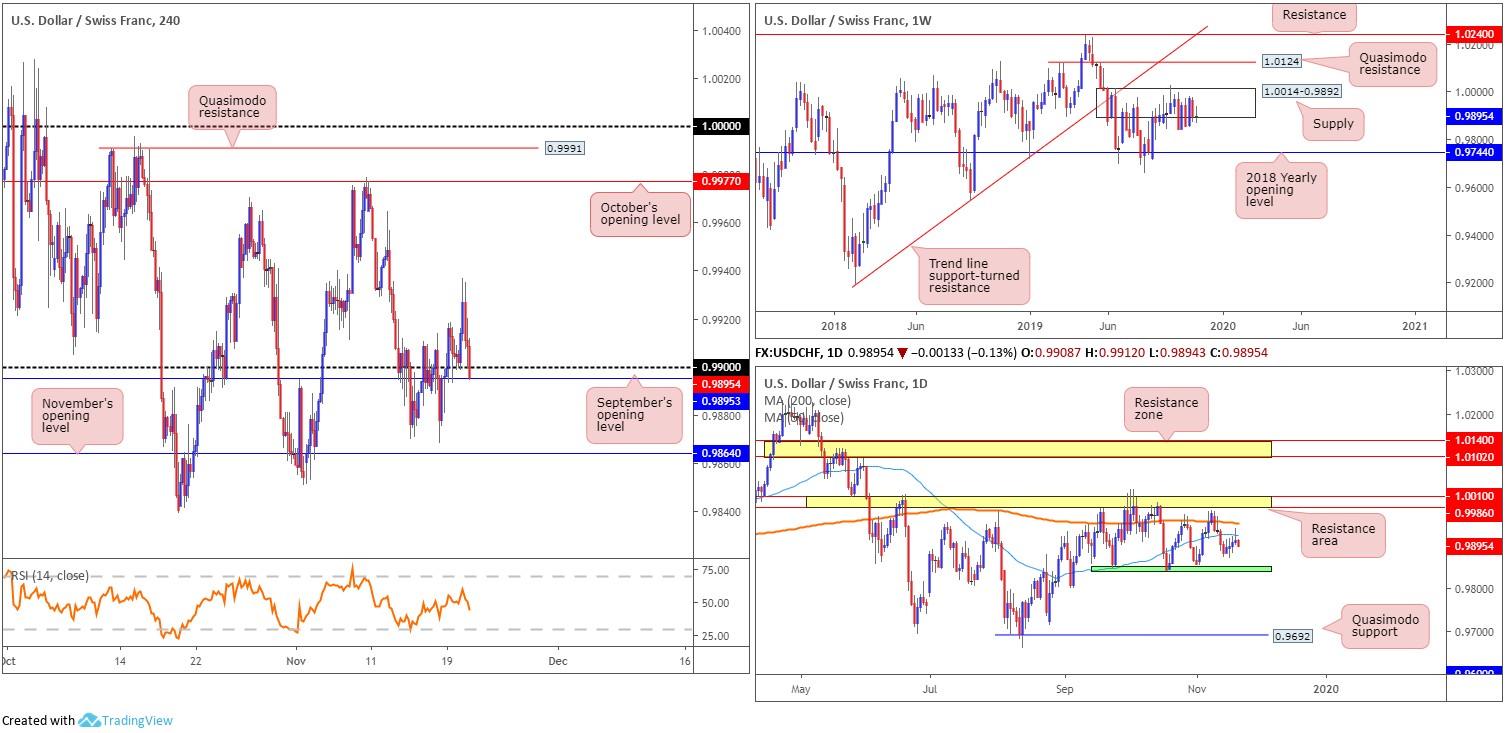
As expected, buyers failed to sustain gains north of 0.99 on the H4 scale Wednesday, capped by the daily timeframe’s 50-day SMA (blue – 0.9921).
Wednesday’s report had the following to say:
Longs above the current H4 range, particularly at the retest of 0.99, are likely eyed by many traders this morning. Appealing as it may be, buyers must contend with the 50-day SMA at 0.9921 on the daily scale. This is not to say a long from 0.99 is invalid, it is more to highlight potential resistance that could hamper upside.
Yesterday’s sharp rotation from session highs of 0.9937 drew the H4 candles back to 0.99 and, in recent hours, marginally crossed beneath the boundary, exposing nearby support in the form of September’s opening level at 0.9896.
Against the back drop of short-term flows, higher-timeframe activity reveals weekly price remains nestled around the underside of supply at 1.0014-0.9892. As highlighted in previous reports, the beginning of October witnessed a penetration to the outer edge of the supply area’s limit, possibly tripping a portion of buy stops and weakening sellers. An upside move out of the said supply may draw in Quasimodo resistance at 1.0124, while downside has the 2018 yearly opening level at 0.9744 in sight. According to the primary trend, price also reflects a slightly bullish tone; however, do remain aware we have been rangebound since the later part of 2015 (0.9444/1.0240).
Since mid-September, daily action has been busy carving out a consolidation between support around the 0.9845ish region (green) and a resistance area coming in at 1.0010/0.9986. Interestingly, between the said range, the 200-day and 50-day SMAs are seen closing in on each other (orange – 0.9948/blue – 0.9921). Traders may also find interest in noting the unit chalked up a shooting star candlestick pattern (considered a bearish signal) yesterday off the said 50-day SMA.
Areas of consideration:
Based on current analysis, a decisive H4 close beneath 0.9896 today will likely spur further downside, eyeing November’s opening level at 0.9864 as the initial floor of support, closely followed by the lower boundary of the daily range around 0.9845. Of course, additional selling could be seen beyond the said levels, according to the weekly timeframe, which exhibits scope to test 0.9744.
Dow Jones Industrial Average:
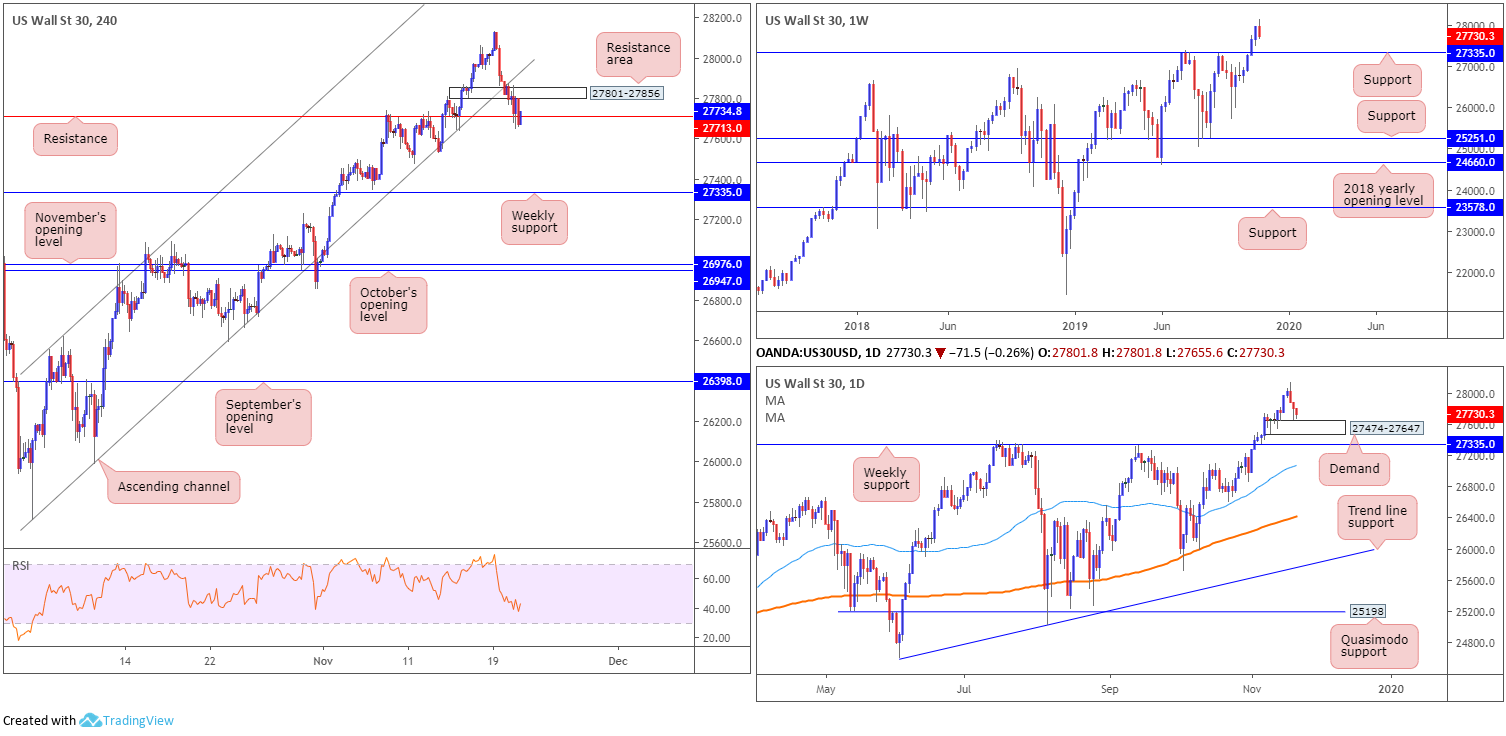
Global stock markets slumped Wednesday amid concerns regarding a trade deal between the US and China. The Dow Jones Industrial Average erased 112.93 points, or 0.40%; the S&P 500 lost 11.72 points, or 0.38% and the tech-heavy Nasdaq 100 declined 54.98 points, or 0.66%.
Technical research based on the H4 timeframe this morning reveals price action tunnelled through a reasonably long-standing channel support (taken from the low 25710) and demand at 27801-27856 (now acting resistance area). Additionally, in recent hours, the index engulfed support coming in at 27713 (now a potentially serving resistance).
Traders considering a short on the back of recent selling could ultimately witness a run to weekly support priced in at 27335. However, before striking this level, traders must contend with daily demand seen at 27474-27647.
Areas of consideration:
Although price swallowed a number of H4 supports yesterday, selling this market, knowing we’re heading into daily demand, as well as the primary trend fixed firmly to the upside, is considered a chancy sell.
However, traders are unlikely to trade long with conviction until we break back into the current H4 ascending channel highlighted above.
XAU/USD (GOLD):
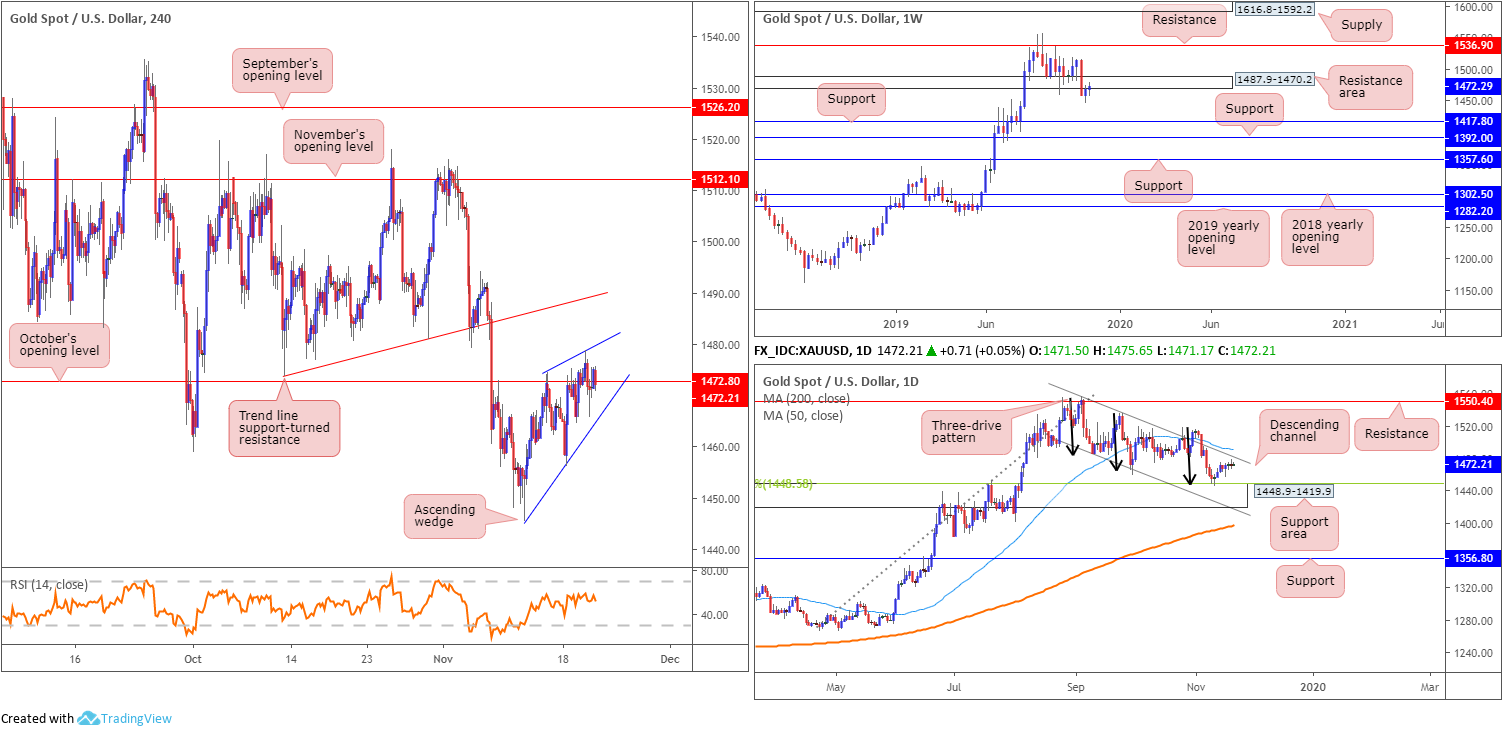
Buyers and sellers continue to battle for position around October’s opening level on the H4 timeframe at 1472.8. Though since bottoming at 1445.5, the H4 candles have been compressing within what appears to be an ascending wedge formation (typically considered a bearish pattern).
As sellers failed to defend 1472.8, daily price has channel resistance positioned nearby (extended from the high 1557.1), and a 50-day SMA (blue – 1490.7). This could be the turning point for the H4 ascending wedge. Couple the said resistances with weekly price testing a resistance area at 1487.9-1470.2, the move lower could be notable. Rejection off the underside of the weekly base may set the long-term stage for a move towards two layers of weekly support at 1392.0 and 1417.8.
Areas of consideration:
Ultimately, traders are likely waiting for daily price to shake hands with its noted resistance, followed by a decisive H4 close out of the ascending wedge pattern. This – coupled with weekly resistance in motion – may lead to a rapid descent. Selling the breakout of the H4 wedge, therefore, is likely eyed going forward, with protective stop-loss orders plotted above the upper limit of the wedge.
The accuracy, completeness and timeliness of the information contained on this site cannot be guaranteed. IC Markets does not warranty, guarantee or make any representations, or assume any liability regarding financial results based on the use of the information in the site.
News, views, opinions, recommendations and other information obtained from sources outside of www.icmarkets.com.au, used in this site are believed to be reliable, but we cannot guarantee their accuracy or completeness. All such information is subject to change at any time without notice. IC Markets assumes no responsibility for the content of any linked site.
The fact that such links may exist does not indicate approval or endorsement of any material contained on any linked site. IC Markets is not liable for any harm caused by the transmission, through accessing the services or information on this site, of a computer virus, or other computer code or programming device that might be used to access, delete, damage, disable, disrupt or otherwise impede in any manner, the operation of the site or of any user’s software, hardware, data or property.


