
Key risk events today:
RBA Gov Lowe Speaks; French Flash Services PMI and Flash Manufacturing PMI; German Flash Manufacturing PMI and Flash Services PMI; Euro Flash Manufacturing PMI and Flash Services PMI; UK Flash Services PMI and Flash Manufacturing PMI; Philly Fed Manufacturing Index; US Unemployment Claims; US Flash Manufacturing PMI and Flash Services PMI; Fed Chair Powell Speaks; New Zealand Retail Sales q/q.
(Previous analysis as well as outside sources – italics).
EUR/USD:
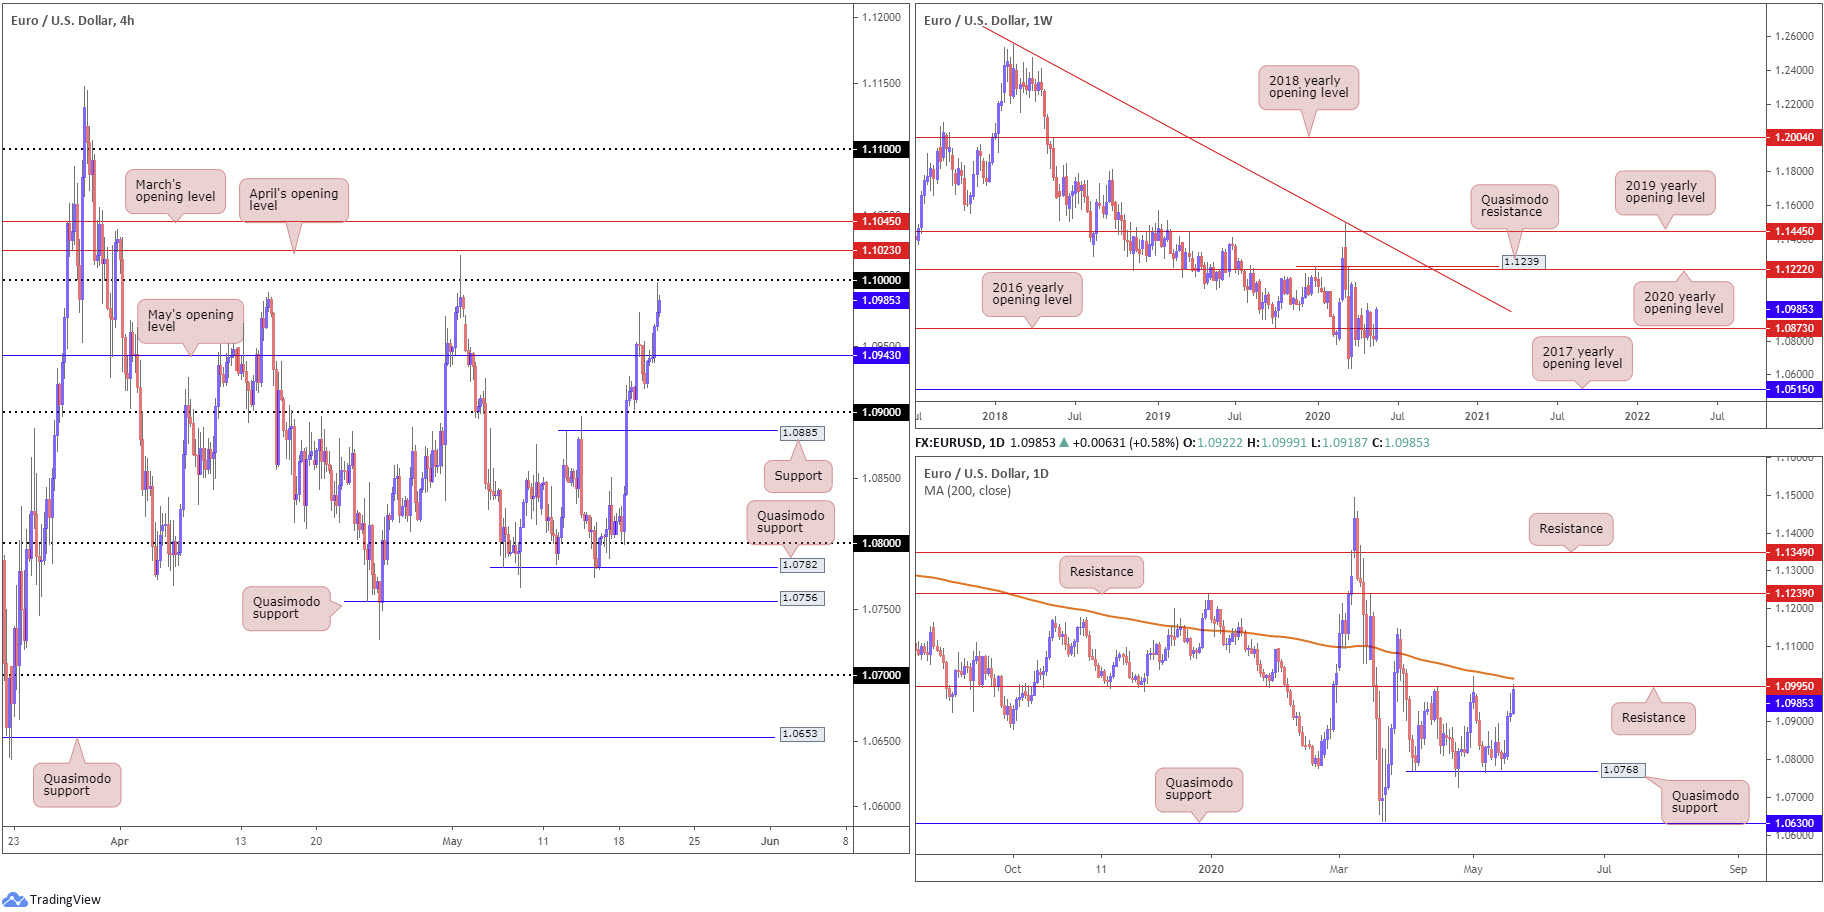
The euro swung into positive territory Wednesday as the US dollar index extended losses and shook hands with 99.00.
Leaving 1.09 unchallenged, EUR/USD bulls penetrated May’s opening level at 1.0943 on the H4 timeframe and cruised towards peaks just south of the key figure 1.10 into the London close, registering its fourth consecutive daily gain. As traders assess 1.10 as possible resistance, chart studies indicate additional resistance plotted by way of April and March’s opening levels at 1.1023 and 1.1045, respectively.
Meanwhile, daily price crossed swords with resistance at 1.0995 yesterday, stationed a touch under the 200-day SMA (orange – 1.1014). Traders may also want to note between the said resistance and Quasimodo support at 1.0768 has, since early April, witnessed a consolidation form.
Further afield, weekly price is regaining a footing above the 2016 yearly opening level at 1.0873, with additional buying theoretically setting the stage for a run to the 2020 yearly opening level at 1.1222. A bump lower from here, though, could have multi-year lows enter at 1.0635. It’s also worth reminding ourselves the pair has remained in a long-term downtrend since topping in early 2018.
Areas of consideration:
1.10 calls for attention as possible resistance today, having noted daily resistance forms at 1.0995.
Owing to round numbers being prone to fakeouts, a whipsaw through 1.10 could be in store to April’s opening level at 1.1023 (and the 200-day SMA at 1.1014). The theory is buy-stops above 1.10, when filled, become liquidity to sell into off 1.1023. Conservative traders will likely want to see a H4 close surface back beneath 1.10 before committing.
GBP/USD:
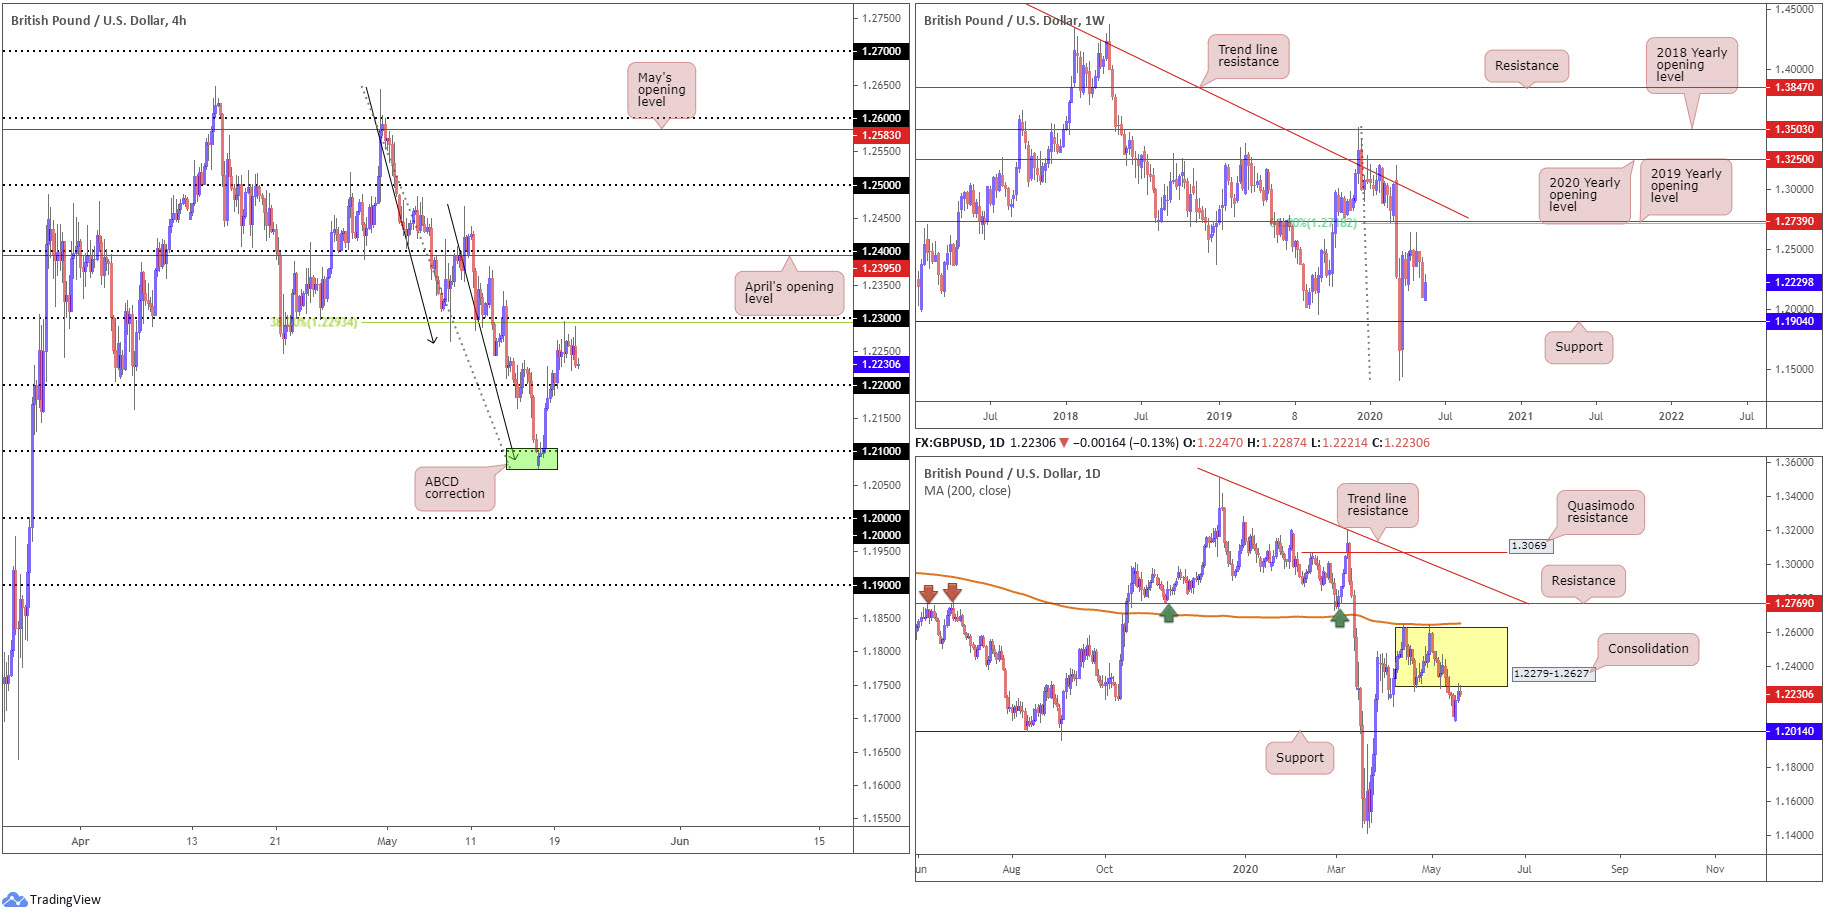
Weaker-than-expected UK inflation data guided GBP/USD lower in early Europe Wednesday; the downtick, however, turned out to be short-lived as traders entered into a bid amid fresh USD selling.
From a technical perspective on the H4 timeframe, we can see price tested a 38.2% Fibonacci retracement ratio at 1.2293, stuck ahead of 1.23, and turned modestly lower. What’s notable about this Fibonacci level is it marks the first take-profit target out of the recently completed H4 ABCD completion (black arrows) from 1.2085.
Higher up on the curve, we can see from the weekly timeframe we have support positioned at 1.1904, while resistance is found at 1.2739, the 2019 yearly opening level, closely intersecting with a 61.8% Fibonacci retracement ratio at 1.2718. Movement on the daily timeframe, however, locates price action at the underside of recently broken daily range lows at around 1.2279.
Areas of consideration:
For those who read Wednesday’s technical briefing you may recall the following (italics):
In light of 1.23 uniting with a 38.2% Fibonacci retracement ratio at 1.2293, a level with a connection to the recently completed H4 ABCD correction, and daily price toying with the lower edge of a familiar range, sellers may make an appearance from the 1.23ish vicinity today.
Well done to any readers who managed to jump aboard shorts under 1.23.
Going forward, traders likely have 1.22 in the crosshairs as a downside target.
A break of 1.22 could initiate breakout selling, with 1.21 pictured as a logical target.
AUD/USD:
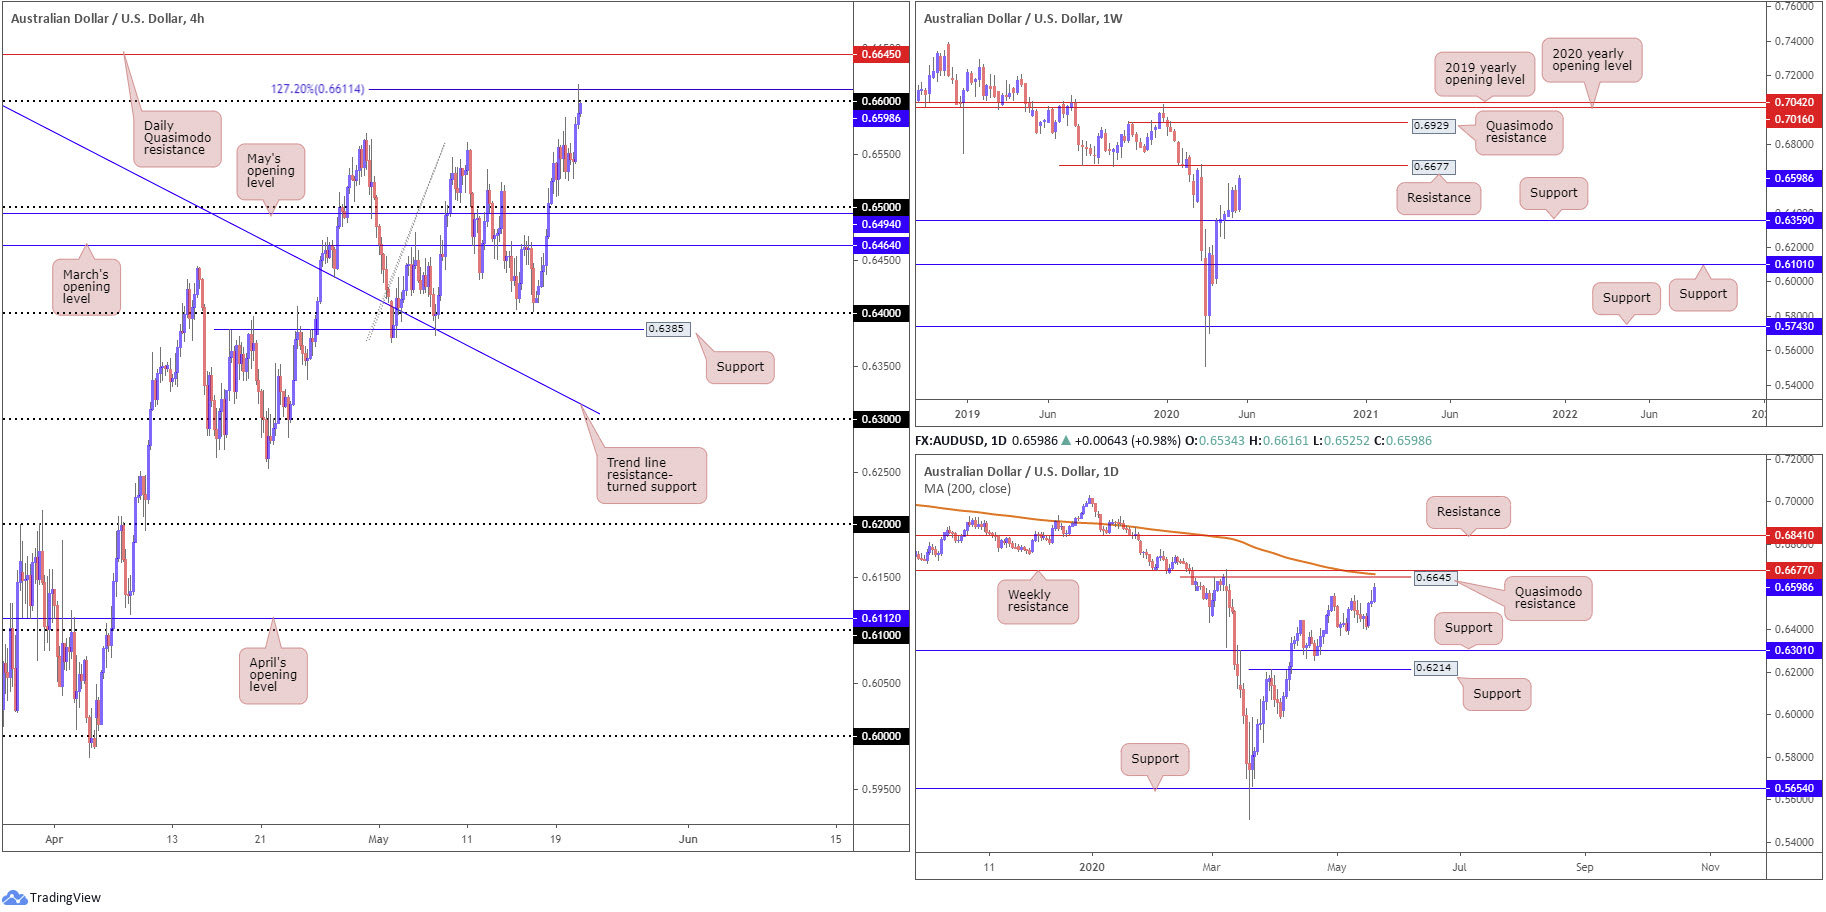
As traders brushed aside Wednesday’s record fall in Aussie monthly retail sales, AUD/USD reversed early losses into Europe amid USD selling, eventually drawing the H4 candles toward 0.66 and a 127.2% Fibonacci extension point at 0.6611, and recording fresh monthly peaks.
Reclaiming all of the prior week’s losses, the weekly timeframe suggests scope for further buying this week, targeting resistance coming in at 0.6677. A closer reading of price action on the daily timeframe had the unit top just ahead of a Quasimodo formation from 0.6645, parked just ahead of the weekly resistance level mentioned above at 0.6677 and a 200-day SMA (orange – 0.6660).
Areas of consideration:
Attempting shorts off 0.66 may interest countertrend traders today, particularly as we have a H4 127.2% Fibonacci extension point nearby at 0.6611.
0.66 may come under fire, however, as the daily Quasimodo resistance at 0.6645, 200-day SMA at 0.6660 and weekly resistance at 0.6677 appeals as the stronger resistance area for short sellers.
USD/JPY:
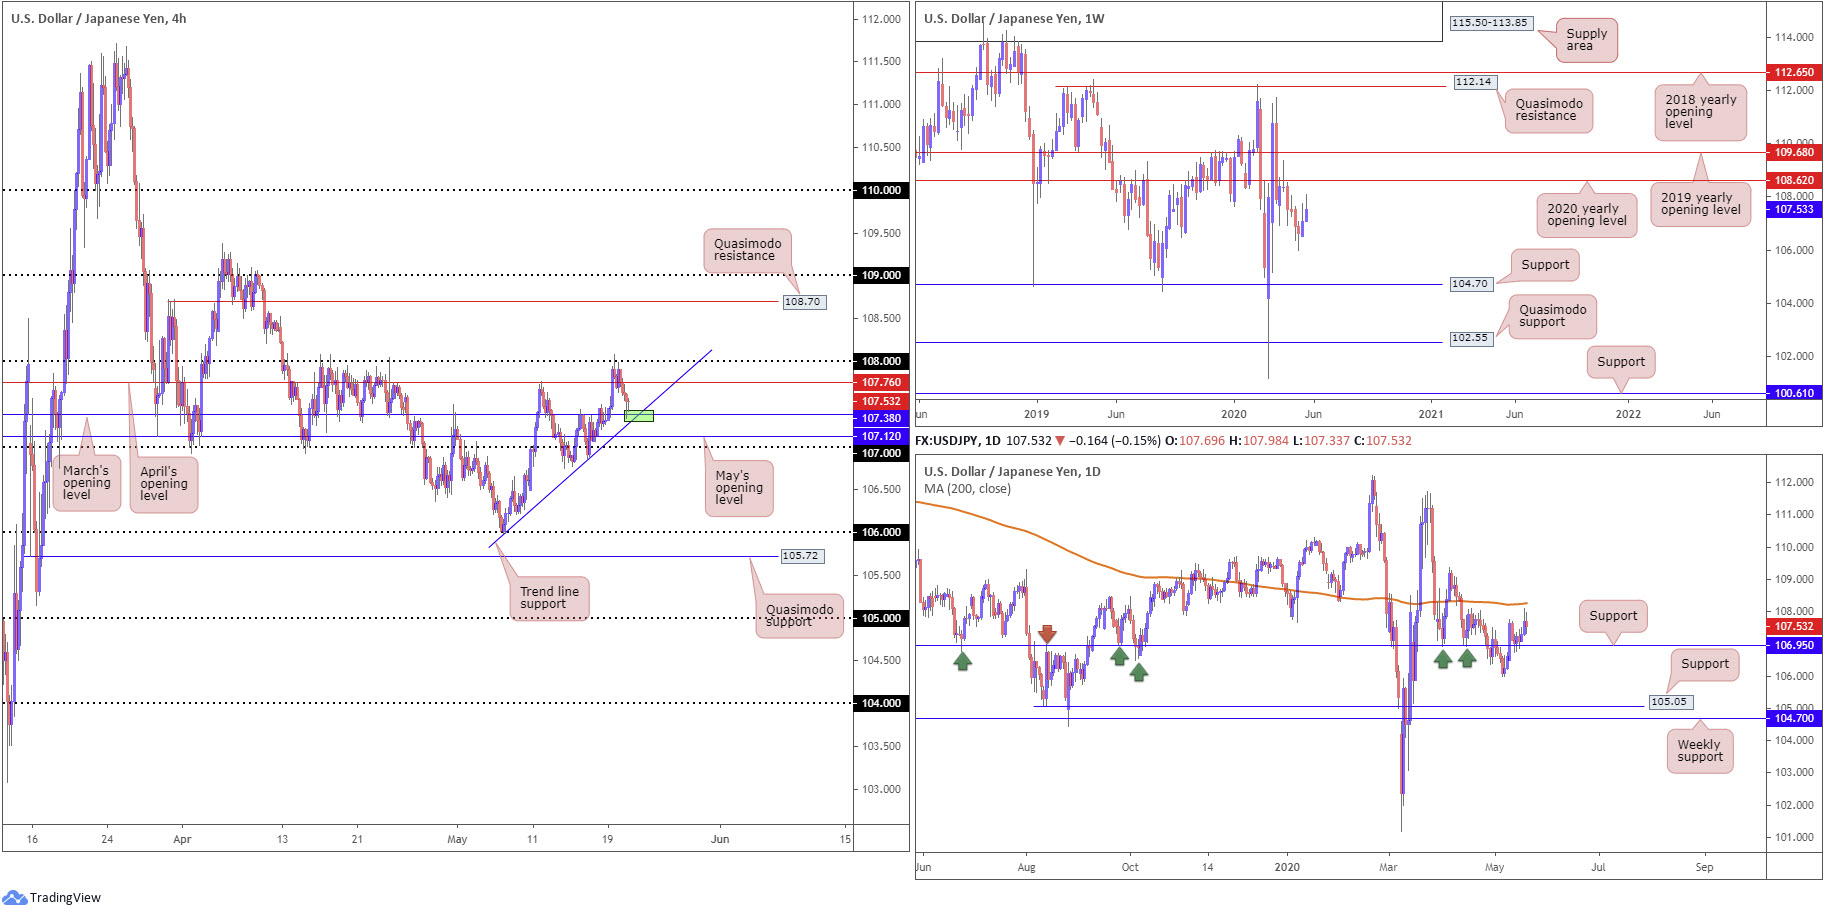
Broad USD selling contained upside Wednesday, holding USD/JPY sub 108 (a level that capped upside since mid-April) and shuffling under April’s opening level at 107.76 on the H4 timeframe. As evident from the chart, recent movement led to an approach towards March’s opening level priced in at 107.38, closely intersecting with trend line support, extended from the low 105.98. Beyond here, traders will likely have May’s opening level in view at 107.12, followed by the 107 handle.
On the weekly timeframe, we can see price action hovering beneath the 2020 yearly opening level at 108.62. A rotation to the downside from current price has support at 104.70 to target.
Technical action on the daily timeframe recently shook hands with support at 106.95, after dipping from three-week tops at 107.76. Current movement, as you can see, is within striking distance of bringing in the 200-day SMA (orange – 108.26).
Areas of consideration:
Should the H4 candles test the point trend line support and March’s opening level at 107.38 merge today (green), a response may be seen. Upside targets fall in at April’s opening level at 107.76 and 108. Above here, we also have the 200-day SMA at 108.26 to consider, the 2020 yearly opening level at 108.62 and H4 Quasimodo resistance at 108.70.
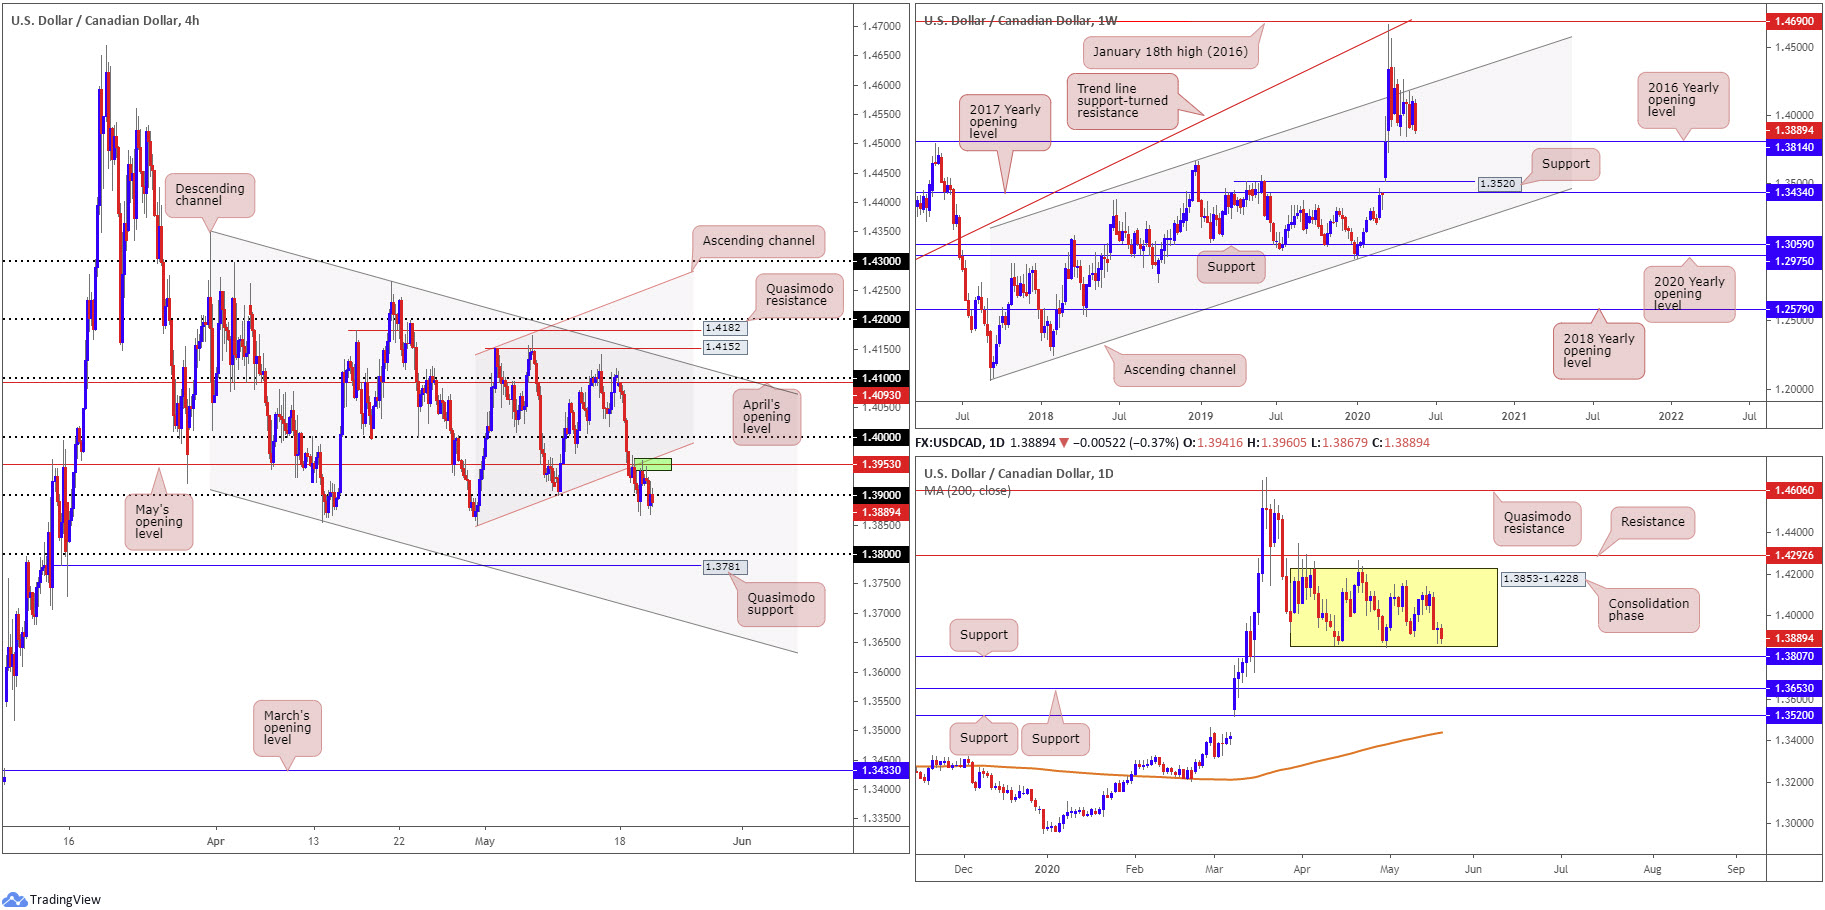
USD/CAD:
The Canadian dollar advanced Wednesday, in line with rising oil prices and a waning USD.
For traders who read Wednesday’s technical briefing you may recall the following piece (italics):
Reclaiming 1.39+ status could see H4 action form resistance off May’s opening level at 1.3953, positioned closely with H4 channel support-turned resistance (green).
As evident from the H4 timeframe, May’s opening level and intersecting channel resistance held price lower in recent trading, with price dipping south of 1.39 into the close. This shifts focus towards the 1.38 handle and Quasimodo support from 1.3781.
The story on the daily timeframe, nonetheless, has seen price action carve out a consolidation between 1.3853-1.4228 since April – current price trades within close proximity of range lows. Areas outside of the base can be found at resistance drawn from 1.4292 and support at 1.3807. In addition, traders will note the 200-day SMA (orange – 1.3438) has been drifting northbound since March.
The daily range is also visible on the weekly timeframe, forming mid-way between a long-standing channel resistance, taken from the high 1.3661, and support at the 2016 yearly opening level from 1.3814. The said base stands in a reasonably healthy position as, overall, we’ve been trending higher since September 2017.
Areas of consideration:
If 1.39 holds as resistance, the pendulum then appears to be swinging toward more of a decline today, with an expectation of reaching daily range lows at 1.3853 and maybe, with a little oomph, the daily support at 1.3807 and 1.38 handle.
Conservative sellers below 1.39 may seek additional bearish candlestick confirmation before taking action. Not only does this help confirm seller intent under 1.39, it provides structure to position entry and risk levels.
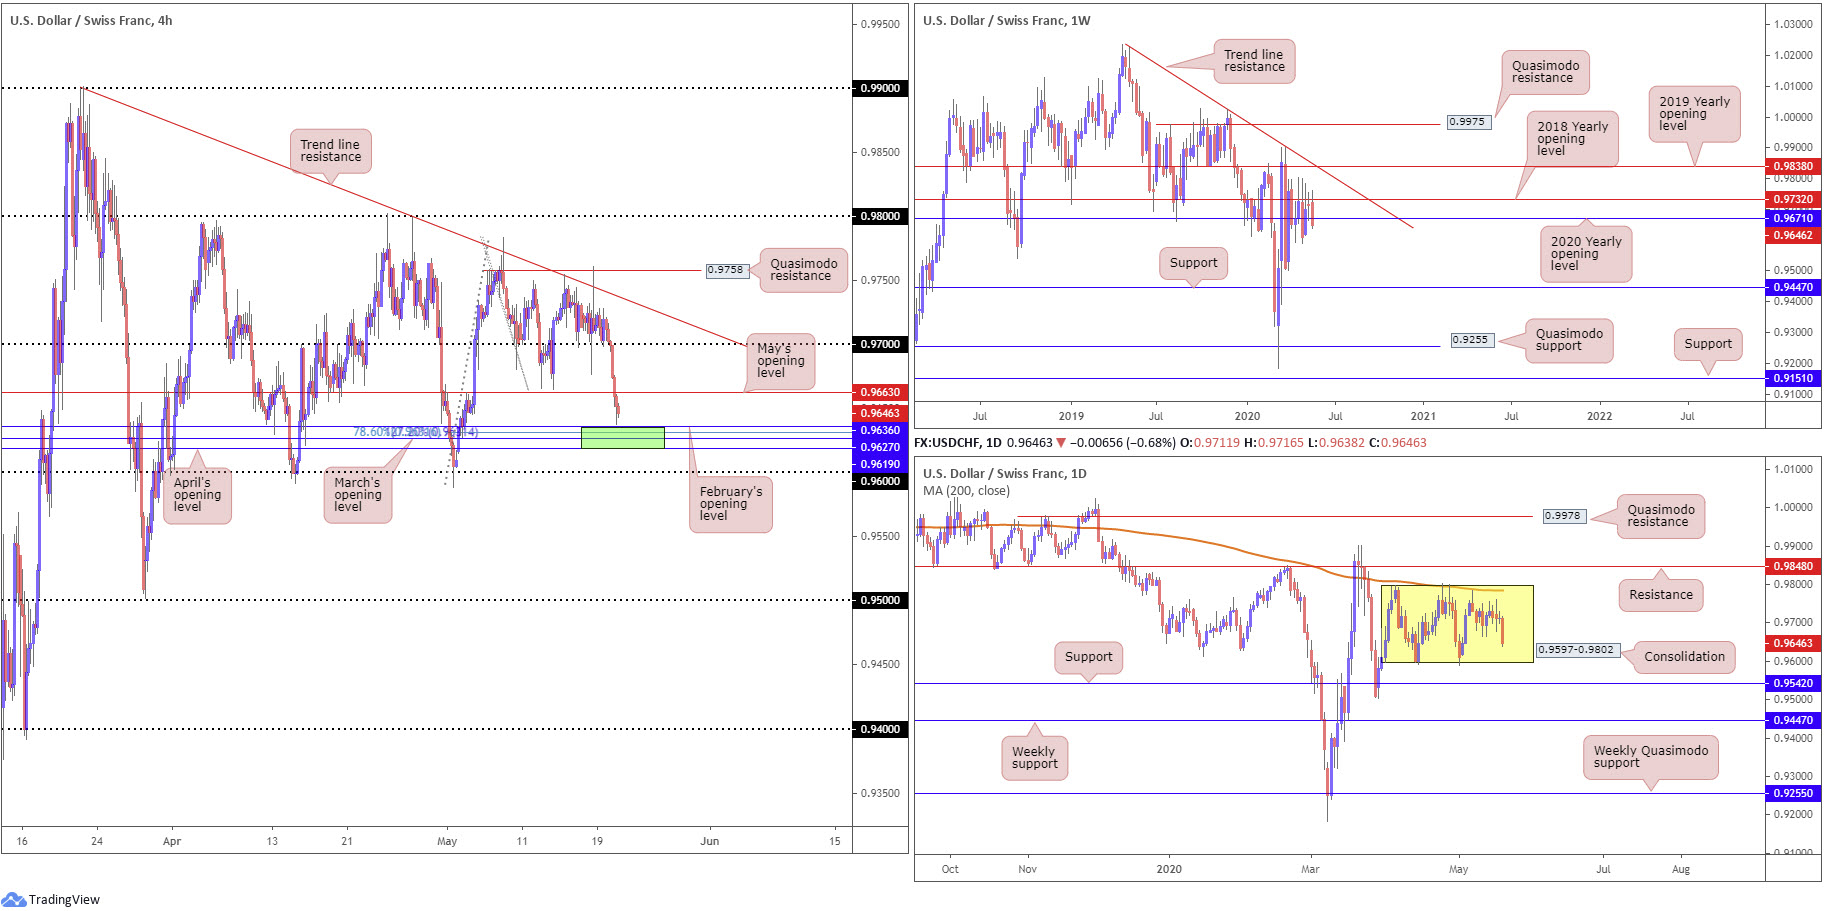
USD/CHF:
Against the Swiss franc, the US dollar plunged Wednesday, forming a near-full-bodied daily bearish candle and erasing more than 60 pips into the close.
Downside fuelled a break of 0.97 on the H4 timeframe, with follow-through selling taking out May’s opening level at 0.9663 and throwing light on 0.9619/0.9636, an area made up of April, March and February’s opening levels. In addition, hiding inside the said area we have a 127.2% Fibonacci extension point at 0.9631 along with a 78.6% Fibonacci retracement ratio at 0.9633.
Shifting focus to the weekly timeframe reveals recent downside violated the 2020 yearly opening level at 0.9671, after failing to overthrow the 2018 yearly opening level at 0.9732.
Since early May, price action on the daily timeframe has seesawed between gains/losses, inside a month-long range between 0.9802/0.9597. In recent sessions, however, we’ve seen buyers take a back seat, highlighting the lower edge of the aforementioned range low at 0.9597 as possible support today.
Areas of consideration:
0.9619/0.9636 (green), based on the H4 timeframe, given the support the area attracts, could appeal to buyers today.
Despite this, traders are urged to pencil in the possibility of a fakeout occurring through 0.9619/0.9636 to draw in 0.96. Not only is 0.96 a widely watched number by and of itself, it also comes with daily range lows around 0.9597.
To help avoid any fakeout scenario, traders may seek additional confirmation before pulling the trigger. This could be something as simple as a H4 bullish candlestick signal, to lower-timeframe structure, a trend line resistance break/retest, for example.
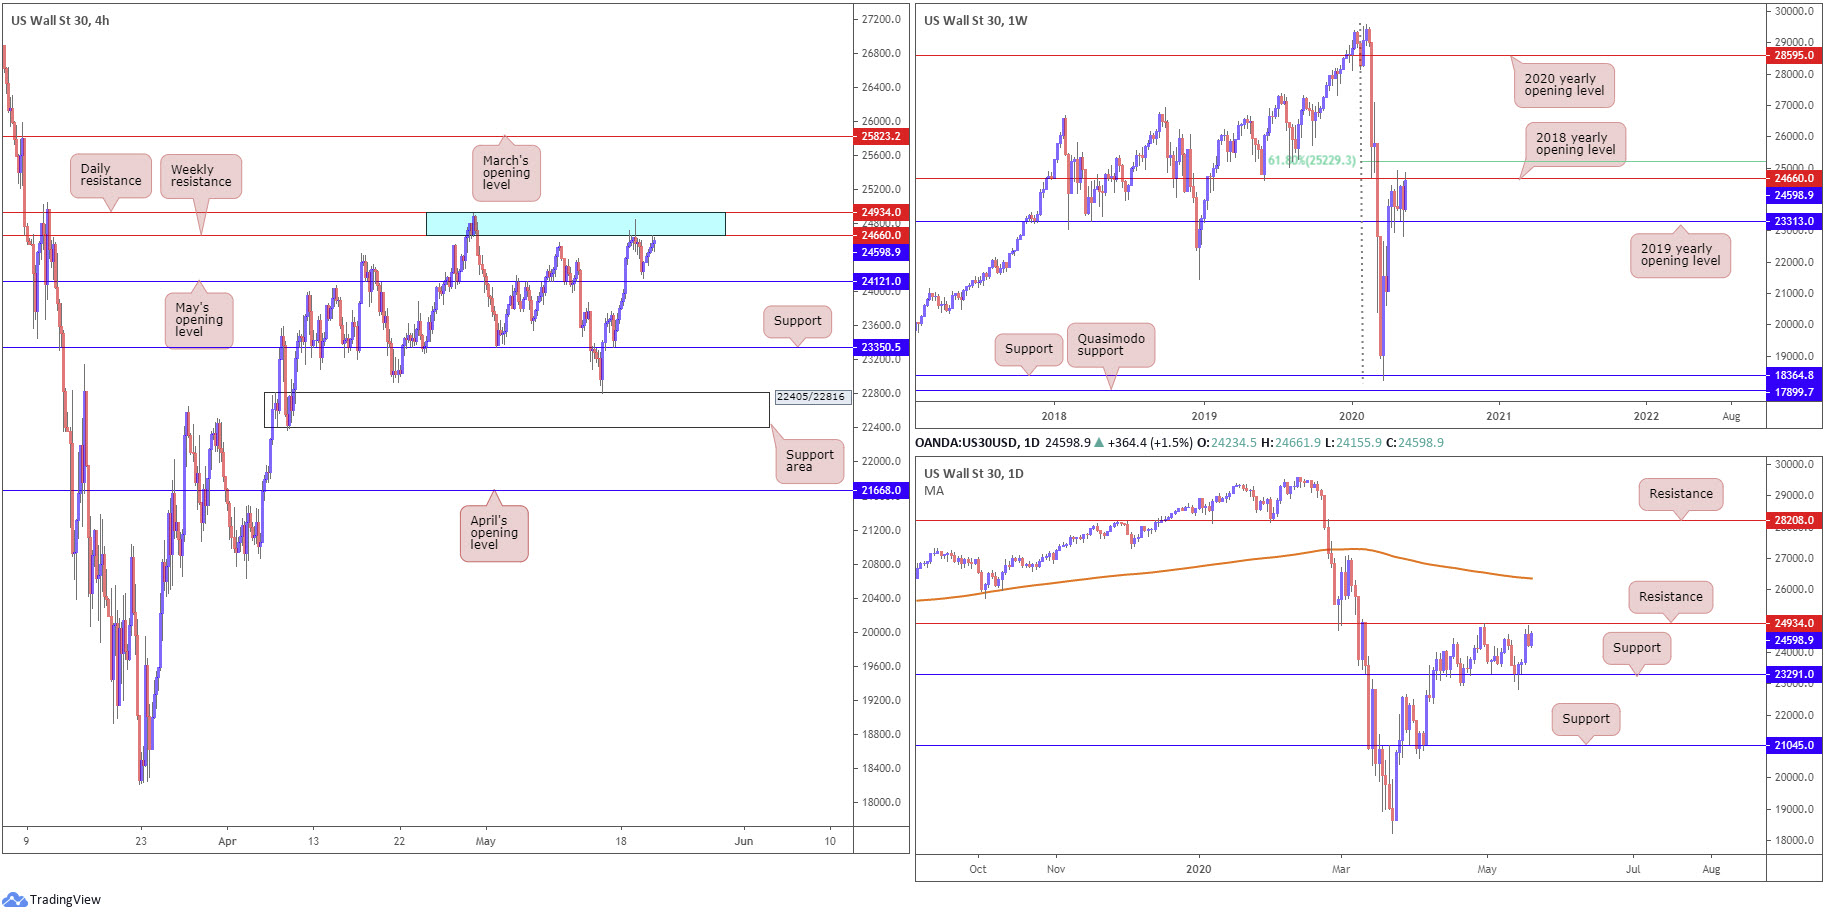
Dow Jones Industrial Average:
Major US benchmarks wrapped up Wednesday higher across the board amid upbeat quarterly earnings. The Dow Jones Industrial Average added 369.04 points, or 1.52%; the S&P 500 advanced 48.67 points, or 1.67%, and the tech-heavy Nasdaq 100 concluded higher by 186.48 points, or 2.01%.
A familiar area of resistance elbowed its way into the spotlight in recent trading, a zone comprised of a daily resistance level at 24934 and weekly resistance, by way of the 2018 yearly opening level, at 24660 (blue). May’s opening level at 24121 is visible as the next downside target on the H4 timeframe, while a break above the higher-timeframe base could eventually land March’s opening level at 25823.
Since mid-April on the weekly timeframe, price has been sandwiched between 23313 (2019 yearly opening level) and 24660, closely shadowed by a 61.8% Fibonacci retracement ratio at 25229. A violation of 23313 shines light on support from 18364, whereas the sky above 25229 is reasonably clear back to the 2020 yearly opening level at 28595.
A similar picture is present on the daily timeframe, only resistance rests at 24934 and support at 23291. Beyond resistance we have the 200-day SMA (orange – 26357) lurking close by, whereas through support we may find another layer of support emerge at 21045.
Areas of consideration:
In light of where we’re trading from on the higher timeframes, between 24934/24660, a violation of May’s opening level at 24121 is still possible, despite H4 price bottoming ahead of the angle on Wednesday.
24934/24660, therefore, is a platform to consider shorts from today, with a break beneath 24121 underlining H4 support at 23350, followed by H4 support at 22405/22816.
Should buyers remain in the driving seat, nevertheless, we could see a move above 24934, rattling breakout buyers. However, do be aware, the weekly 61.8% Fibonacci retracement ratio at 25229 could hamper upside.
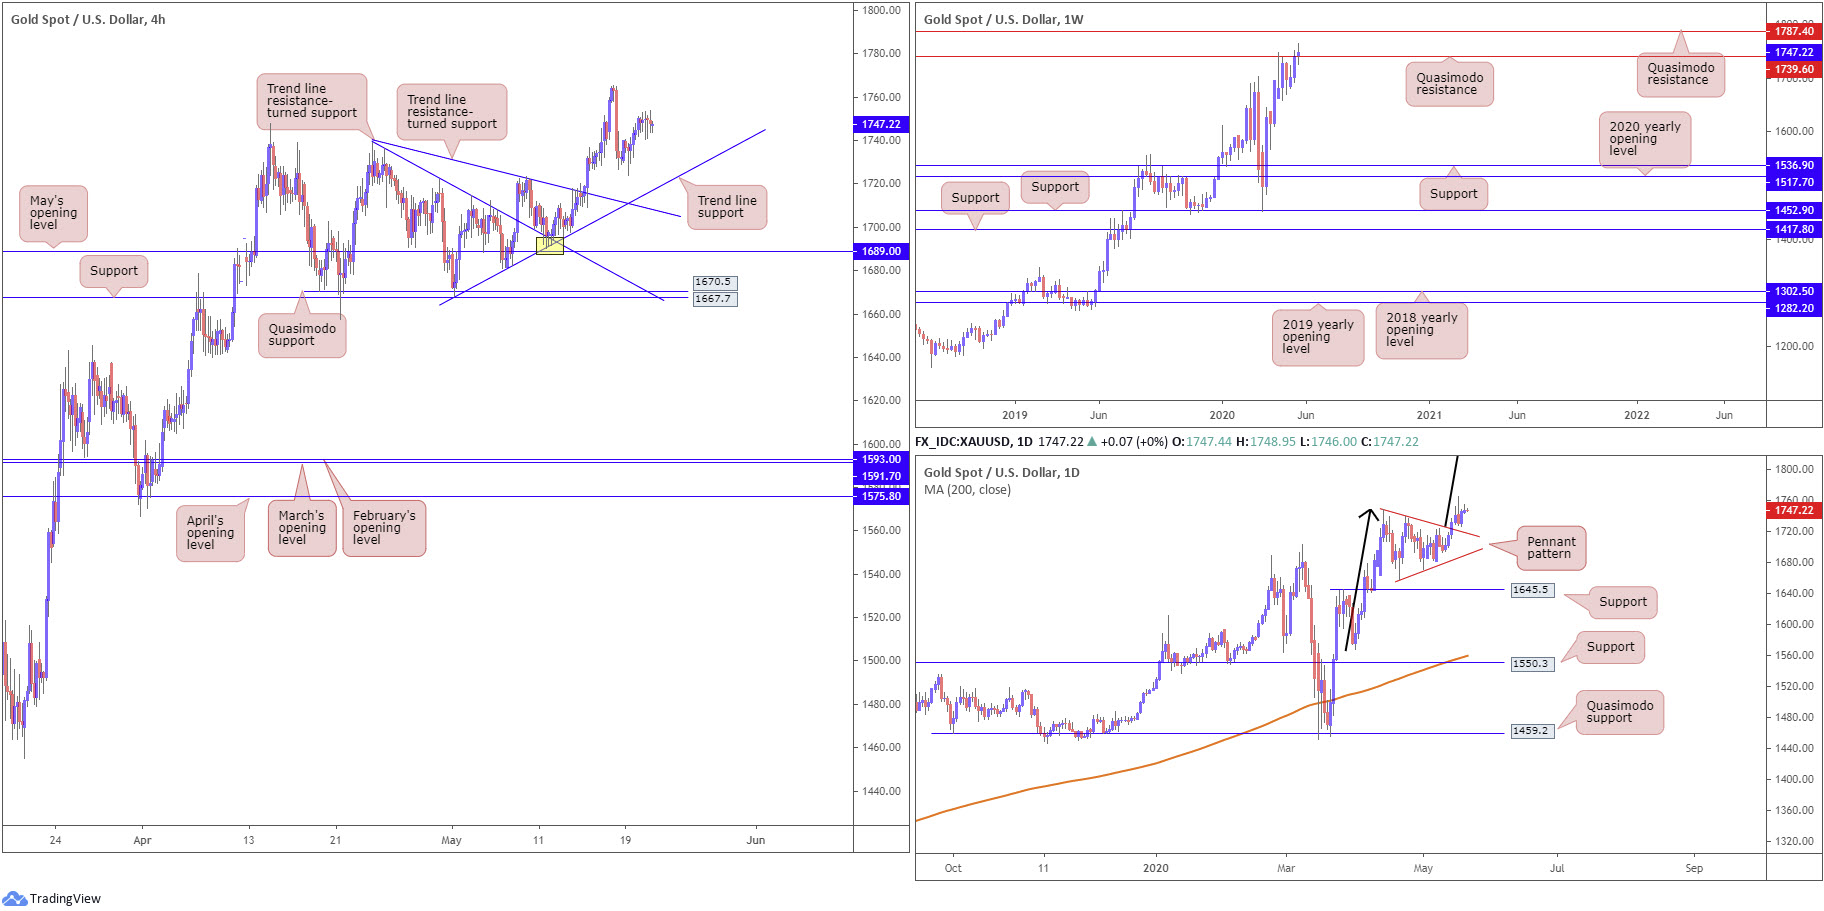
XAU/USD (GOLD):
Spot gold, in $ terms, struggled to establish direction Wednesday, ultimately concluding the session muted. The risk-on tone weighed on upside attempts, while on the other side of the coin, persistent USD weakness helped limit downside.
Given the lacklustre performance, much of today’s technical report will echo thoughts put forward in Wednesday’s piece.
Coming from the top this morning, the technical landscape on the weekly timeframe shows price attempting to establish position above Quasimodo resistance at 1739.6. Clearance of this level perhaps places another layer of Quasimodo resistance on the hit list at 1787.4. It may also interest some traders to note the trend on gold has faced a northerly trajectory since 2016.
In conjunction with weekly buyers showing spirit above Quasimodo resistance, chart pattern traders on the daily timeframe will note the recently formed pennant pattern, established from a high of 1747.7 and a low of 1658.1, had its upper boundary breached into the later stages of last week. Take-profit targets out of these patterns are measured by taking the preceding move (black arrows) and adding the value to the breakout point. As you can see, this is a sizeable take-profit, coming in at 1909.4.
Across the page on the H4 timeframe, price is showing signs of recovery north of trend line support, extended from the low 1668.0. In order to help confirm upside on this scale, taking out Monday’s high at 1765.3 is needed.
Areas of consideration:
Testing trend line support, based on the H4 timeframe, would likely interest buyers in this market, having seen daily price crack through the upper edge of a pennant pattern and weekly flow attempting to regain a footing above 1739.6. Owing to trend lines being prone to fakeouts, though, traders may seek additional H4 candlestick confirmation before pulling the trigger.
The accuracy, completeness and timeliness of the information contained on this site cannot be guaranteed. IC Markets does not warranty, guarantee or make any representations, or assume any liability regarding financial results based on the use of the information in the site.
News, views, opinions, recommendations and other information obtained from sources outside of www.icmarkets.com.au, used in this site are believed to be reliable, but we cannot guarantee their accuracy or completeness. All such information is subject to change at any time without notice. IC Markets assumes no responsibility for the content of any linked site.
The fact that such links may exist does not indicate approval or endorsement of any material contained on any linked site. IC Markets is not liable for any harm caused by the transmission, through accessing the services or information on this site, of a computer virus, or other computer code or programming device that might be used to access, delete, damage, disable, disrupt or otherwise impede in any manner, the operation of the site or of any user’s software, hardware, data or property.


