
A note on lower timeframe confirming price action…
Waiting for lower timeframe confirmation is our main tool to confirm strength within higher timeframe zones, and has really been the key to our trading success. It takes a little time to understand the subtle nuances, however, as each trade is never the same, but once you master the rhythm so to speak, you will be saved from countless unnecessary losing trades. The following is a list of what we look for:
- A break/retest of supply or demand dependent on which way you’re trading.
- A trendline break/retest.
- Buying/selling tails/wicks – essentially we look for a cluster of very obvious spikes off of lower timeframe support and resistance levels within the higher timeframe zone.
- Candlestick patterns. We tend to only stick with pin bars and engulfing bars as these have proven to be the most effective.
We search for lower timeframe confirmation between the M15 the H1 timeframes, since most of our higher-timeframe areas begin with the H4. Stops are usually placed 5-10 pips beyond confirming structures.
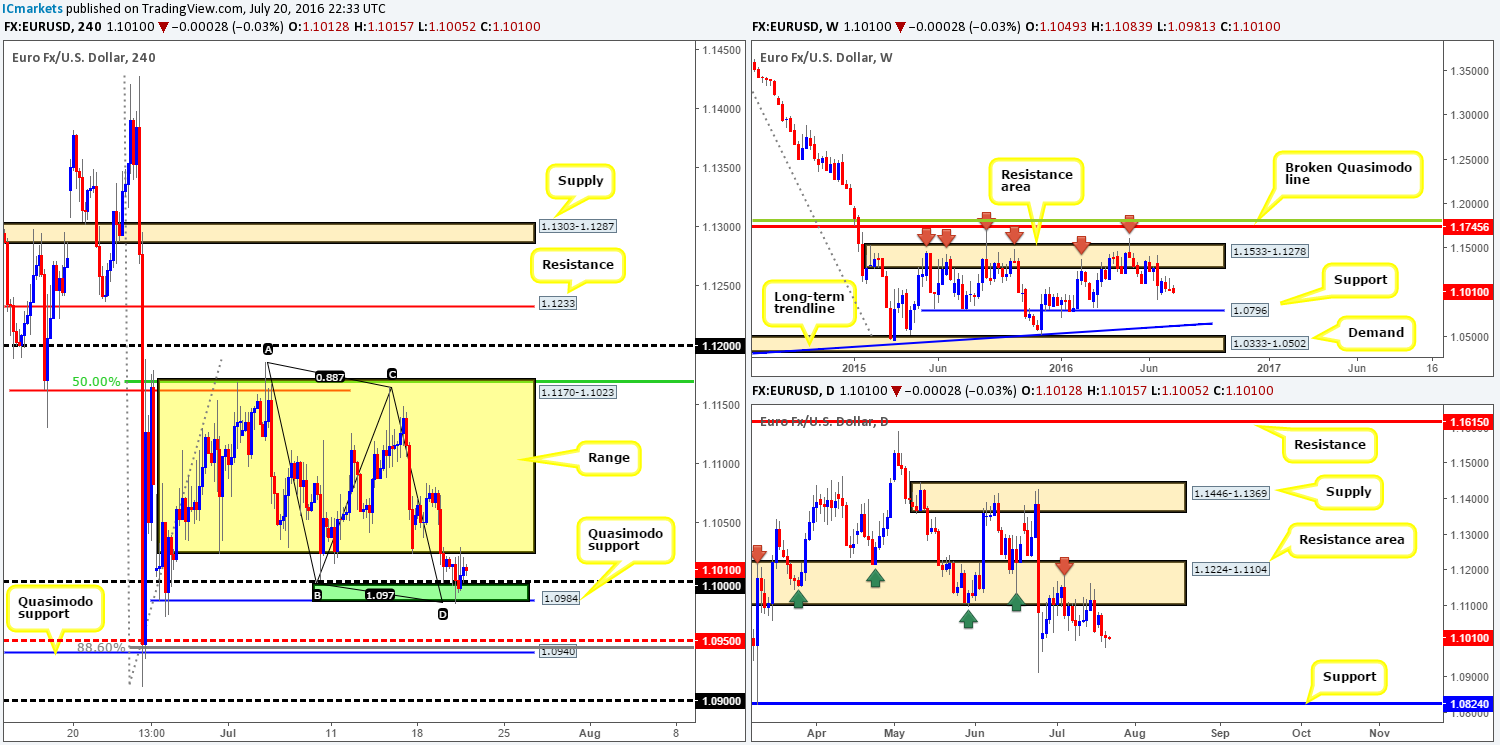
EUR/USD:
A quick recap of yesterday’s action shows that the EUR drove deep into a nearby H4 buy zone at 1.0984/1.10 (formed from a minor H4 Quasimodo support line at 1.0984, a H4 AB=CD completion point at 1.0979 and the 1.10 handle – green zone) and has so far seen a small rotation up to the 1.1023 region (underside of the H4 range seen at 1.1170-1.1023). As we mentioned in previous reports, the current H4 buy zone along with the H4 buy zone seen below at 1.0940/1.0950 (formed from a larger H4 Quasimodo support at 1.0940, a H4 88.6% Fib retracement line at 1.0945 and a H4 mid-way support at 1.0950) are areas we believe a BOUNCE will be seen before price continues driving lower.
The reason for believing lower prices remain the more likely route stems from what we’re seeing on the higher timeframes… The weekly chart shows space to move lower down to support drawn from 1.0796, while down on the daily chart the major is being held lower by a daily resistance area at 1.1224-1.1104. Apart from the referendum low seen at 1.0911, there’s little support stopping price from reaching the daily support chalked in at 1.0824.
Considering a bounce has already taken place at the current H4 buy zone, we expect price to potentially drive lower today and cross swords with the lower H4 buy area. Again, if you’re looking to trade this area, do bear in mind that a bounce is all that’s expected, so be sure to adopt aggressive trade management!
Levels to watch/live orders:
- Buys: 1.0940/1.0950 [Tentative – confirmation required] (Stop loss: dependent on where one confirms this area).
- Sells: Flat (Stop loss: N/A).
GBP/USD:
Following stronger than expected UK employment data the GBP drove higher against its US counterpart yesterday, managing to reach highs of 1.3226 on the day. Prior to this however, H4 demand at 1.3104-1.3144 suffered a rather brutal fakeout, which was likely a move to take out sell stops to buy into.
In view of price now seen trading above the 1.32 hurdle, there’s a chance that the shared currency will likely continue to push up to the H4 supply zone at 1.3314-1.3273 sometime today. However, this is a rough finger-in-the-wind assessment since the higher timeframe action still reflects somewhat of a bearish stance in our opinion. Over on the weekly chart, although renewed buying interest was seen the week before, the pair remains bearish after coming within a few pips of connecting with a resistance area penciled in at 1.3501-1.3804. By and large, we see little support to the left of current price until the market reaches the 1.20 region (we had to go all the way back to 1986 to find this). In line with weekly expectations of further selling, daily price recently struck supply at 1.3533-1.3426 (glued to the underside of the aforementioned weekly resistance area), and is currently holding this unit lower. In the event that this zone continues to suppress buying, a move down to the 1.30 area is very likely we feel.
Our suggestions: Neither a long nor short seems attractive at this time. Buying up to the aforementioned H4 supply puts one against potential higher timeframe sellers, whilst selling at current price is difficult due to both the 1.32 handle and the H4 demand base mentioned above at 1.3104-1.3144.

Levels to watch/live orders:
- Buys: Flat (Stop loss: N/A).
- Sells: Flat (Stop loss: N/A).
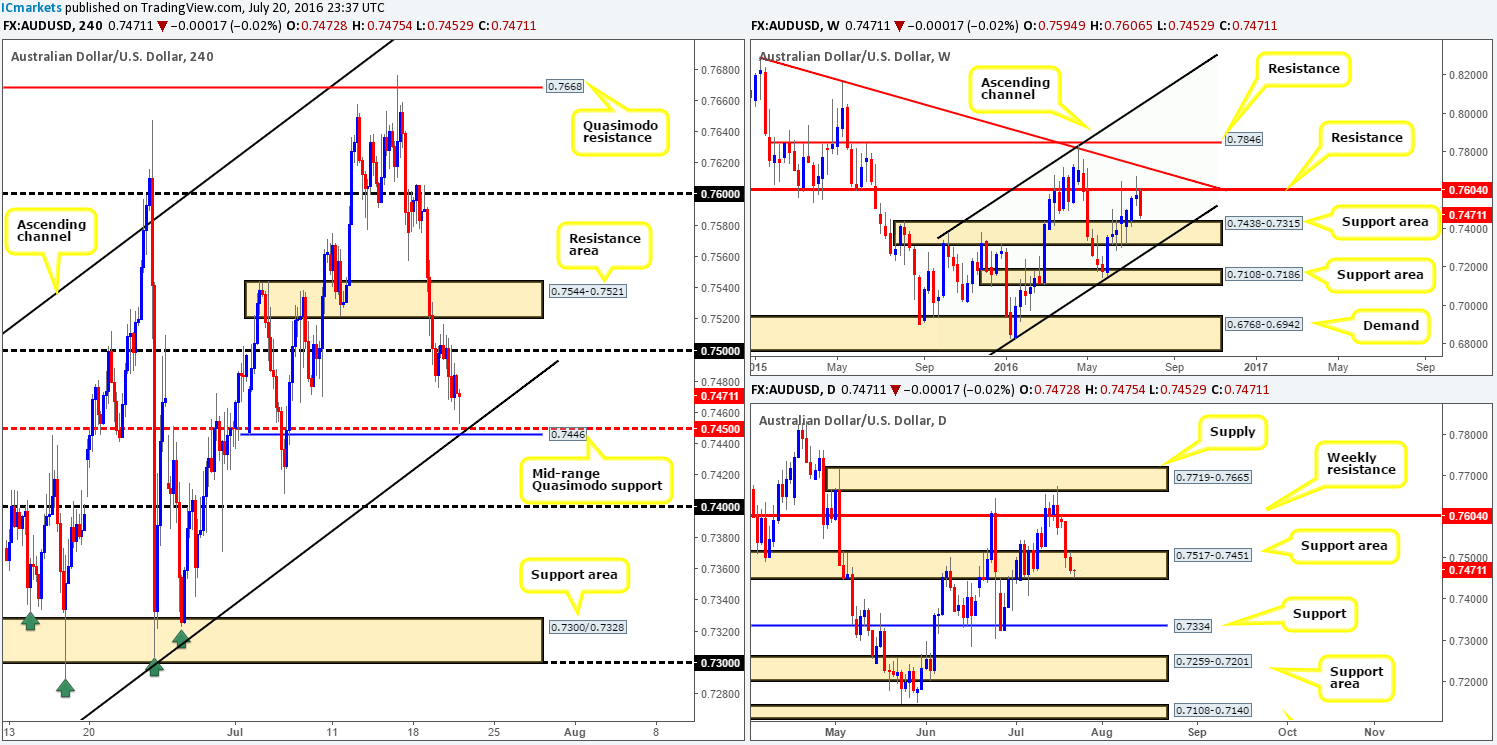
AUD/USD:
Since weekly action whipsawed through the weekly resistance level at 0.7604 last week, this has sent the commodity-linked currency into something of a free-fall. However, with prices now seen trading within touching distance of a weekly support area coming in at 0.7438-0.7315, we may begin to see this pair shortly bottom out. From the daily chart, the Aussie is showing some promise within the extremes of a daily support area at 0.7517-0.7451, which sits only a few pips above the aforementioned weekly support area.
Despite the DJIA rallying to fresh highs yesterday, a highly correlated market with the Aussie dollar, the pair sold off from the 0.75 handle to lows of 0.7461 on the day. What is also interesting on the H4 chart is that price came within a few pips of connecting with a H4 mid-way support line at 0.7450. This – coupled with a mid-range H4 Quasimodo support at 0.7446, an ascending H4 channel support line taken from the low 0.7148 and merging with a daily support area, makes this an awesome place to look for a bounce!
Our suggestions: Despite price coming so very close to 0.7450, our team still recommends keeping a close eye on this number today since there’s still a chance that price could pull back. Nevertheless, we would advise only trading this barrier should one be able to pin down a lower timeframe entry. This could be in the form of an engulf of supply followed by a subsequent retest, a trendline break/retest or simply a collection of well-defined buying tails around the 0.7450 region. Stops are usually placed 5-10 pips beyond confirming structures and in this case preferably beyond the H4 channel support line.
Levels to watch/live orders:
- Buys: 0.7450 region [Tentative – confirmation required] (Stop loss: dependent on where one confirms this area).
- Sells: Flat (Stop loss: N/A).
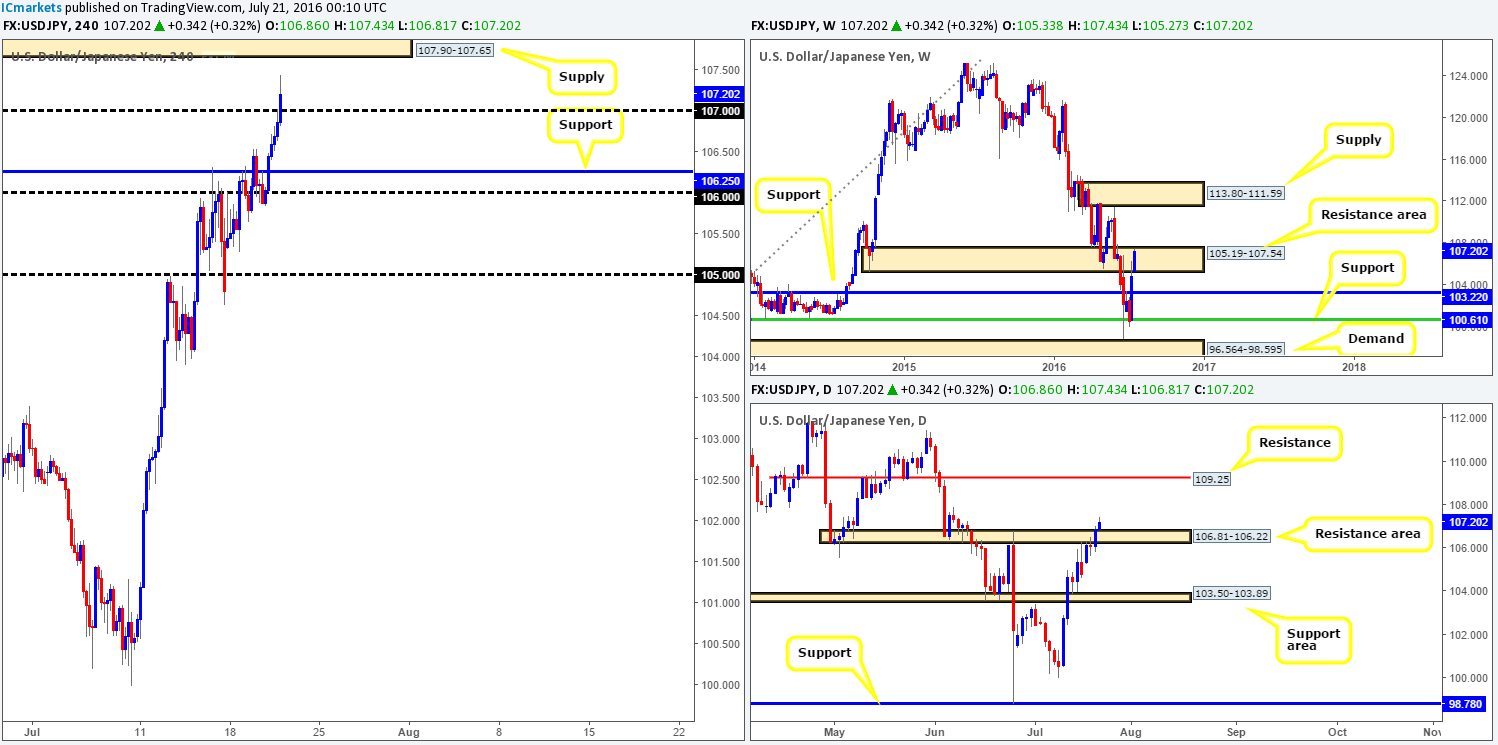
USD/JPY:
Starting from the top this morning, we can see that weekly movement is now trading within the extremes of a weekly resistance area drawn from 105.19-107.54. As of yet there has been very little bearish intention registered within this zone. Turning our attention to the daily chart, however, the candle action shows that price has broken above a daily resistance area given at 106.81-106.22. Although it may be tempting to buy the breakout here, one needs to tread carefully as this could simply be a fakeout to drive lower, since let’s not forget that the pair is still encapsulated within a weekly resistance area!
Given the recent bout of buying seen on the DJIA, it was no surprise to see the yen decline in value yesterday. As we write, the USD/JPY is seen loitering above the 107 handle and positioned relatively close to a H4 supply base logged in at 107.90-107.65.
Our suggestions: In that there’s a possibility that price may fakeout above the current daily resistance area at 106.81-106.22, selling from the H4 supply zone at 107.90-107.65 could be a possibility today. However, we would recommend waiting for lower timeframe confirmation here before risking capital as one can never be sure whether this is a genuine fakeout or simply a continuation move (see the top of this report for lower timeframe entry techniques). Furthermore, take note that the H4 supply is positioned just above the current weekly resistance area which means to trade from here price would need to spike above this higher timeframe area!
Levels to watch/live orders:
- Buys: Flat (Stop loss: N/A).
- Sells: 109.90-107.65 [Tentative – confirmation required] (Stop loss: dependent on where one confirms this area).
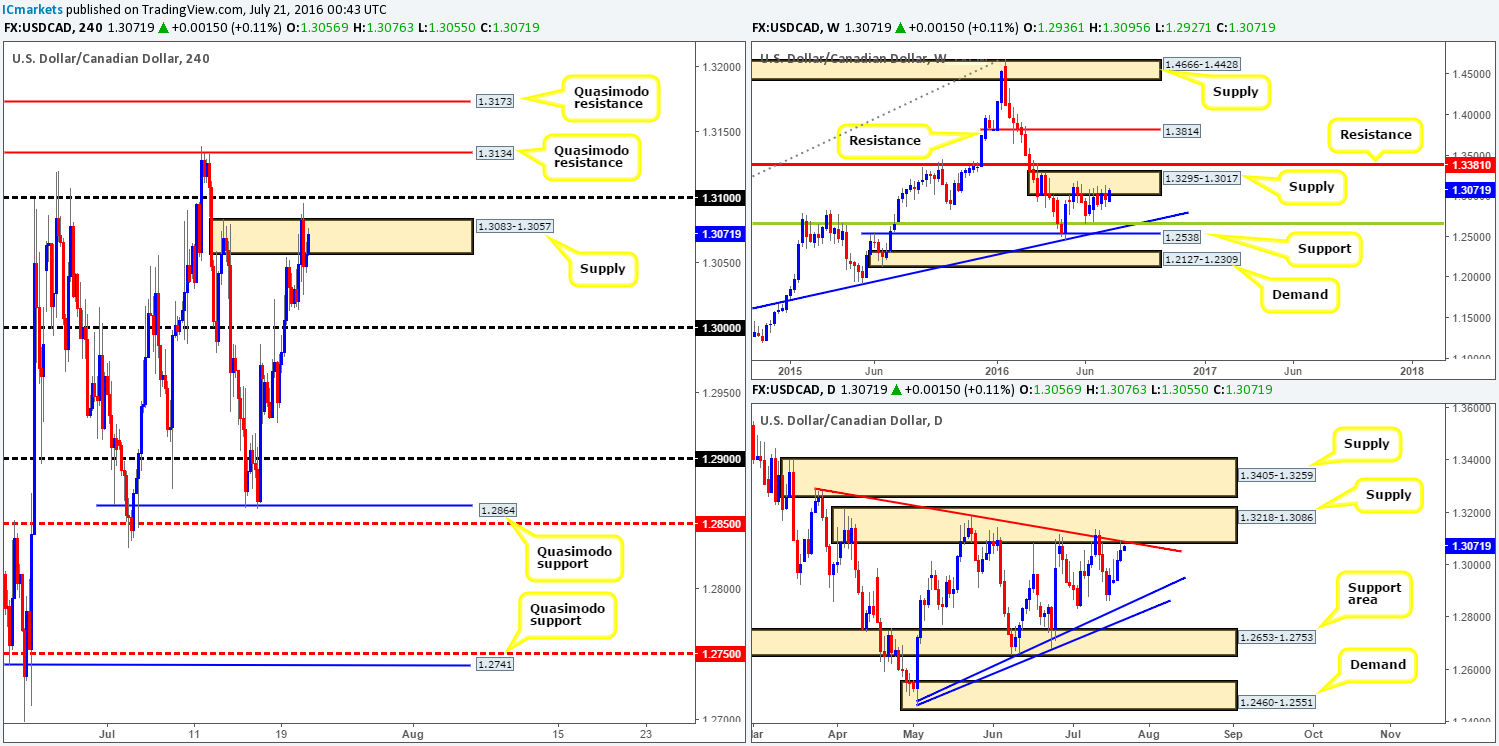
USD/CAD:
During the course of yesterday’s trading, the USD/CAD pair whipsawed through H4 supply at 1.3083-1.3057 going into the US session. With the majority of the sellers around this area now likely consumed, it is possible we may see the loonie appreciate up to the 1.31 handle or one of the two H4 Quasimodo resistance levels at 1.3134/1.3173 sometime today.
Taking into account that daily price recently struck the daily supply at 1.3218-1.3086 (bolstered by a daily trendline resistance extended from the high 1.3295), and the weekly remains clinging to the underside of a weekly supply base drawn from 1.3295-1.3017, selling from either of the above said H4 levels in bold is a reasonable possibility in our opinion.
Our suggestions: Since it is almost impossible to know which of the above said H4 areas will bounce, if any, we recommend being patient and waiting for lower timeframe price action to from beforehand (see the top of this report). However, should price climb to the most extreme H4 Quasimodo resistance line at 1.3173, we would, depending on the time of day, enter with a market order since we then have the option of placing our stop above the current daily supply zone!
Levels to watch/live orders:
- Buys: Flat (Stop loss: N/A).
- Sells: 1.31 region [Tentative – confirmation required] (Stop loss: dependent on where one confirms this area). 1.3134 region [Tentative – confirmation required] (Stop loss: dependent on where one confirms this area). 1.3173 [Entering at market here is viable but is still dependent on the time of day] (Stop loss: 1.3220).
USD/CHF:
Despite finding some resistance around the H4 Quasimodo line at 0.9865, candle action broke through this barrier yesterday, taking out the 12th July highs at 0.9894 and tagging in H4 supply at 0.9920-0.9899 (boasts a deep H4 88.6% Fib resistance at 0.9906, as well as the 0.99 handle which represents a daily resistance line). While the sell off from here was respectable, the broken Quasimodo line is now acting as a support!
With the above in mind here’s what we currently have jotted down for possible upcoming trading opportunities:
- With weekly action loitering just ahead of a weekly supply zone coming in at 1.0092-0.9928, a push north could very well be seen today/tomorrow. And given that the H4 supply zone seen at 0.9950-0.9934 is glued to the underside of the above said weekly supply zone, a short from here is high probability!
- On the other side of the coin, daily price has recently tested a daily resistance line at 0.99, which fuses with a daily trendline resistance taken from the high 1.0092. This could halt further buying and potentially push this market south. For this to be a tradable move, however, the current H4 broken Quasimodo line would need to be consumed to allow price to test H4 demand seen marked with a green arrow at 0.9811-0.9828 (located on top of a daily support area at 0.9819-0.9784 – the next downside target on the daily timeframe).
Our suggestions: Should price close below and retest the H4 broken Quasimodo line, a short trade down to the aforementioned H4 demand is a high-probability move in our book. Nevertheless, should bids hold firm here and push prices higher as suggested on the weekly chart, look to short from the H4 supply zone at 0.9950-0.9934 using a market order with a stop placed a few pips above the zone.
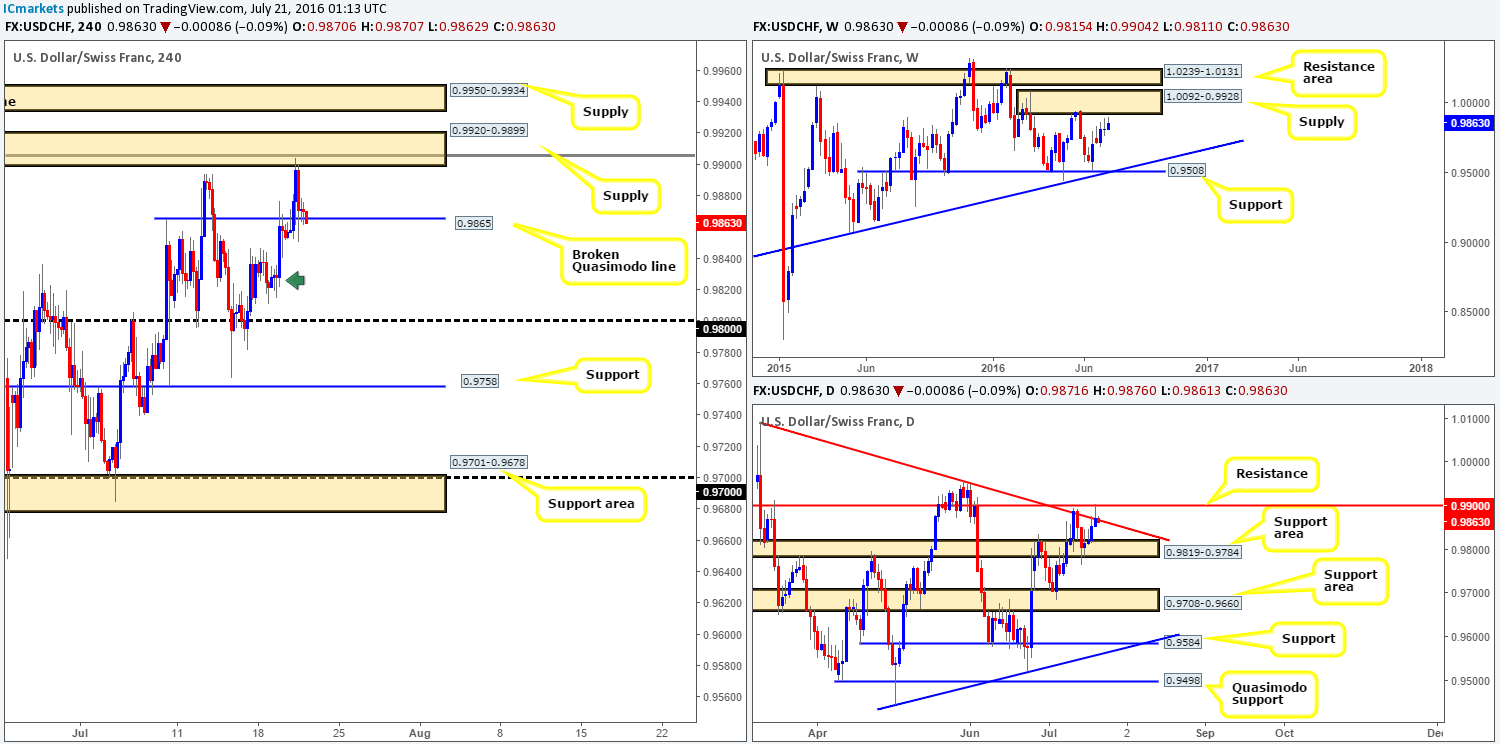
Levels to watch/live orders:
- Buys: Flat (Stop loss: N/A).
- Sells: Watch for price to close below the broken H4 Quasimodo line at 0.9865 and look to trade any retest seen thereafter (lower timeframe confirmation required). 0.9933 [Possible entry at market here depending on the time of day] (Stop loss: 0.9955).
DOW 30:
As can be seen from the weekly chart, US stocks continue to climb to fresh all-time highs following last week’s close above the weekly resistance area at 18365-18158 (now acting support). From simply looking at the weekly timeframe, we see two possibilities: the DOW continues to record new highs, or the index pulls back and retests the recently broken weekly resistance area as support. Looking down to the daily timeframe the picture is not all that different. The only slight variation is that price has the potential to pullback to a broken daily Quasimodo level at 18279, which is positioned within the above said weekly support area.
Stepping across to the H4 chart, price has recently chalked up a minor ascending channel (18462/18560). We personally would never consider shorting from the upper edge of this formation given the remarkable strength the bulls have shown over the past three weeks! We might consider buying from the lower edge of this channel, but it would need to be accompanied by a lower timeframe buy signal (see the top of this report for ideas on looking for lower timeframe entry points). The only other place we would consider buying this market from is the H4 demand zone coming in at 18309-18356. This base is housed nicely within the recently broken weekly resistance area at 18365-18158 (now an acting support area), and sits just above a broken daily Quasimodo level mentioned above at 18279. In addition to this, the tails seen marked on the H4 chart with a green arrow represent buying interest around this level, thus there is a strong possibility (given the higher timeframe picture as well) that there are unfilled orders still residing here. Despite this confluence, our team would still require a lower timeframe buy entry to form prior to risking capital, due to the possibility that price may fake beyond the aforementioned H4 demand into the broken daily Quasimodo line.
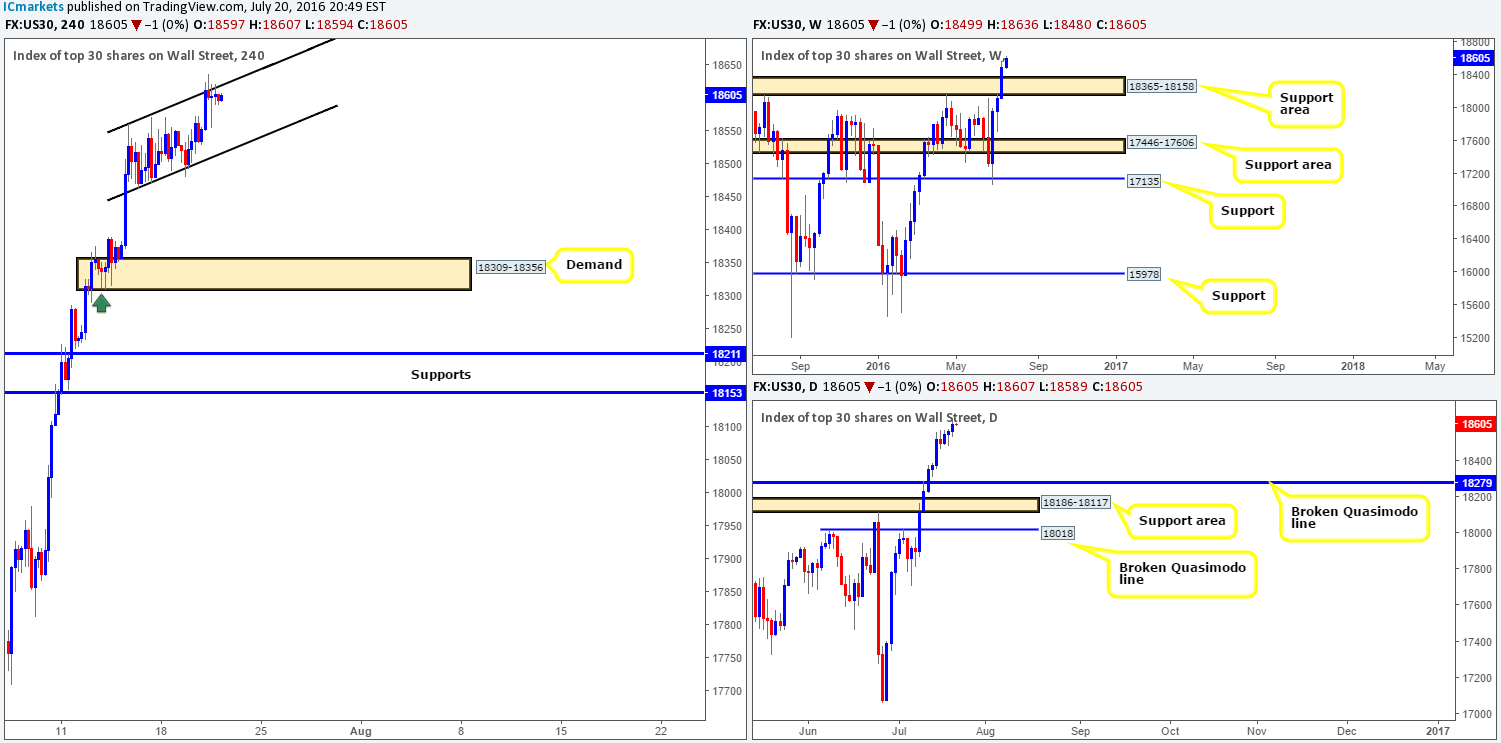
Levels to watch/live orders:
- Buys: H4 channel support taken from the low 18462 could be a nice line to consider buying from (lower timeframe confirmation required).18309-18356 [Tentative – confirmation required] (Stop loss: dependent on where one confirms this area).
- Sells: Flat (Stop loss: N/A).
GOLD:
Going into the early hours of yesterday morning the yellow metal aggressively tumbled lower, consequently breaking below the H4 pennant edge (1328.0) and eventually reaching lows of 1312.4 by the day’s end. This, as is shown on the H4 chart, took out H4 demand at 1312.6-1318.5 and came within touching distance of colliding with H4 support at 1310.3.
In light of this H4 support positioned deep within the current daily demand area at 1305.3-1322.8, and also set just above a weekly support base at 1307.4-1280.0, the pendulum looks to be swinging towards more of a rally at the moment. All of this coupled with a H4 AB=CD approach extended from the high 1347.0, makes for an awesome area to consider buying gold from today. The other key thing we wish to note is regarding stops. We feel that this H4 support level is confluent enough to justify entering at market. Given that weekly action shows room to move a tad lower today to touch gloves with the top-side of the weekly support area, stops would be safest set below the low marked with a green arrow at 1305.3. In regard to taking profit, we’d look to reduce risk and close out 50% of our position around the 1320.0 region, followed by the 1330.0 mark.
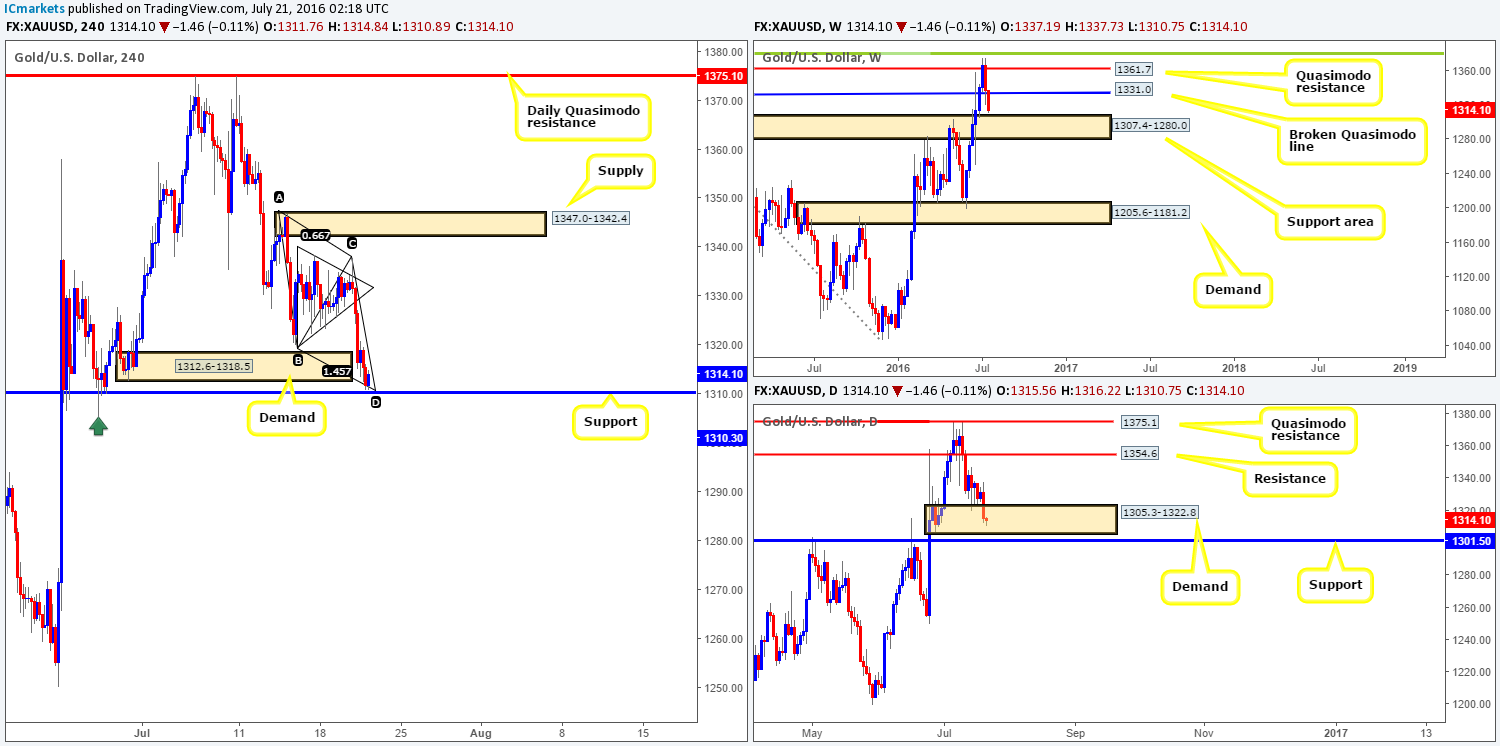
Levels to watch/live orders:
- Buys: 1313.7 [LIVE] (Stop loss: 1304.0).
- Sells: Flat (Stop loss: N/A).


