
A note on lower timeframe confirming price action…
Waiting for lower timeframe confirmation is our main tool to confirm strength within higher timeframe zones, and has really been the key to our trading success. It takes a little time to understand the subtle nuances, however, as each trade is never the same, but once you master the rhythm so to speak, you will be saved from countless unnecessary losing trades. The following is a list of what we look for:
- A break/retest of supply or demand dependent on which way you’re trading.
- A trendline break/retest.
- Buying/selling tails – essentially we look for a cluster of very obvious spikes off of lower timeframe support and resistance levels within the higher timeframe zone.
- Candlestick patterns. We tend to only stick with pin bars and engulfing bars as these have proven to be the most effective.
For us, lower timeframe confirmation starts on the M15 and finishes up on the H1, since most of our higher timeframe areas begin with the H4.
EUR/USD:
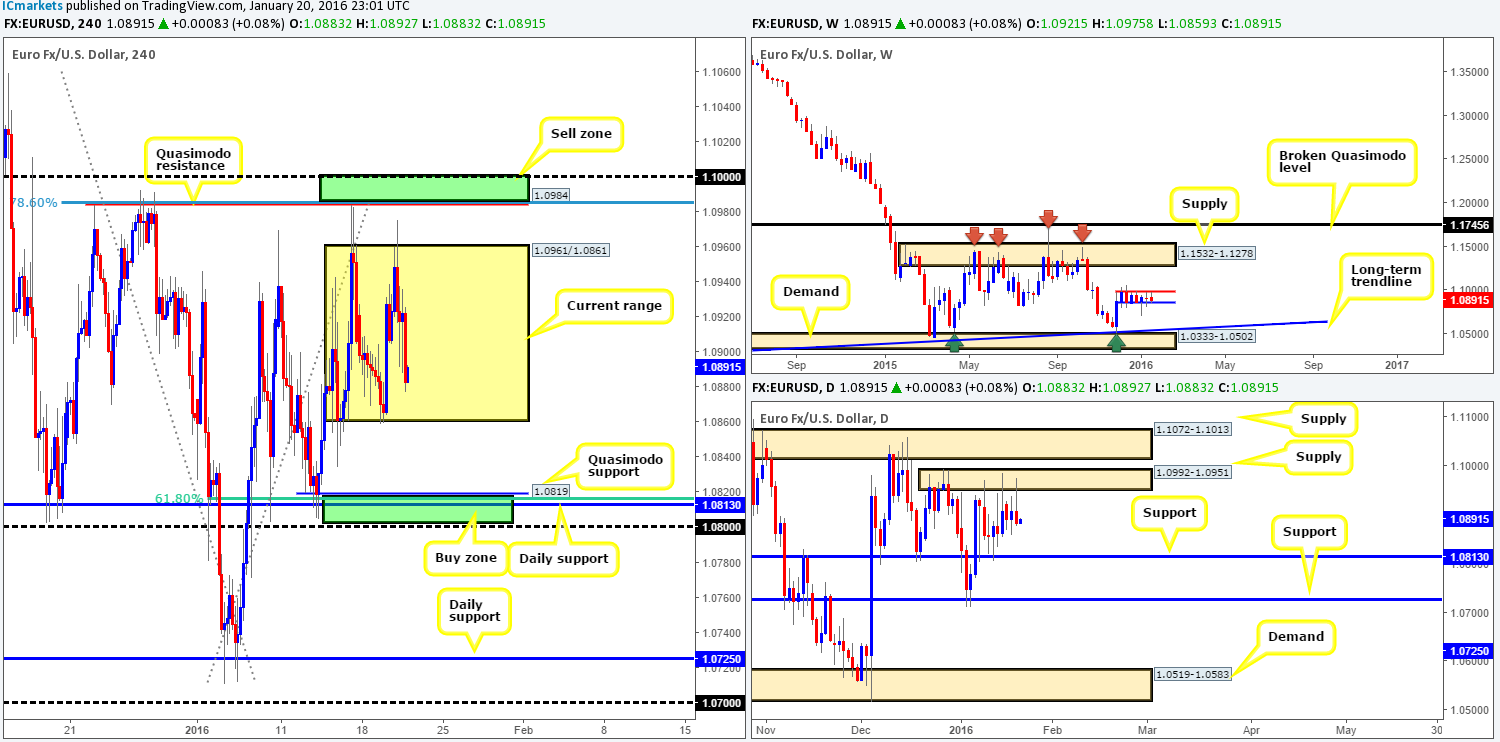
Based on recent price action, we can clearly see that the H4 timeframe has entered into a smaller phase of consolidation between 1.0961/1.0861. In light of this, the team decided to close the remaining 30% of our short position taken on Friday from 1.0983 at the psychological support 1.0900 – the risk/reward still worked out very nicely!
Given this newly created range, how do things stand on the higher timeframes? Well, weekly movement remains confined between 1.0983/1.0851 (blue/red lines) which has been the case since Dec 7th 2015. Down on the daily chart, however, price has been capped by a supply seen at 1.0992-1.0951 and a support level drawn from 1.0813 since Jan 8th 2016.
On account of the above, shorts from the H4 range resistance 1.0961 is certainly a possibility due to it converging nicely with the above said daily supply (lower timeframe confirmation required). Despite this, a fakeout above this line is highly likely in our opinion, as directly above hangs a H4 Quasimodo resistance level at 1.0984, a Fibonacci level at 1.0985 and a psychological resistance barrier at 1.1000. All of this coupled with price sitting within the extremes of the aforementioned daily supply, and also fusing beautifully with the weekly upper band at 1.0983 makes this a key sell zone zone to keep an eye on.
With regards to buying this market, of course one can look to buy from the H4 range support at 1.0861 since this barrier converges nicely with the lower weekly band support perfectly (see above). Nevertheless, we would still advise waiting for the lower timeframes to prove buying strength exists here before risking capital. Reason being is below sits a H4 a Quasimodo support at 1.0819, a psychological support at 1.0800, a 61.8% Fibonacci support at 1.0815 and the daily support we spoke about above at 1.0813, consequently forming a key buy zone to keep a tab on.
Levels to watch/live orders:
- Buys: 1.0861 [Tentative – confirmation required] (Stop loss: dependent on where one confirms this level). 1.0819/1.0800 [Tentative – confirmation preferred] (Stop loss: dependent on where one confirms this area).
- Sells: 1.0961 [Tentative – confirmation required] (Stop loss: dependent on where one confirms this level). 1.0984/1.1000 [Tentative – confirmation preferred] (Stop loss: dependent on where one confirms this area).
GBP/USD:
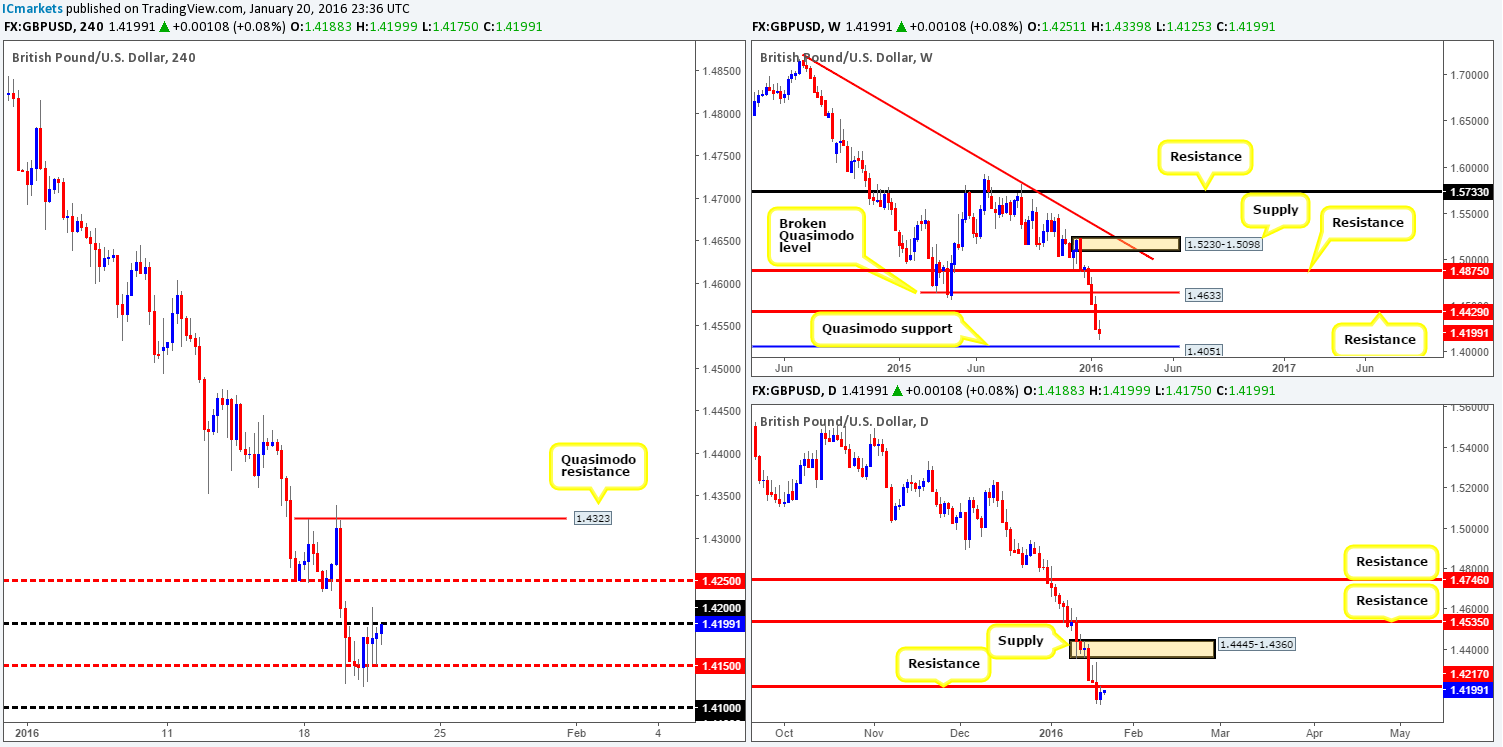
Following Tuesday’s 150-pip decline, the balance of bids to offers between the mid-level number 1.4150 and psychological resistance 1.4200 appeared even going into the London/U.S. sessions yesterday. This slowdown may have been due to the mixed bag of news released for both the GBP and USD.
With the above in mind, where do we go from here? The recent buying pressure from 1.4150, at least for us, is still not enough to tempt buying this pair. The reasoning lies within the higher-timeframe structure. Notice that on the weekly chart, price remains free as a bird to drop lower to at least the 1.4051 region – a Quasimodo support. Furthermore, daily action, as you can probably see, is currently trading below resistance drawn from 1.4217. To that end, our prime focus today will be on looking for price to CLOSE below and retest 1.4150 as resistance. This will, as long as the lower timeframes are agreeable, allow us to short this market targeting psychological support 1.4100, followed closely by the aforementioned weekly Quasimodo support.
Levels to watch/live orders:
- Buys: Flat (Stop loss: N/A).
- Sells: Watch for bids to be consumed around 1.4150 and then look to trade any retest seen thereafter (lower timeframe confirmation required).
AUD/USD:
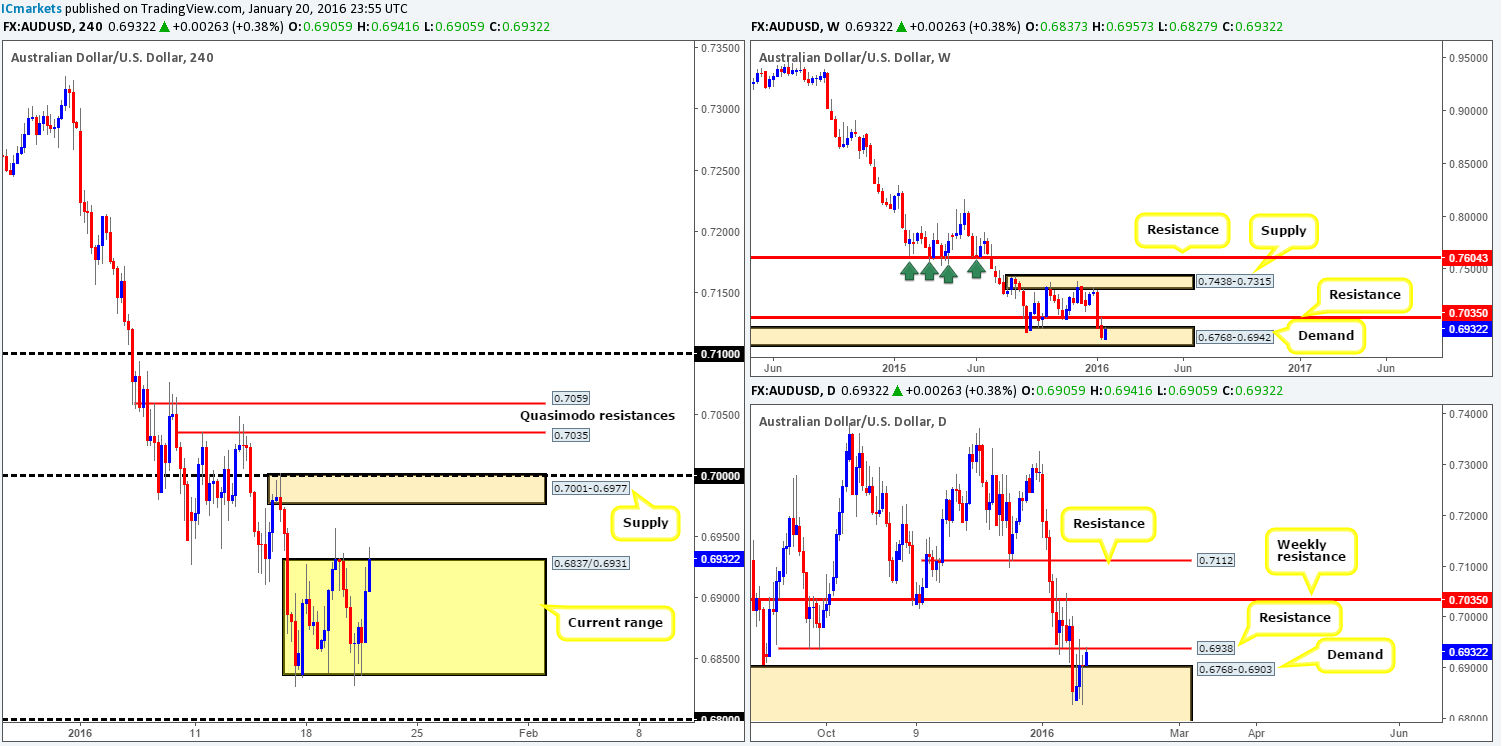
Shortly after yesterday’s London close the AUD/USD saw a relatively sharp increase in value. As can be seen on the H4 chart, this recent buying forced the commodity currency into a stage of consolidation between 0.6837/0.6931, and is at the time of writing testing the upper extreme of this boundary.
Speaking directly from the weekly charts, selling at this range resistance might not be such a good idea due to price currently being bought from demand at 0.6768-0.6942. However, when one scrolls down to the daily chart, it’s clear to see that resistance at 0.6938 is in play right now. Owing to higher timeframes usually overruling the lower timeframes, we’re going to side with the buy-side of this market today and anticipate a break above the current H4 range.
Should a clean break higher occur, this will effectively be our cue to begin watching for price to retest the broken line as support and buy with lower timeframe confirmation for an intraday bounce up to H4 supply at 0.7001-0.6977.
Levels to watch/live orders:
- Buys: Watch for a close above 0.6931 and look to trade any retest seen thereafter (lower timeframe confirmation required).
- Sells: Flat (Stop loss: N/A).
USD/JPY:
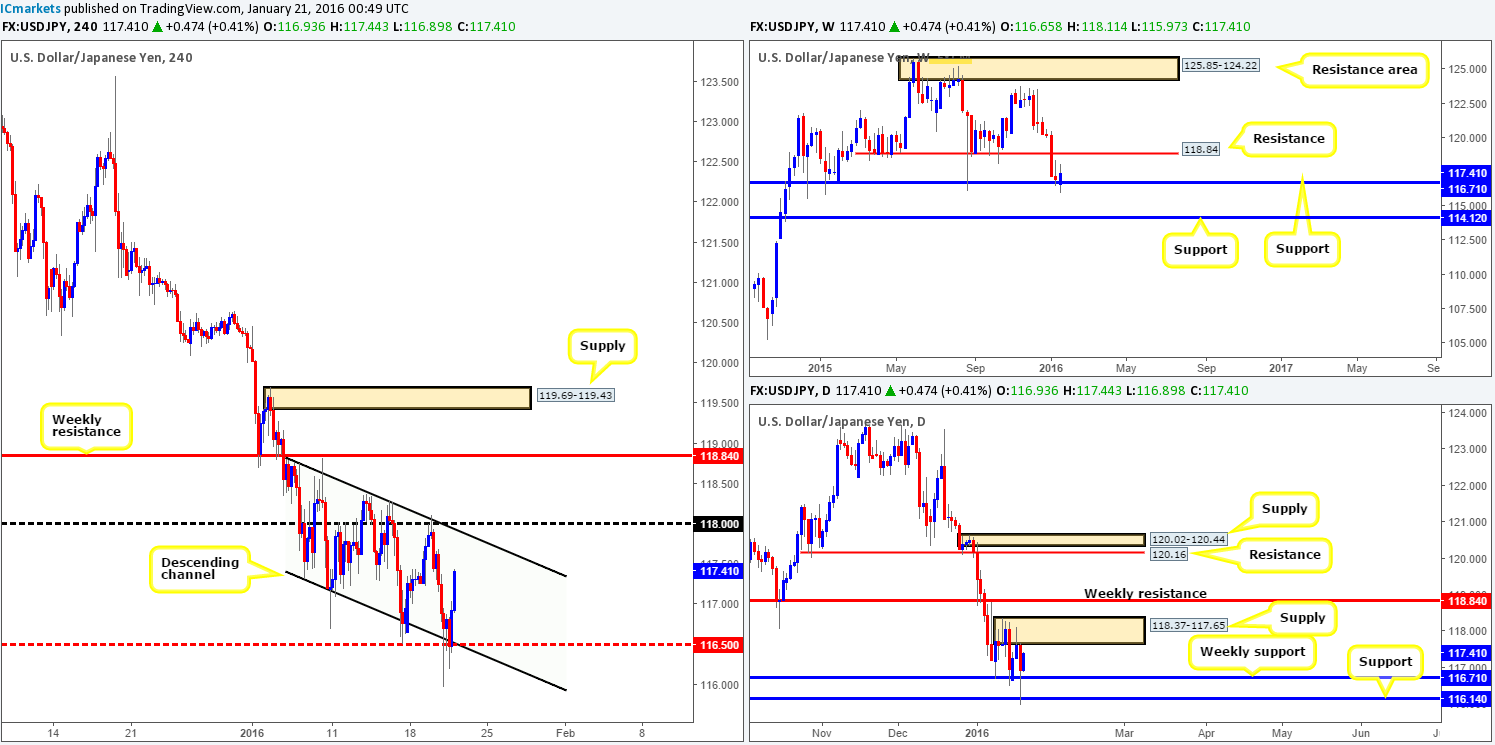
Consequent to Tuesday’s rebound from psychological resistance 118.00, the USD/JPY continued to drive lower during the early hours of trade yesterday. This selling brought prices down to the mid-level support 116.50 which, as you can see, ties in with the H4 channel support line taken from the low 117.32. It should not come as much of a surprise to see price bounce from here since there is additional strength coming in from both weekly and daily support (116.71/116.14).
With price now effectively trading mid-range between the current H4 descending channel (118.81/117.32), what’s likely in store for this market today? Well, with daily supply at 118.37-117.65 molded around the 118.00 number, there could be a chance to sell from here. In spite of this, caution is still advised due to where price is coming from – weekly support at 116.71! That being the case, we’d only consider shorts from 118.00 if the lower timeframe resistances are also seen holding firm.
Should this market remain well-bid today and close above 118.00, however, this would, as far as we see, consume the majority of offers residing within the current daily supply and open up the gates for prices to challenge weekly resistance at 118.84. In the event that this comes to fruition, and lower timeframe buying confirmation is seen following the retest, we would look to jump in long here targeting the weekly resistance.
Levels to watch/live orders:
- Buys: Watch for offers to be consumed around 118.00 and look to trade the any retest seen thereafter (lower timeframe confirmation required).
- Sells: 118.00 [Tentative – confirmation required] (Stop loss: dependent on where one confirms this level).
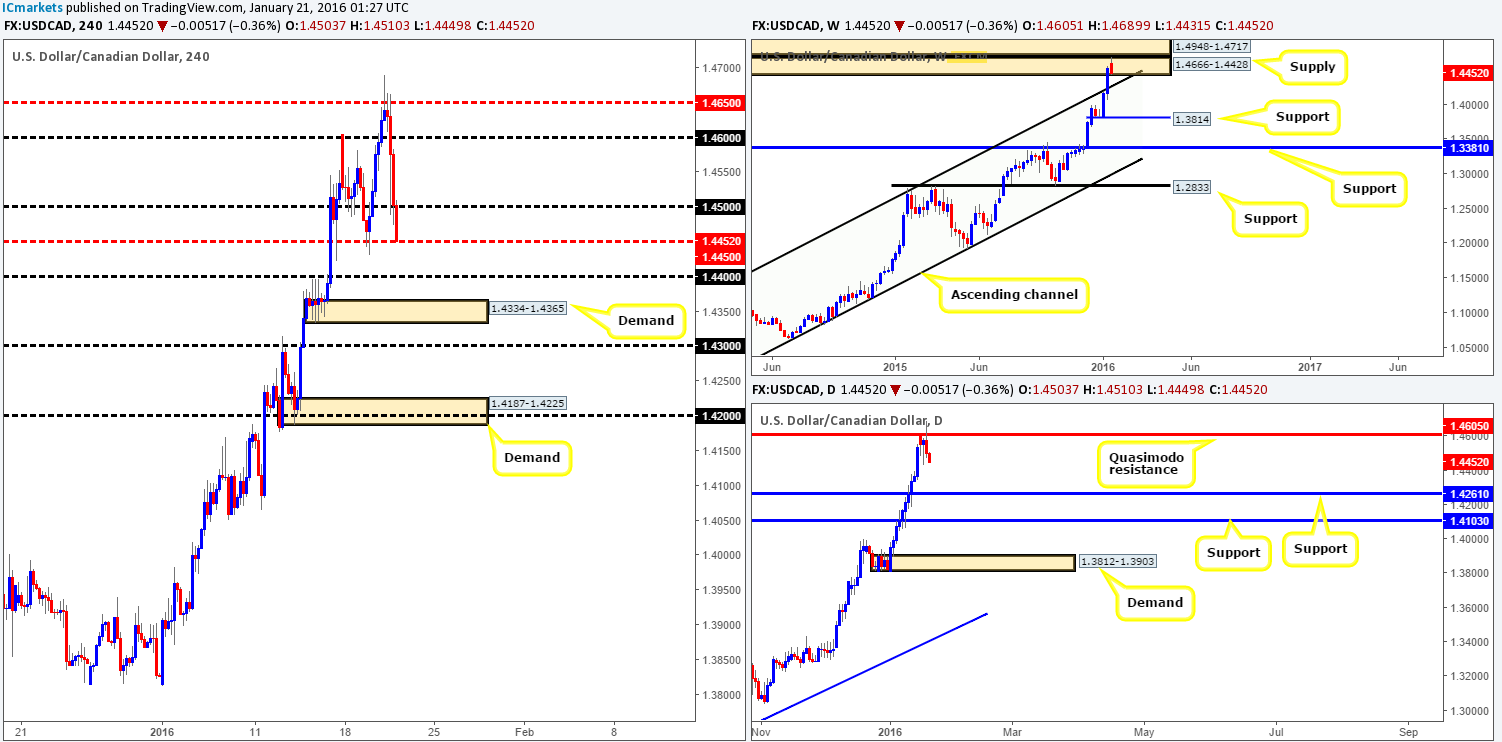
USD/CAD:
Initial action saw the Loonie advance north, closing above psychological resistance 1.4600 and connecting with a well-offered mid-level resistance 1.4650. However, it was from this number the pair snowballed south following the BoC’s decision to leave rates unchanged at 0.5%. This sell-off tore through 1.4600 and just recently broke below 1.4500 into mid-level support 1.4450
Technically, this decline in value makes logical sense where structure is concerned, as both weekly supply at 1.4666-1.4428 and the daily Quasimodo resistance at 1.4605 are in play now. Despite this, shorting this market right now with bids potentially lying in wait around 1.4450 might not be the best idea since this number held the market higher on two occasions already back on 15th Jan and the 19th Jan. In addition to this, let’s not forget that this pair is in a steep uptrend right now and one volatile down day is unlikely to change this flow. With that in mind, we’ll remain on the sidelines and wait for further developments before making any further decisions.
Levels to watch/live orders:
- Buys: Flat (Stop loss: N/A).
- Sells: Flat (Stop loss: N/A).


