
EUR/USD:
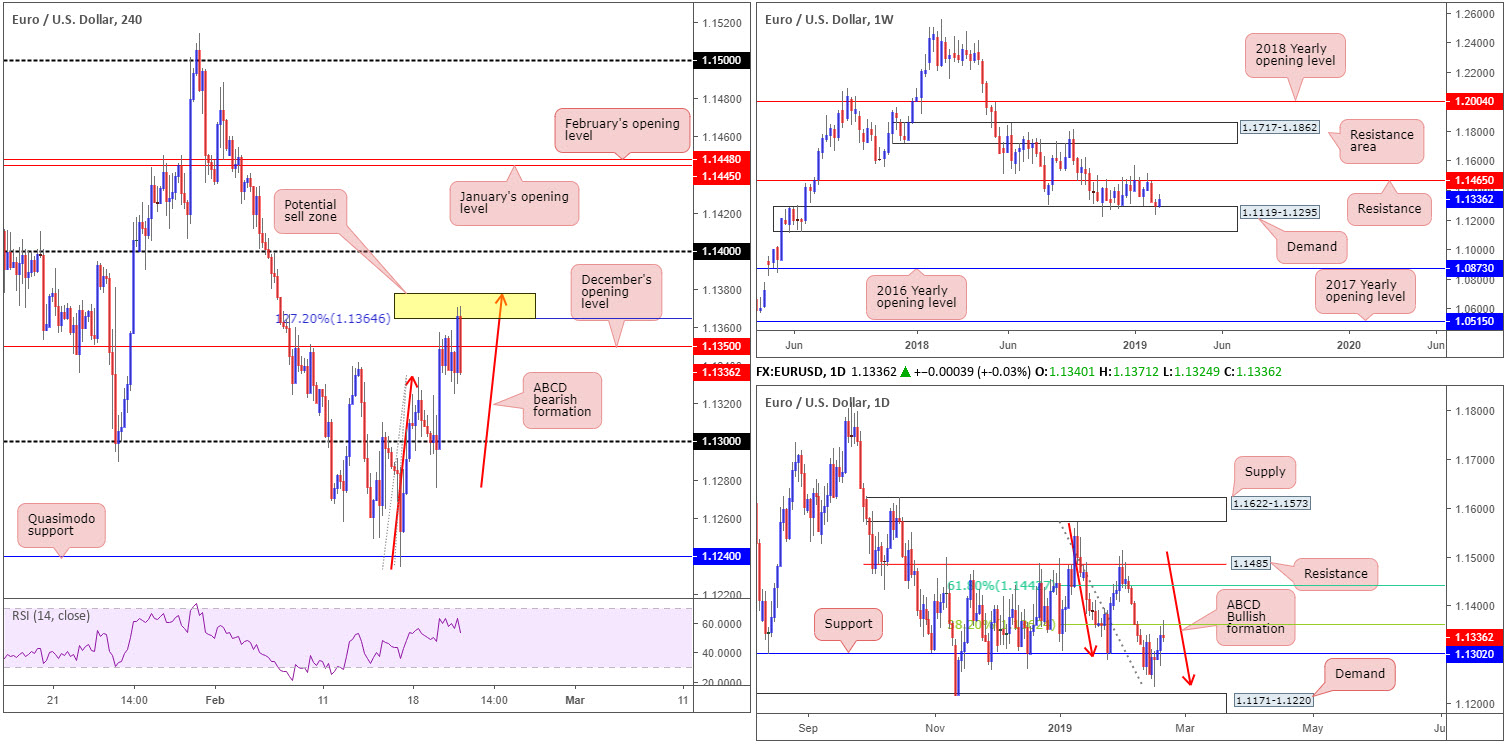
The EUR/USD observed a sharp change in mood following the release of Wednesday’s Federal Open Market Committee’s (FOMC) January meeting minutes. Several officials saw a 2019 rate hike as a possibility if the economy remains on track.
Although rising to a weekly peak of 1.1371, the pair turned southbound from the yellow zone marked on the H4 timeframe at 1.1377/1.1364: a H4 127.2% ABCD (red arrows) pattern. Well done to any of our readers who managed to jump aboard this sell as this was a noted area to watch in Wednesday’s piece.
What also attracted the team to the 1.1364ish neighbourhood was the daily timeframe. Daily price, after Friday’s movement shook hands with an ABCD bullish completion point (red arrows) around 1.1240 and engulfed resistance at 1.1302 (now acting support) Monday, challenged a 38.2% Fibonacci resistance value at 1.1362 in recent trade. 1.1362 is actually the first take-profit target for many traders long the daily ABCD formation, which merges with the H4 127.2% ABCD around 1.1377/1.1364.
Despite weekly price responding to the top edge of demand coming in at 1.1119-1.1295 (the lower edge of the current weekly range since late October 2018), the H4 candles are seen establishing ground beneath December’s opening level at 1.1350, consequently exposing 1.13 as a viable support to watch in today’s sessions (fuses with daily support at 1.1302).
Areas of consideration:
As highlighted in Wednesday’s briefing, a move out of 1.1377/1.1364 on the H4 timeframe is likely to at least retest 1.13. For folks who missed the initial shorting opportunity, a retest play at the underside of December’s opening level drawn from 1.1350 (preferably in the shape of a bearish pin-bar formation – entry/stops can then be defined based on this structure) could be a possibility today.
Today’s data points: French Flash Services PMI; French Flash Manufacturing PMI; German Flash Manufacturing PMI; German Flash Services PMI; EUR Flash Manufacturing PMI; EUR Flash Services PMI; ECB Monetary Policy Meeting Accounts; US Core Durable Goods Orders; US Durable Goods Orders; Philly Fed Manufacturing Index.
GBP/USD:
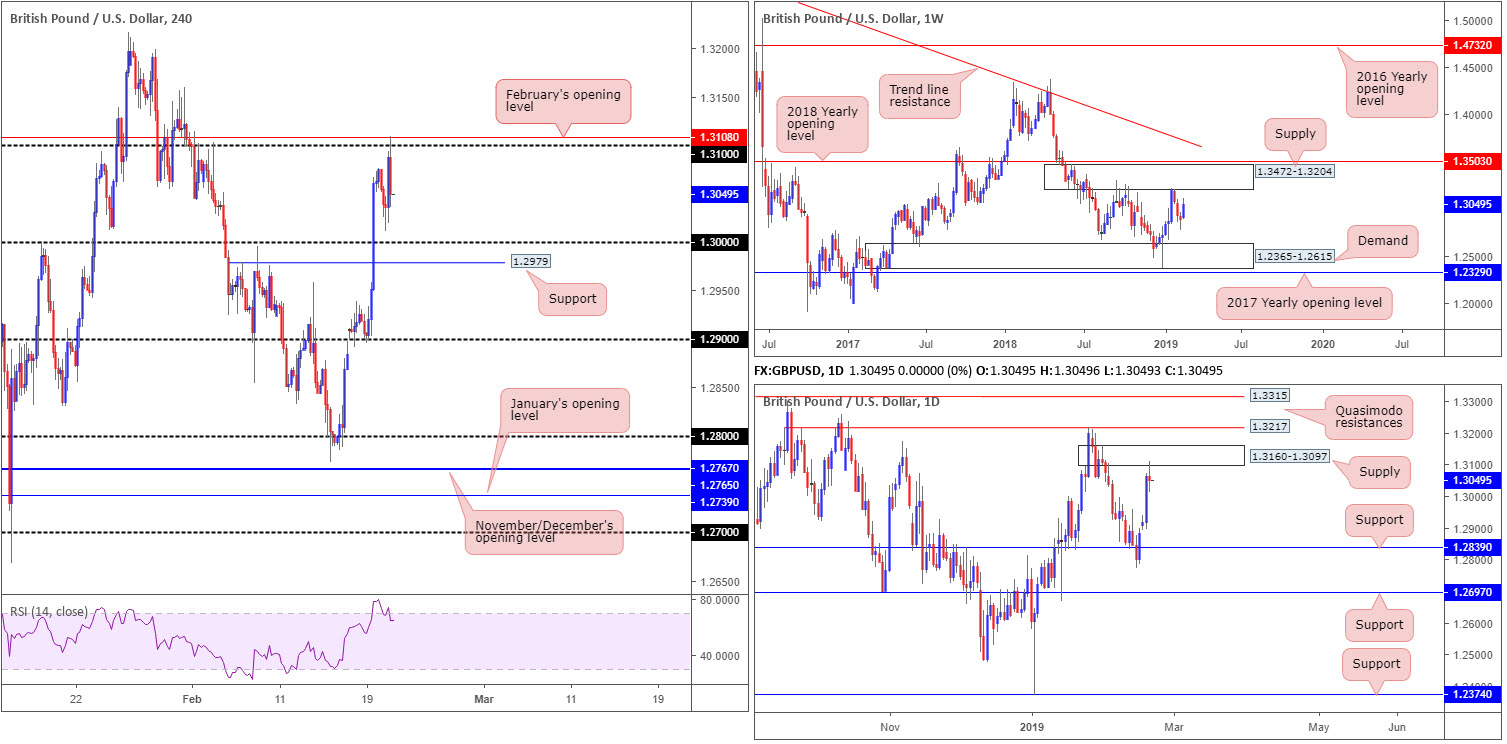
In recent sessions, cable struck highs of 1.3109 on the back of a waning greenback and encouraging headlines out of the United Kingdom. UK PM May and EC President Juncker stated Brexit talks were constructive during their meet Wednesday. Meanwhile, EU’s Tusk said a delay of Brexit is better than no deal Brexit, and adds he hopes the UK realises no deal Brexit is unacceptable.
Following the release of Wednesday’s Federal Open Market Committee’s (FOMC) January meeting minutes, however, demand for the buck increased, thus weighing on the British pound. H4 price action faded its 1.13 handle, though not before drawing in sellers from nearby February’s opening level at 1.3108, and clocked lows of 1.3011. The next downside target on this scale falls in around key figure 1.30 and neighbouring support pencilled in at 1.2979.
Another important point worth noting is daily supply coming in at 1.3160-1.3097, which elbowed its way into the mix yesterday. Assuming sellers remain in the driving seat from here, support at 1.2839 is the next area of interest on this timeframe.
Areas of consideration:
With daily sellers recently entering the fold, a long play out of 1.30/H4 support at 1.2979 today is somewhat fragile. However, given the 1.30 is a watched barrier in this market that might be sufficient to lure buyers in and bounce higher. Waiting for a H4 bullish candlestick pattern to develop is recommended, nevertheless, (entry/stop parameters can be defined according to this structure), not only because of where we’re coming from on the daily timeframe but also because round numbers are prone to stop runs (fakeouts).
Today’s data points: UK Public Sector Net Borrowing; US Core Durable Goods Orders; US Durable Goods Orders; Philly Fed Manufacturing Index.
AUD/USD:
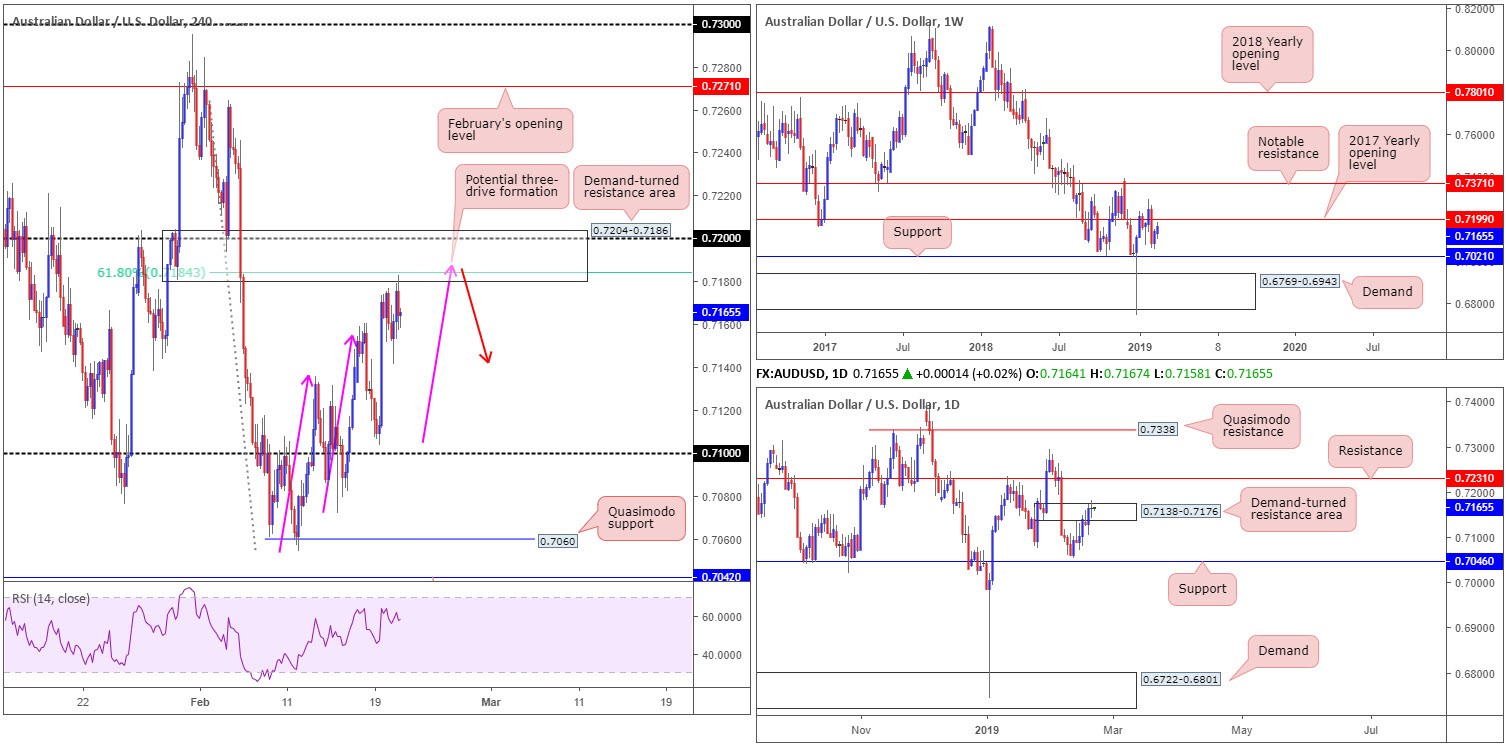
For traders who read Wednesday’s briefing you may recall the piece highlighted a potential sell from a H4 demand-turned resistance area at 0.7204-0.7186, in view of its surrounding confluence. With stop-loss orders tucked above 0.7204, the report went on to state the market could be looking at a run towards Tuesday’s lows of 0.7103 as an initial take-profit target.
Several features about 0.7204-0.7186 deserve mention:
- A 8% H4 Fibonacci resistance value at 0.7184.
- The 0.72 handle.
- A H4 three-drive formation (pink arrows) visibly completes around 0.7187.
- It might also be worth noting the H4 RSI indicator is seen approaching its overbought value.
- Another factor in favour of the aforesaid H4 zone is the weekly timeframe’s 2017 yearly opening level residing around the 0.7199 region.
As is evident from the chart, the H4 candles responded from the lower edge of the aforementioned demand-turned resistance area, fuelled by the release of Wednesday’s Federal Open Market Committee’s (FOMC) January meeting minutes.
The only grumble, technically speaking, is daily price. Price action breached the upper edge of a demand-turned resistance zone at 0.7138-0.7176. A decisive close above this area has resistance at 0.7231 to target.
Areas of consideration:
Well done to any of our readers who managed to jump aboard the sell out of 0.7204-0.7186 yesterday. Keep an eye on Tuesday’s lows mentioned above at 0.7103 as an initial take-profit target.
In early Asia today, however, the Australian Bureau of Statistics will release the January labour market report – expected to show an increase of 15.2K in the number of people employed. Therefore, it’s certainly worth watching this market if you have positions open.
Today’s data points: Australian Employment Change; Australian Unemployment Rate; US Core Durable Goods Orders; US Durable Goods Orders; Philly Fed Manufacturing Index.
USD/JPY:
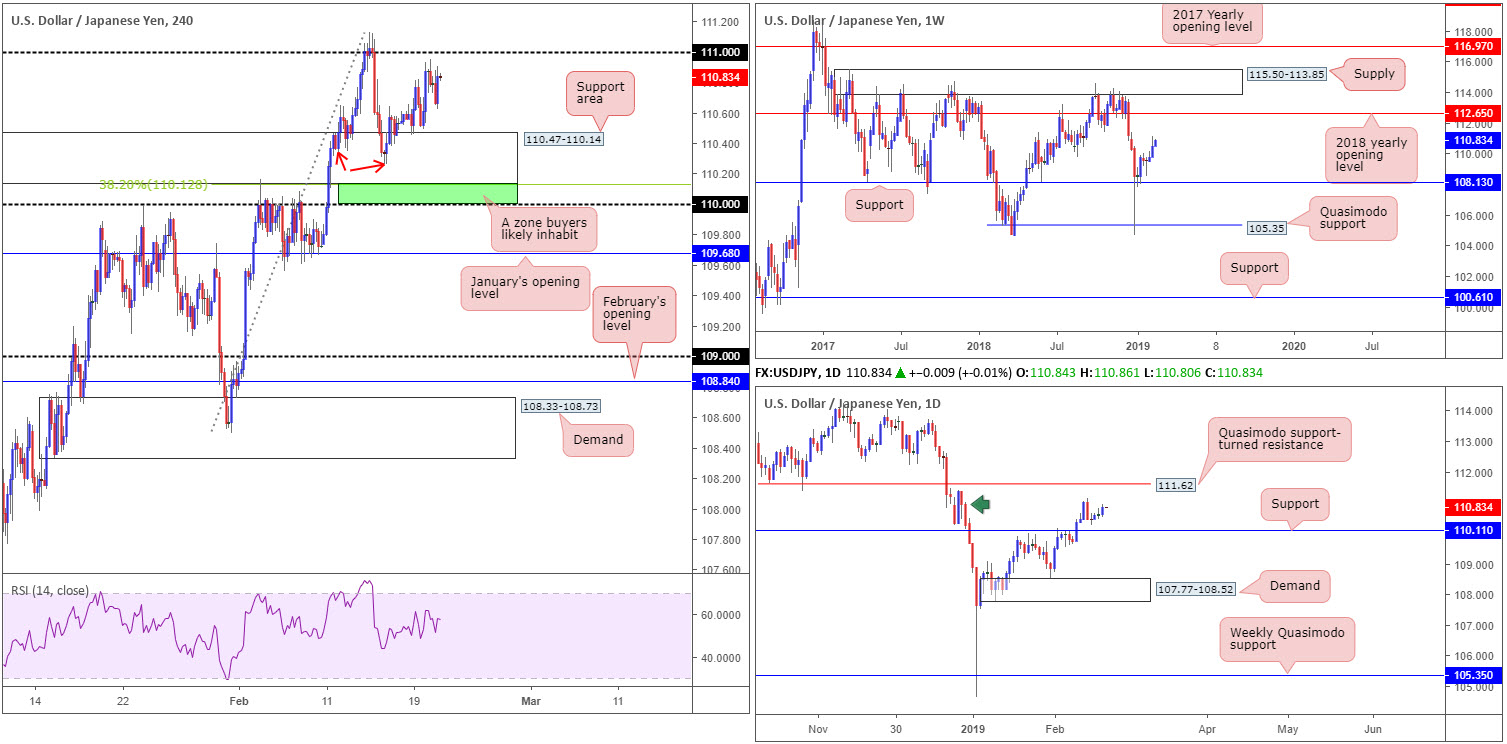
The US dollar gained ground across the board Wednesday after the release of the latest FOMC minutes, and positioned the USD/JPY’s H4 candles within striking distance of the 111 handle at the close.
Having seen the pair print a reasonably fair lower low (110.20 – red arrows) of late, some traders may be looking to fade 111 today. This, according to our technical studies, is a chancy move. All three timeframes display an upward facing trend, with both weekly and daily structure also showing room to explore higher ground before hitting resistance.
As long as the unit remains above weekly support drawn from 108.13, upside on the weekly timeframe is relatively free until connecting with its 2018 yearly opening level at 112.65. The story on the daily timeframe, nonetheless, aside from the 111.28 Feb 14 high, we see little stopping the pair from advancing towards resistance at 111.62.
Areas of consideration:
On account of the above reading, rather than looking to fade 111 today, traders are urged to consider waiting and seeing if the candles can breach 111. Assuming this comes to fruition, a retest play off 111 is a possibility, targeting 111.62: the daily resistance highlighted above.
For those looking for a bit more confirmation, a H4 bullish candlestick pattern formed on the retest of 111 not only provides traders a visual clue buyers may be entering the fray, it also offers entry/stop parameters to work with.
Today’s data points: US Core Durable Goods Orders; US Durable Goods Orders; Philly Fed Manufacturing Index.
USD/CAD:
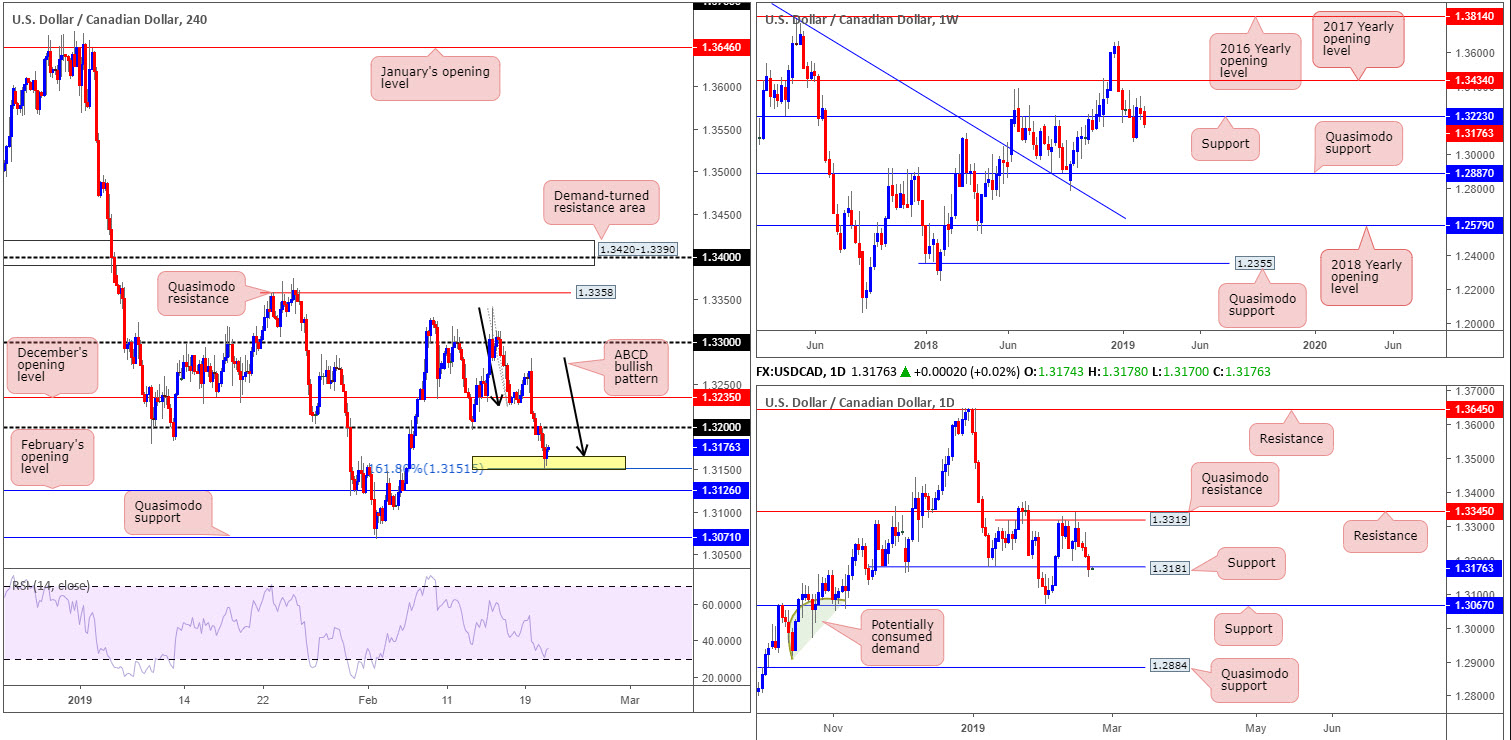
USD/CAD movement extended its slide for a fourth uninterrupted day Wednesday, reaching lows at 1.3150. A deteriorating greenback as well as WTI surging to 4-month highs at $57.57, collectively weighed on the currency pair.
What’s interesting, at least from a technical perspective, is current price responding from a recently completed H4 ABCD (black arrows) bullish pattern (yellow) at 1.3151/1.3165. From this region, upside appears reasonably free until reaching the underside of 1.32.
According to the higher-timeframe structure, a move towards 1.32 is all that may be in the offing. Weekly price recently crossed beneath support at 1.3223, potentially exposing the 1.3068 Jan 28 weekly low, followed by support coming in at 1.2887. On top of this, the research team also notes daily price marginally engulfing support at 1.3181 yesterday, highlighting a possible run towards support at 1.3067.
Areas of consideration:
With the higher timeframes suggesting additional selling could be in store, entering long based on the current H4 ABCD bullish pattern at 1.3151/1.3165 may not be the best path to take. The most the research team feels this market has from here is 1.32. With that being the case, a sell, on the back of a H4 bearish candlestick configuration, from 1.32 could be worth considering, targeting February’s opening level on the H4 timeframe at 1.3126 as the initial port of call in terms of downside targets.
The reason for requiring a H4 bearish candlestick pattern is simply due to round numbers being prone to stop runs. Furthermore, a confirming candlestick pattern helps traders outline entry and risk.
Today’s data points: US Core Durable Goods Orders; US Durable Goods Orders; Philly Fed Manufacturing Index; BoC Gov. Poloz Speaks.
USD/CHF:
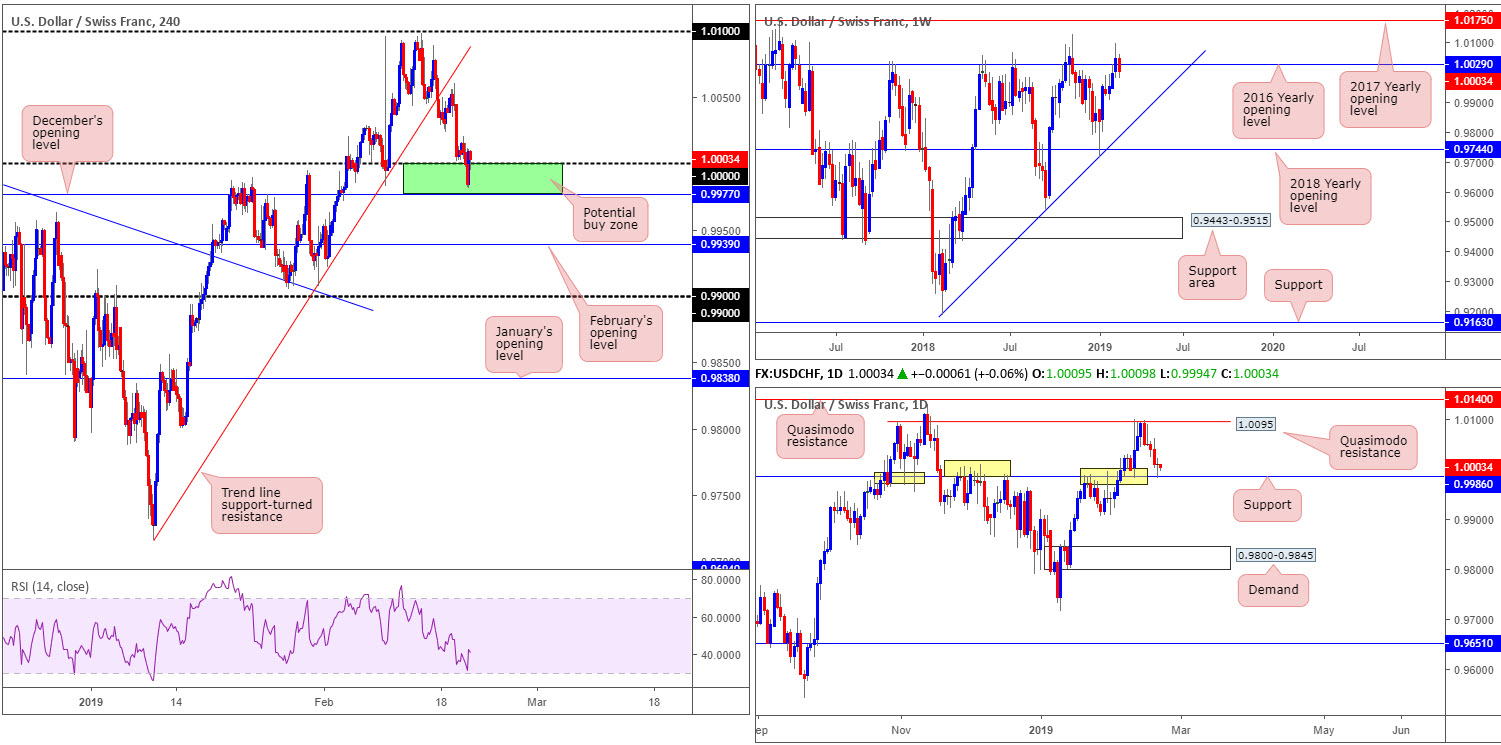
USD/CHF prices are little changed this morning, visually presented by way of a daily indecision candle pattern. Although the day ended unchanged, the H4 candles dipped its toes into a rather interesting area of support between 0.9977/1.0000 (green): December’s opening level and a key round number (parity). In between this area, though, traders may also want to acknowledge long-standing daily resistance/support at 0.9986, which, as you’ll see from the daily chart, was brought into play Wednesday.
As highlighted in yesterday’s briefing, while 0.9977/1.0000 may be a tempting location to consider buying this market from, traders are urged to take into account weekly price trading beneath its 2016 yearly opening level at 1.0029. The barrier’s history as a resistance is certainly not to be overlooked.
Areas of consideration:
The combination of daily support mentioned above at 0.9986, December’s opening level at 0.9977 and 1.0000, offers a robust support area to possibly buy from (stop-loss orders can be planted below December’s opening level). In regards to an initial upside target from here, 1.0050 appears a reasonably logical starting point.
For traders interested in longs from 0.9977/1.0000 today, though at the same time feel somewhat exposed here by the potential threat of weekly sellers residing above, the H4 candles recently chalked up a bullish engulfing formation on the back of Wednesday’s FOMC minutes, potentially confirming buyer intent and adding weight to a move higher being seen.
Today’s data points: US Core Durable Goods Orders; US Durable Goods Orders; Philly Fed Manufacturing Index.
Dow Jones Industrial Average:
Since the beginning of the week, the Dow Jones Industrial Average has been unable to strike any meaningful direction, despite FOMC minutes hitting the wires yesterday. In light of this lacklustre movement, the research team’s outlook remains unchanged going into today’s segment…
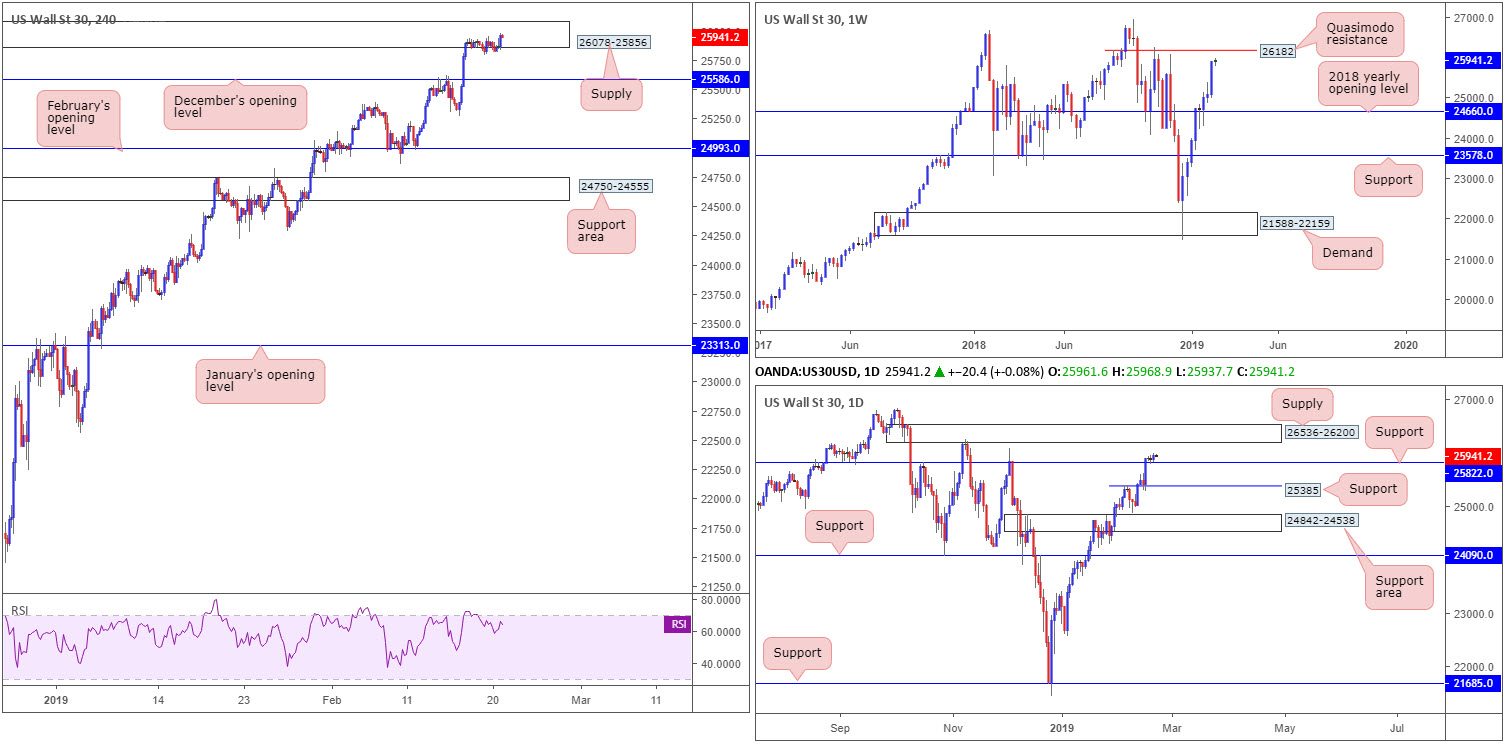
Since clearing and retesting the 2018 yearly opening level at 24660 as support on the weekly timeframe, the Dow Jones Industrial Average, in the shape of a near-full-bodied bull candle, reflects a strong bullish stance, up 800 points last week. Further buying this week has Quasimodo resistance at 26182 to target.
Recent trade also observed the daily candles establish support off 25385 (broken high-turned support) and marginally close above 25822. In the event this level holds firm as support this week, upside appears reasonably free until connecting with supply at 26536-26200 (sited just north of the weekly Quasimodo resistance).
Trade optimism provided fresh impetus Friday, pulling the candles beyond December’s opening level at 25586 into the walls of a H4 supply zone coming in at 26078-25856, where price remained Monday, Tuesday and Wednesday by way of a tight consolidation. Note this supply is positioned directly beneath daily supply mentioned above at 26536-26200.
Areas of consideration:
Although US equities trade with a strong upside bias, notable resistance is on the horizon. We have Quasimodo resistance out of the weekly timeframe at 26182, which is sited just beneath daily supply at 26536-26200, though is positioned above H4 supply at 26078-25856. Therefore, taking a long position in this market is difficult, according to our technical studies.
As for selling this week, the research team notes to wait and see if the unit connects with the weekly Quasimodo resistance 26182. Bringing in weekly sellers from here, and also daily sellers from nearby supply at 26536-26200, is likely enough to draw in sellers for a bounce lower. For conservative traders concerned about trading countertrend, waiting for a H4 bearish candlestick formation to print off 26182 is an option. This not only helps decipher whether sellers are active or not, it also provides entry/stop parameters to work with.
Today’s data points: US Core Durable Goods Orders; US Durable Goods Orders; Philly Fed Manufacturing Index.
XAU/USD (GOLD):
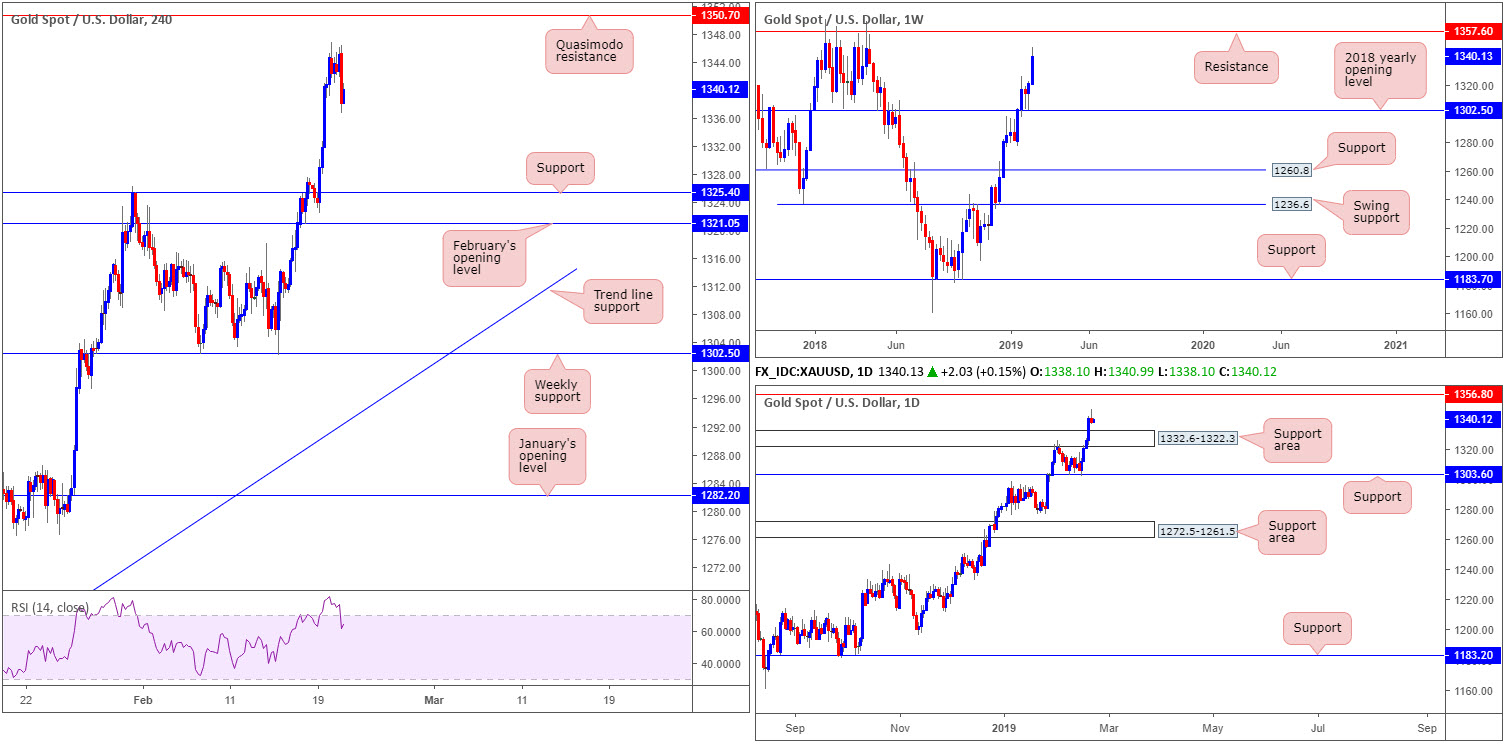
Breaking a four-day bullish phase, gold prices receded south Wednesday. Down 0.20% on the day, the unit turned lower in the shape of a daily bearish candlestick pattern as the US dollar explored higher ground following the release of the FOMC minutes. Should this visual encouragement prompt further downside today, the next area of support on the daily timeframe resides close by at 1332.6-1322.3.
Despite the recent phase of selling, bullion continues to reflect a strong bullish tone. All three timeframes exhibit scope to search for higher levels. H4 action, besides yesterday’s high 1346.7, has Quasimodo resistance at 1350.7 as its next upside target. Weekly flow has notable resistance coming in at 1357.6, and daily flow shows the runway north towards resistance at 1356.8 is also reasonably free.
Areas of consideration:
In the event this market retests the daily support area highlighted above at 1332.6-1322.3, and pencils in either a H4 or daily bullish candlestick pattern (traders can base entry/risk levels according to the candlestick’s measurements), a long in this market is possible, targeting the H4 Quasimodo resistance level mentioned at 1350.7 as an initial take-profit zone, followed by the daily resistance level at 1356.8.
The accuracy, completeness and timeliness of the information contained on this site cannot be guaranteed. IC Markets does not warranty, guarantee or make any representations, or assume any liability with regard to financial results based on the use of the information in the site.
News, views, opinions, recommendations and other information obtained from sources outside of www.icmarkets.com.au, used in this site are believed to be reliable, but we cannot guarantee their accuracy or completeness. All such information is subject to change at any time without notice. IC Markets assumes no responsibility for the content of any linked site. The fact that such links may exist does not indicate approval or endorsement of any material contained on any linked site.
IC Markets is not liable for any harm caused by the transmission, through accessing the services or information on this site, of a computer virus, or other computer code or programming device that might be used to access, delete, damage, disable, disrupt or otherwise impede in any manner, the operation of the site or of any user’s software, hardware, data or property.


