
A note on lower timeframe confirming price action…
Waiting for lower timeframe confirmation is our main tool to confirm strength within higher timeframe zones, and has really been the key to our trading success. It takes a little time to understand the subtle nuances, however, as each trade is never the same, but once you master the rhythm so to speak, you will be saved from countless unnecessary losing trades. The following is a list of what we look for:
- A break/retest of supply or demand dependent on which way you’re trading.
- A trendline break/retest.
- Buying/selling tails/wicks – essentially we look for a cluster of very obvious spikes off of lower timeframe support and resistance levels within the higher timeframe zone.
- Candlestick patterns. We tend to only stick with pin bars and engulfing bars as these have proven to be the most effective.
We search for lower timeframe confirmation between the M15 and H1 timeframes, since most of our higher-timeframe areas begin with the H4. Stops are usually placed 5-10 pips beyond confirming structures.
EUR/USD:
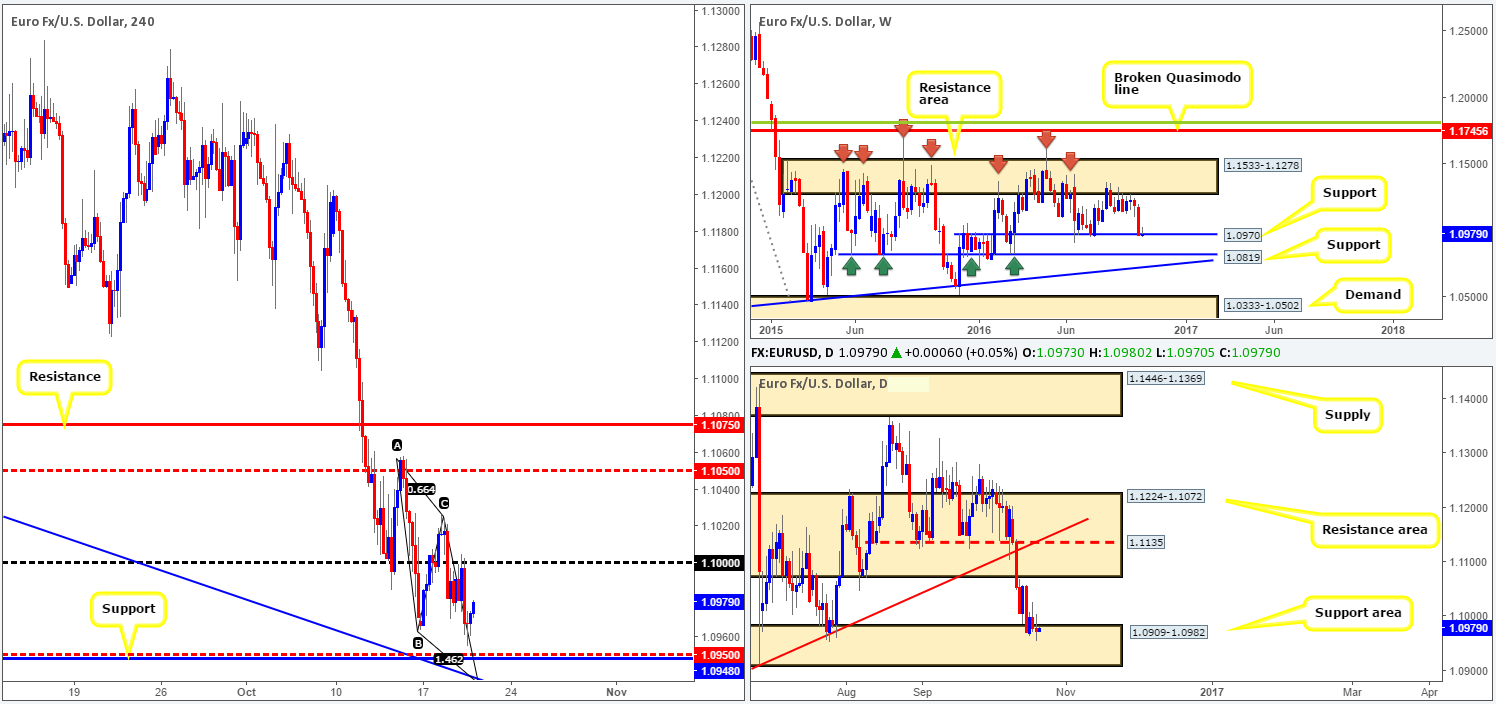
Beginning with a quick look at the weekly chart this morning, the shared currency is seen testing a support barrier coming in at 1.0970. With this number having held relatively firm since the beginning of the year, a bounce is expected. Climbing down to the daily chart, the candles are also seen trading around an area of support: 1.0909-1.0982, which, as you can see, has held since Friday.
Looking across to the H4 chart, we can see that price retested the underside of the key figure 1.10 going into the London segment. This was followed up by a push to lows of 1.0955, which is where price bottomed out for the day as we entered the US session. Despite the EUR putting in a bottom 5 pips ahead of the H4 mid-way support level 1.0950, our spotlight remains focused on the 1.0935/1.0950 area for buys today. As we highlighted in Wednesday’s report, this small H4 buy zone boasts a H4 support at 1.0948, a H4 trendline support extended from the high 1.1186 and a H4 AB=CD bull completion point at 1.0935. Furthermore, in recent hours, the D-leg of the current AB=CD formation has also chalked up a ‘mini’ AB=CD bullish pattern, which should, if it completes, terminate around the 1.0950ish region.
Our suggestions: Therefore, between 1.0935 and 1.0950 is somewhere we’re expecting the shared currency to bounce from given the H4 confluence and support seen from the higher-timeframe structures (see above). There is, however, still the possibility of a fakeout through this zone, as price may want to test the extremes of the current daily support area before rotating to the upside. As such, we would require at least a H4 bullish close from the H4 1.0935/1.0950 zone before a trade can be executed.
Fundamentally, however, we have the ECB rate announcement and press conference at 12.30pm GMT. This will likely overshadow the US Philly Fed manufacturing data along with US jobless claims also being released at the same time.
Levels to watch/live orders:
- Buys: 1.0935/1.0950 region ([H4 bullish close required prior to pulling the trigger] Stop loss: ideally beyond the trigger candle).
- Sells: Flat (Stop loss: N/A).
GBP/USD:
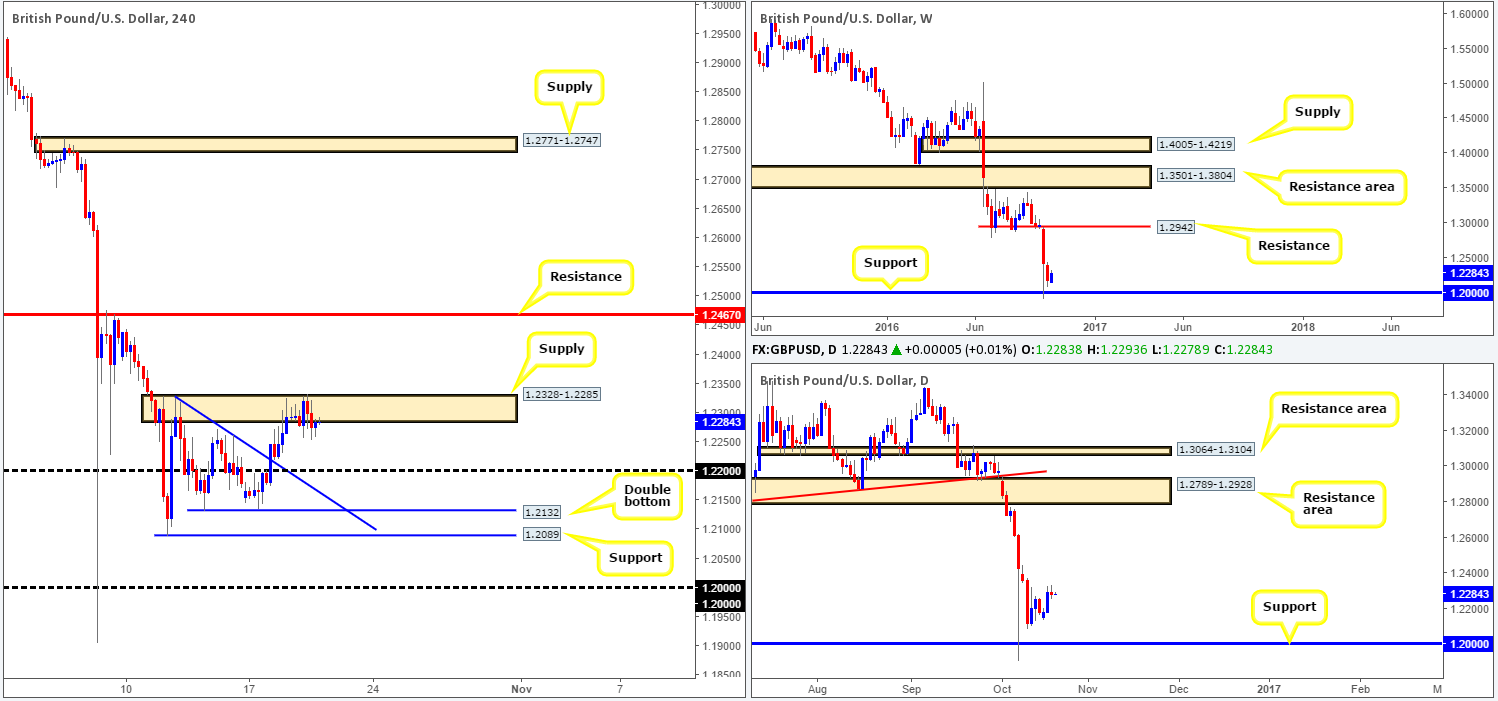
The GBP is seen trading marginally lower today, as the buyers and sellers spent yesterday battling for position within a H4 supply base coming in at 1.2328-1.2285. In addition to this, the upbeat UK employment print along with mixed results from the US housing market saw little response from the candles.
A break above the current H4 supply could see a renewal of bullish sentiment up to the H4 resistance band drawn from 1.2467. Entering long above the current H4 supply area, as we mentioned in yesterday’s report, does not come without risk. Over on the bigger picture, there’s little seen standing in the way of price diving lower to test the 1.20 region. Therefore, we would still likely pass on any long setups that form beyond H4 supply zone.
Our suggestions: Given that the pair remains entrenched within a downtrend at the moment, we feel the unit has its eye on the 1.22 handle today. Unfortunately, there is demand (formed on Tuesday) also seen within this region currently holding the market higher with the lower edge coming in at 1.2255 (seen clearer on the M30). As a result, shorting from here without at least an hourly close beyond this demand area would not be a trade we’d stamp high probability.
Event risks for today’s sessions, nevertheless, are UK retail sales data set to hit the wire early on in the London session at 8.30am, as well as well as MPC member Shafik speaking at midday GMT.
Levels to watch/live orders:
- Buys: Flat (Stop loss: N/A).
- Sells: 1.2328-1.2285 ([at the very least, an hourly needs to be seen beyond 1.2255 before shorts from the H4 supply zone are permitted] Stop loss: ideally beyond the trigger candle).
AUD/USD:
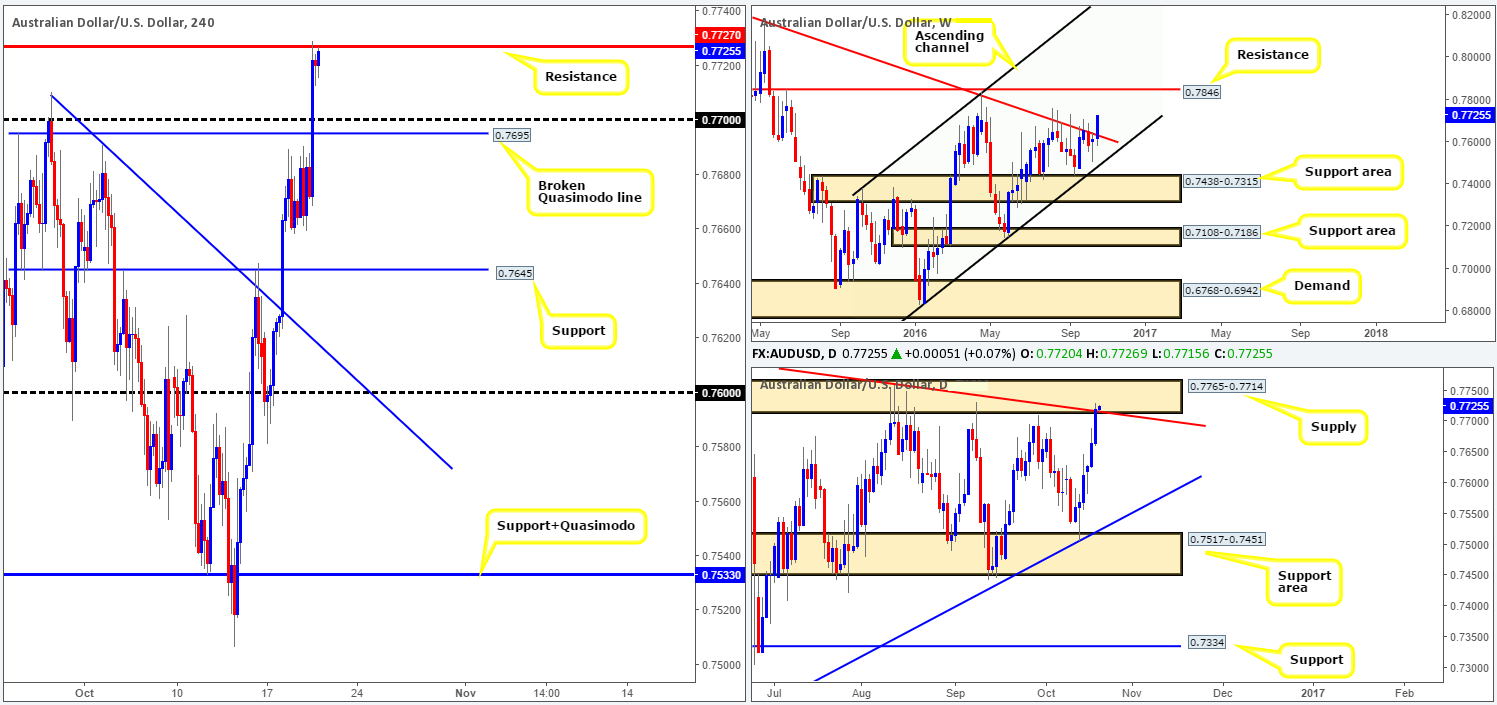
The value of the Aussie dollar increased against the Greenback yesterday, likely fuelled by an advance in the gold market. This is the pair’s sixth consecutive daily gain, and, as such, this begs the question, how long can the buyers sustain this momentum?
From the H4 chart, price rocketed its way through the 0.77 boundary and ended the day crossing swords with resistance logged in at 0.7727. Meanwhile, over on the daily chart, the candles are seen testing a supply barrier formed at 0.7765-0.7714, which, as you can see, fuses nicely with a trendline resistance extended from the high 0.7835. While some traders may be inclined to think that this would be sufficient to halt buying (and we’re not saying it isn’t), the weekly chart brings a slightly different vibe to the table. The aggressive push higher has seen the current candle break above a trendline resistance taken from the high 0.8295, and by extension, potentially paving the way north toward resistance at 0.7846.
Our suggestions: From a technical standpoint, a reversal could be seen from the current H4 resistance. Be that as it may, there’s not only a chance that the daily candles may want to test the upper edge of daily supply (thus pushing through this H4 resistance), but given the added pressure seen from the weekly timeframe showing room to move further north, we have decided to pass on selling here.
On top of this, we have Australian employment data scheduled for release in less than an hour, and with jobs expected to have increased 15K in September, along with the participation rate also expected to rise, this could also play a factor in pushing the currency further northbound today.
Levels to watch/live orders:
- Buys: Flat (Stop loss: N/A).
- Sells: Flat (Stop loss: N/A).
USD/JPY:
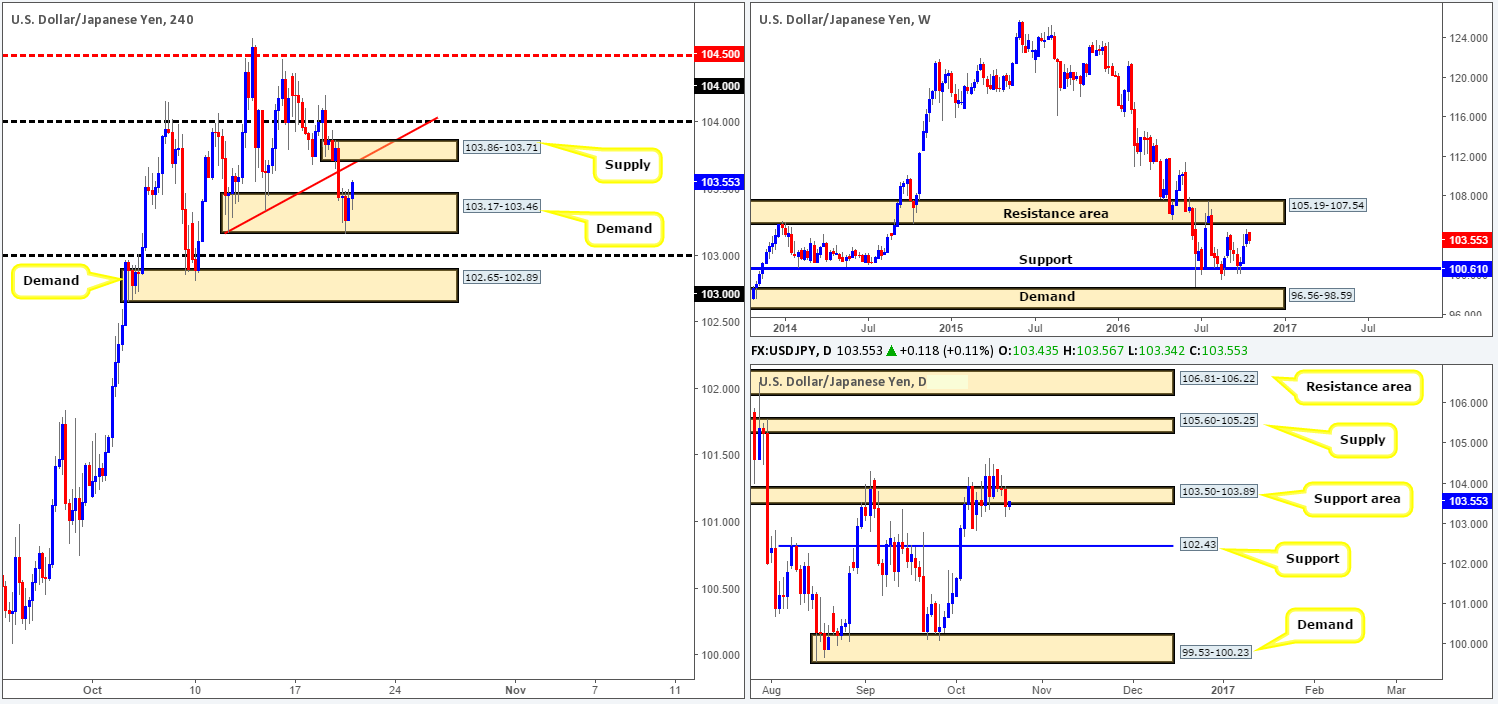
Early on in yesterday’s European session, the USD/JPY broke through a minor H4 trendline support taken from the low 103.17, allowing price to test a H4 demand area coming in at 103.17-103.46. Following a very slight break below this zone going into the US session, the candles began to show bullish intention. Should further upside be seen from this angle, the next upside target, which we believe may hold prices lower, is the recently broken H4 trendline support-turned resistance which converges with a H4 supply at 103.86-103.71. Conversely, if the current H4 demand caves in, the 103 handle is sitting nearby, followed closely by a H4 demand area drawn from 102.65-102.89.
Looking over to the weekly chart, the path north, at least as far as we can see, still looks free up to the underside of a nearby resistance area coming in at 105.19-107.54, following its recent breach of highs chalked up on the 29/08 around the 104.32ish range. Down on the daily chart, the unit recently edged below the support area at 103.50-103.89, suggesting a downside move to support at 102.43 may be on the cards.
Our suggestions: Despite having little (clear) supporting confluence from the higher timeframes, the current H4 supply and its H4 trendline resistance will likely bounce price lower today. If this setup appeals to your trading plan, you may also want to take into account that there’s a possibility that price could whipsaw through the H4 supply to tag in offers around the 104 handle, so be careful where you place your stops guys!
In that there’s little higher-timeframe involvement, we’ll likely pass on selling from here today and lay low on the sidelines for the time being.
Levels to watch/live orders:
- Buys: Flat (Stop loss: N/A).
- Sells: 103.86-103.71 is a possible area where price may bounce from (Stop loss: this is tricky since there’s a chance of a whipsaw up to 104, therefore, if we were trading from here, we’d wait for a lower timeframe sell signal to form [see the top of this report] before pulling the trigger).
USD/CAD:
In view of the current weekly candle showing indecision within supply drawn from 1.3295-1.3017, and daily action printing a rather aggressive buying tail off the back of a support at 1.3029, could the sellers be in a spot of trouble here? Well, looking over at the H4 chart, the area that initially jumps out to us this morning is the supply base coming in at 1.3219-1.3204. This area boasts a psychological resistance just below it at 1.32, along with a 61.8% Fib resistance just below that at 1.3196 as well as a steep trendline resistance taken from the low 1.30. Despite this confluence, the zone sports little support from the daily timeframe, which shows room to advance up to supply at 1.3405-1.3259. Nonetheless, let’s bear in mind that the H4 zone DOES sit within the confines of the above noted weekly supply!
Our suggestions: In light of the above points, our team is watching for H4 price to break through the mid-way resistance 1.3150 today in order to reach the aforementioned H4 sell zone. As the H4 supply does sit within a weekly supply area, we would deem this a valid area to take a short from. In fact, should price reach this zone in the early hours of London, we would look to sell from here at market with our stop placed above the supply at 1.3222.

Levels to watch/live orders:
- Buys: Flat (Stop loss: N/A).
- Sells: 1.3219-1.3204 ([possible area to short from at market] Stop loss: 1.3222).
USD/CHF:
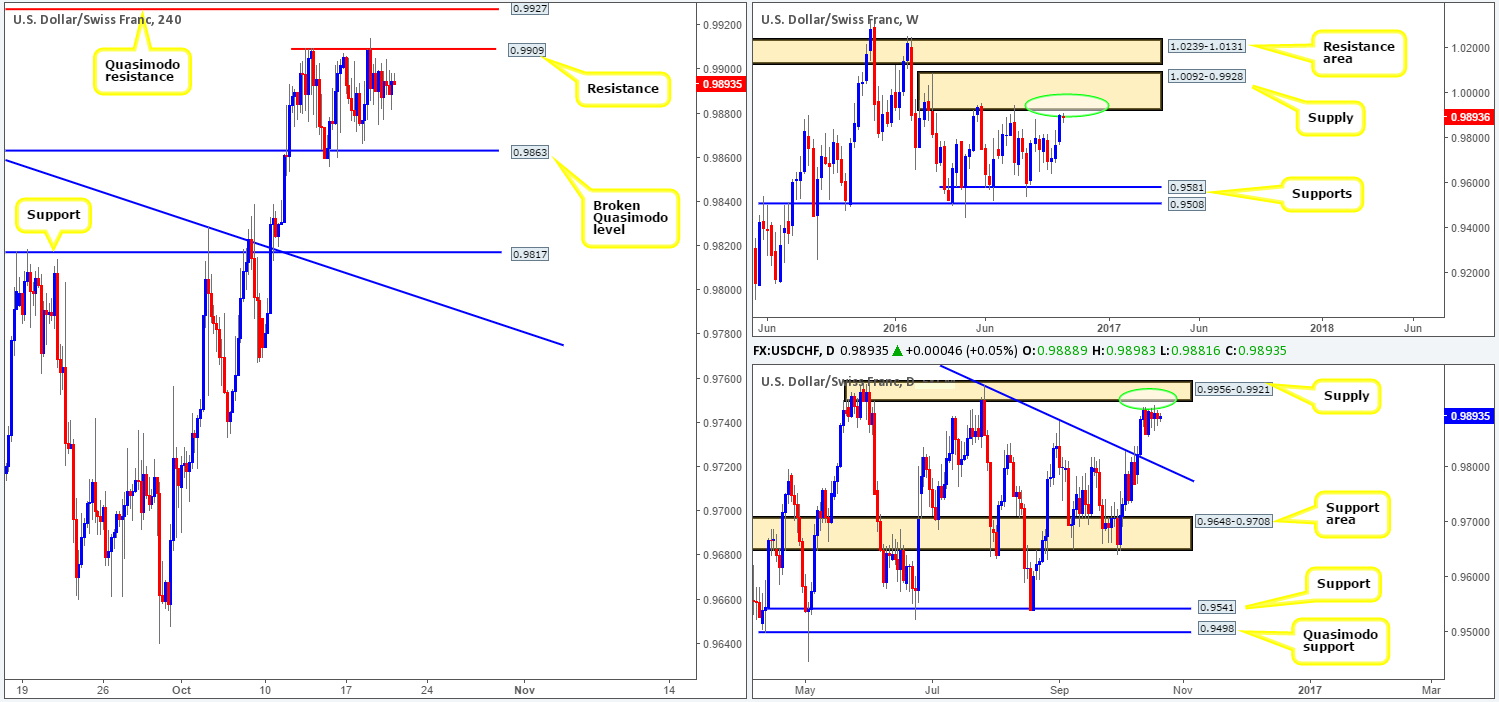
It was a relatively quiet session for the Swissy yesterday, which saw the pair range no more than 30 pips! As a result, much of the following analysis will echo similar thoughts put forward in Wednesday’s report…
Up to now, the pair has been consolidating between a H4 broken Quasimodo support line at 0.9863 and a H4 resistance at 0.9909. In spite of this, our team has absolutely no interest in trying to trade the edges of this range. The focus, for now, continues to remain on the H4 Quasimodo resistance barrier penciled in at 0.9927. This is due to its connection with the underside of both the weekly supply at 0.9928 and daily supply at 0.9921 (see the two green circles).
Our suggestions: In that the USD/CHF remains relatively unchanged as far as structure is concerned, we still have a pending sell order set at 0.9926 with a stop placed above the top edge of daily supply (0.9956) at 0.9960. In the event that the order is filled today, we’ll be looking for price to close beyond 0.99 and work its way back down to the aforementioned H4 broken Quasimodo line support.
Levels to watch/live orders:
- Buys: Flat (Stop loss: N/A).
- Sells: 0.9926 ([pending order] Stop loss: 0.9960).
DOW 30:
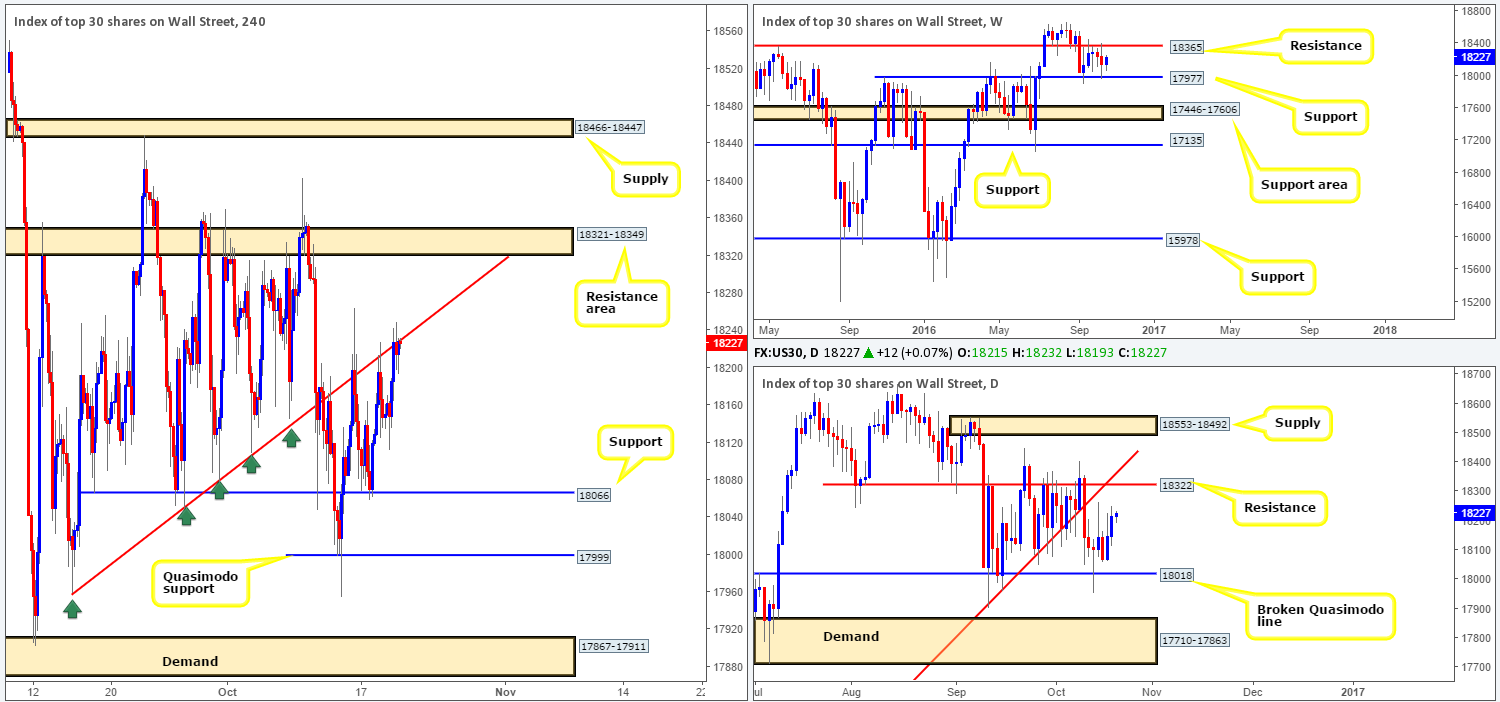
Equities rallied north yesterday on the back of higher oil prices as well as better than expected earnings in the banking sector. This is the second consecutive day stocks have rallied.
Technically speaking, however, buying may diminish for a short stretch due to H4 price now seen kissing the underside of a trendline resistance extended from the low 17959. Nevertheless, we do not attach much weight to this line (although it has held firm on a number of occasions), since weekly action shows room to rally up to resistance coming in at 18365, as does daily price up to resistance drawn from 18322.
Our suggestions: As we have mentioned in previous reports, the only areas we have interest in at the moment is the H4 Quasimodo support at 17999 and the H4 resistance area at 18321-18349. The Quasimodo is attractive because it fuses with nearby weekly support at 17977 and also the daily broken Quasimodo line at 18018.The resistance zone, however, is equally attractive since it houses the daily resistance level at 18322 and is located just below weekly resistance at 18365.
However, to avoid being stopped out by a whipsaw, we’d recommend waiting for a H4 close to take shape at both areas highlighted in bold prior to risking capital.
Levels to watch/live orders:
- Buys: 17999 ([H4 bullish close required prior to pulling the trigger] Stop loss: ideally beyond the trigger candle).
- Sells: 18321-18349 ([H4 bearish close required prior to pulling the trigger] Stop loss: ideally beyond the trigger candle).
GOLD:
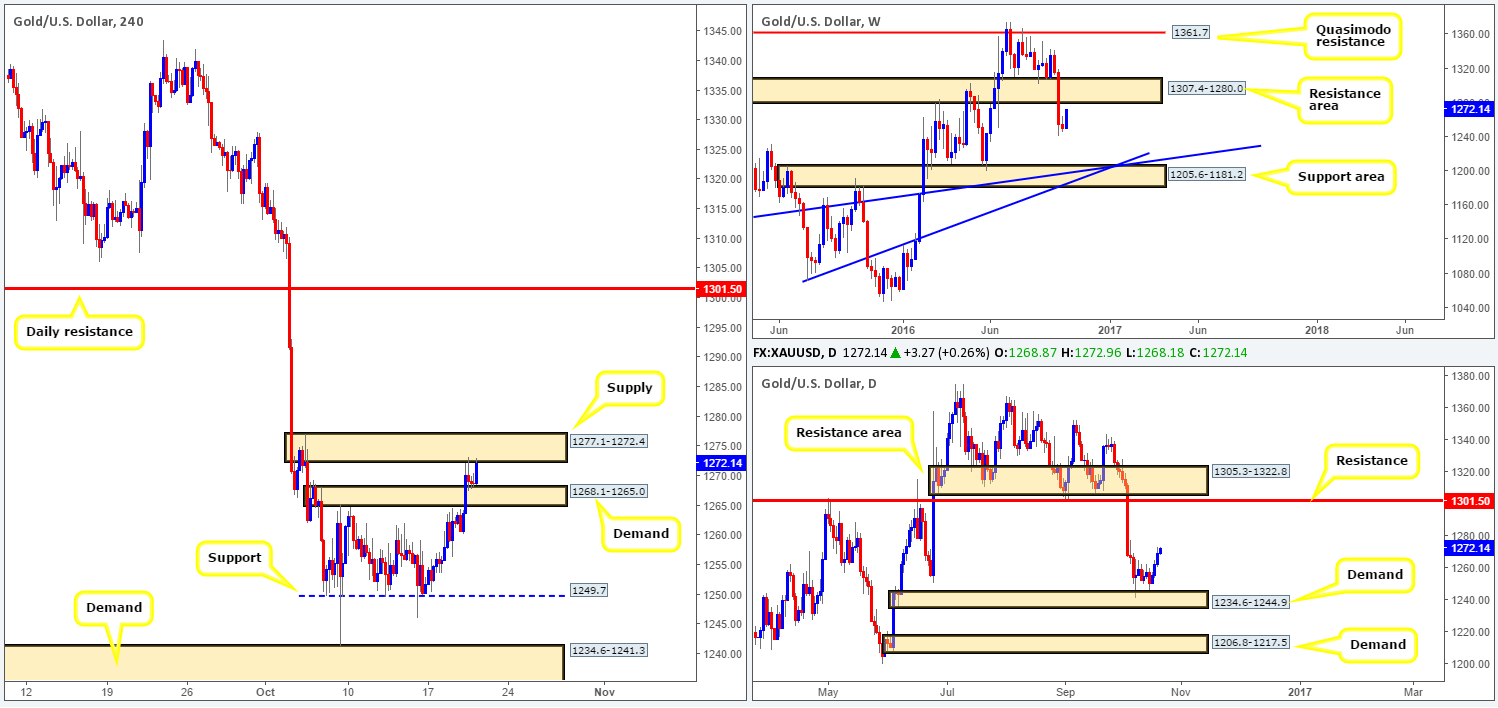
Kicking this morning’s report off with a look at the weekly chart, the precious metal is seen pulling back to the underside of a recently broken support area at 1307.4-1280.0 (now acting resistance). As was previously highlighted in past reports, the aggressive break through this support zone likely left a truckload of sell orders unfilled, hence why it is likely to become a resistance area in the near future.
Looking down to the daily chart, gold has rallied for three consecutive days, following its bounce from demand at 1234.6-1244.9. In the event that the bulls remain in a dominant position from here, we could see price bid up to resistance at 1301.5 (located within the aforementioned weekly resistance area).
Jumping across to the H4 chart, bullion’s recent advance forced price above a supply at 1268.1-1265.0 (now an acting demand base), and as a result, allowed price to connect with supply coming in at 1277.1-1272.4.
For those who follow our reports on a regular basis you may recall us mentioning that this is a tricky market to read at the moment. And, in all honesty, this is still the case as far as we’re concerned. However, the space seen on the H4 chart beyond the current H4 supply area up to daily resistance at 1301.5 is very attractive. The only problem is, as we highlighted in yesterday’s analysis, that a break above the H4 supply would still be considered a risky buy as by that point price would be trading within striking distance of the weekly resistance area mentioned above at 1307.4-1280.0. While we agree with this, there’s still a chance price could effectively rally up to the daily resistance line upon breaking above the current H4 supply.
Therefore, after some thought, we have decided to re-evaluate our position in this market. Should price close beyond the current H4 supply and retest this boundary as demand, followed up with a reasonably sized H4 bull candle, we might, dependent on the time of day, look to go long from here, targeting the 1301.5 neighborhood.
Levels to watch/live orders:
- Buys: Watch for a close above the H4 supply at 1277.1-1272.4 and look to trade any retest seen thereafter (H4 bullish close required prior to pulling the trigger).
- Sells: Flat (Stop loss: N/A).


