
EUR/USD:
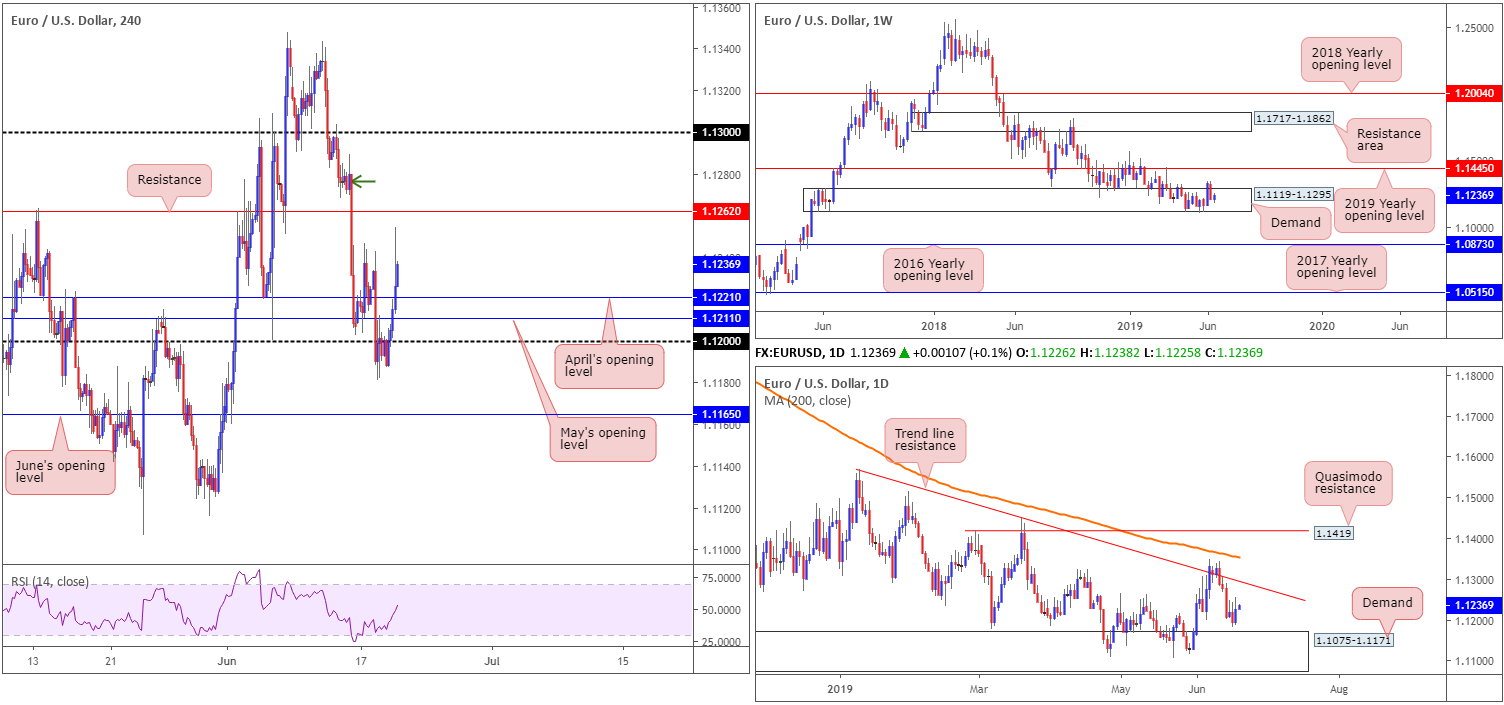
The single currency rose higher against its US counterpart Wednesday in the aftermath of the FOMC. The central bank left rates unchanged between 2.25-2.50%, as expected, though tweaked the language in its statement to reflect a more dovish stance.
Erasing Draghi-induced losses, the candles gravitated to a high of 1.1254. H4 price, after engulfing May and April’s opening levels at 1.1211 and 1.1221, respectively, now appear poised to approach resistance at 1.1262. Beyond here, supply resides around the 1.1280 region (green arrow), though is unlikely to offer much resistance as it forms part of a stacked supply construction which connects to the 1.13 handle. Therefore, 1.13 is considered the next upside target above 1.1262.
Over on the daily timeframe, buyers and sellers remain battling for position between trend line resistance (extended from the high 1.1569) and demand at 1.1075-1.1171 (glued to the underside of the weekly demand highlighted above). Weekly movement, on the other hand, continues to occupy a long-standing demand area at 1.1119-1.1295. Traders may also wish to acknowledge the overall trend remains facing a southerly bearing since topping in early 2018, and thus places a bold question mark on the demand’s life expectancy.
Areas of consideration:
Short-term levels to keep an eye on today are the H4 resistance mentioned above at 1.1262 and May and April’s opening levels at 1.1211 and 1.1221, respectively. However, do bear in mind these barriers hold little connection to higher-timeframe structure.
Should your methodology call for higher-timeframe convergence, June’s opening level at 1.1165 appears a favourable location for longs as it inhabits the upper edge of daily demand at 1.1075-1.1171. The 1.13 handle also looks encouraging, given it has a close connection with the daily trend line resistance (1.1569).
Today’s data points: Philly Fed Manufacturing Index.
GBP/USD:
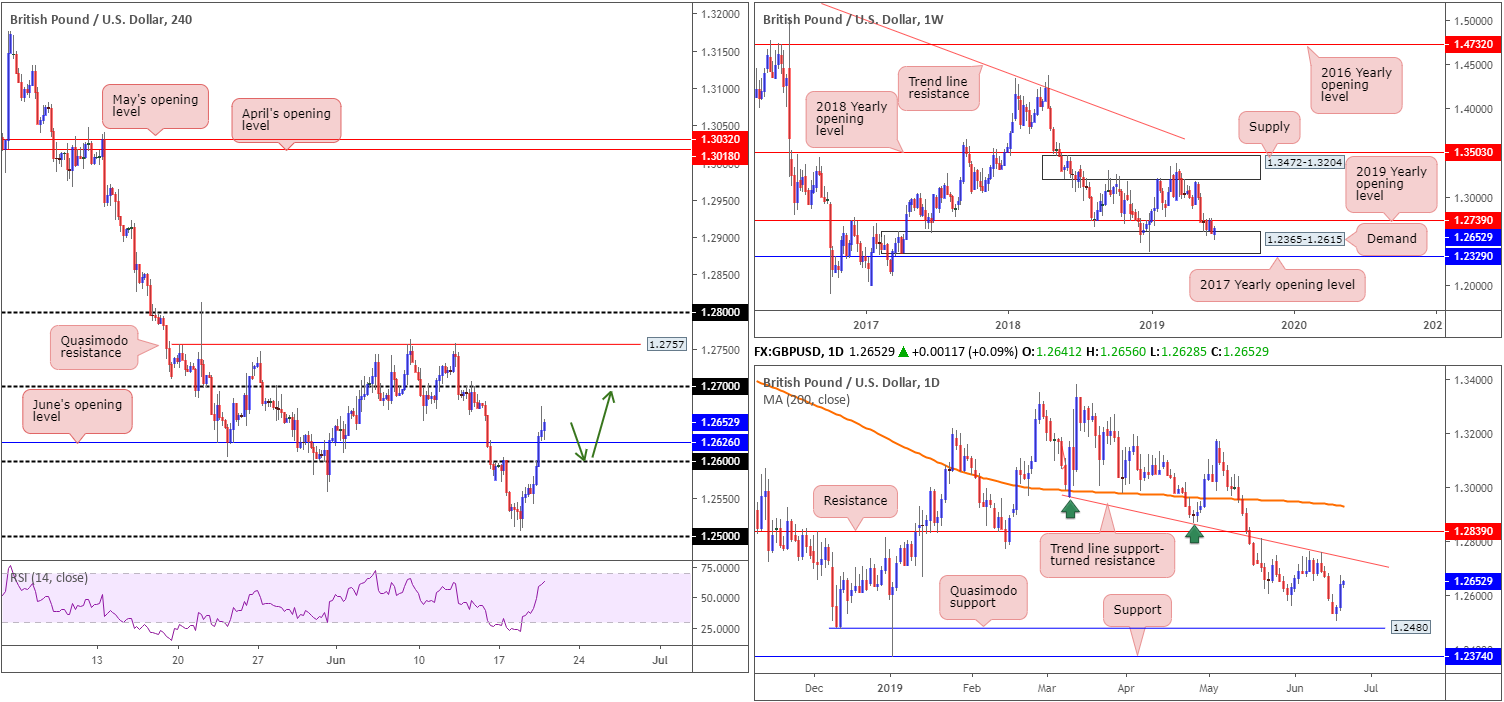
Wednesday observed the British pound advance against the dollar (+0.68%), registering its second consecutive daily gain. In line UK inflation figures did little to move the market Wednesday, while UK politics saw Boris Johnson maintain his lead in the latest round of conservative leadership voting. Sterling benefited on the back of a weaker dollar, largely influenced by the latest round of FOMC movement. The FOMC left rates and policy on hold, but tweaked language in its statement to reflect a more dovish stance.
Technically speaking, the H4 candles are exploring ground above June’s opening level at 1.2626, poised to potentially approach resistance in the form of the 1.27 handle. Overhead, we also have notable Quasimodo resistance at 1.2757, which boasts a close connection to higher-timeframe resistances.
Further buying on the daily timeframe has trend line support-turned resistance (taken from the low 1.2960) to target, while weekly flow eyes resistance at 1.2739: the 2019 yearly opening level.
Areas of consideration:
While 1.27 may offer the market a bounce lower, traders are encouraged to include the H4 Quasimodo resistance at 1.2757 in their analysis. Not only has it held price action lower on two occasions in June, it also, as highlighted above, converges closely with higher-timeframe resistances. However, traders should also be prepared for a fakeout through this level to take shape, as the market may want to bring in additional sellers from 1.28 positioned nearby.
In terms of buying opportunities, a retest scenario seen at 1.26, followed up with a close back above June’s opening level at 1.2626 (green arrows), is certainly a setup worth keeping an eye out for. Entry and risk can be determined according to the closing candle’s structure (H4), with the initial upside target set at 1.27.
Today’s data points: UK Retail Sales m/m; MPC Official Bank Rate Votes; UK Monetary Policy Summary; UK Official Bank Rate; UK Asset Purchase Facility; MPC Asset Purchase Facility Votes; Philly Fed Manufacturing Index.
AUD/USD:
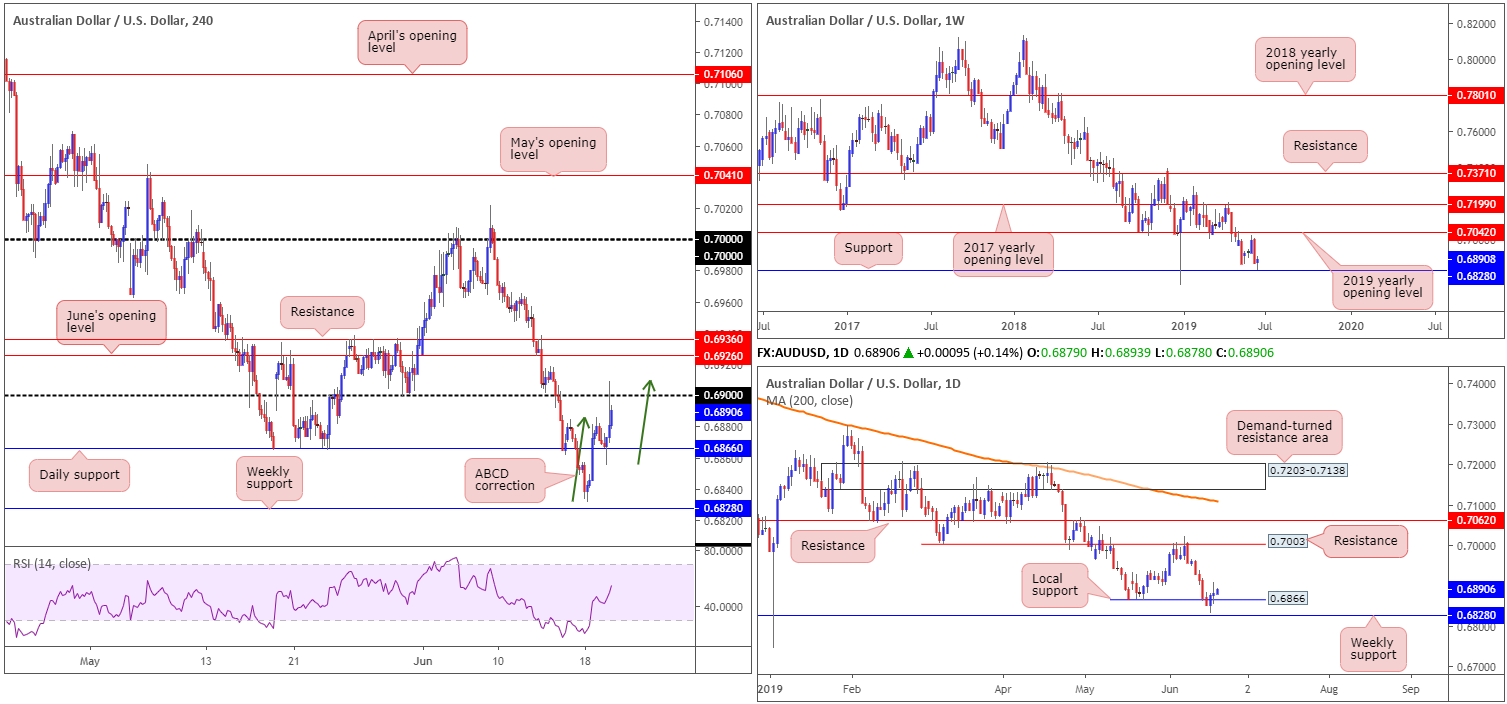
The Australian dollar encountered mild selling pressure vs. the buck during Asia Wednesday, despite upbeat skilled vacancies data. Retesting daily support at 0.6866, in the shape of a H4 hammer formation, the commodity-linked currency made a swift comeback following the FOMC and briefly tested waters above 0.69. What’s also notable from a technical perspective on the H4 timeframe is the ABCD bearish correction (green arrows), which completed at 0.6909, yesterday’s session high.
In terms of where we stand on the higher timeframes, weekly price continues to hover north of support at 0.6828, with a possible run towards the 2019 yearly opening level in view at 0.7042. Similarly, on the daily timeframe, the pair, assuming support at 0.6866 remains intact, exhibits scope to press as far north as resistance at 0.7003.
Areas of consideration:
Having seen higher-timeframe support recently enter the mix, largely speaking about daily support here at 0.6866, the H4 ABCD bearish pattern is unlikely to be enough to overthrow daily support. Instead, we may be heading above 0.69, towards June’s opening level on the H4 timeframe at 0.6926, followed closely by resistance at 0.6936. Unfortunately, the research team notes limited room to establish a long position above 0.69, unless, of course, you are comfortable trading a position on the lower timeframes using a tight stop-loss order. If so, ensure risk/reward calculations offer more than a 1:1 ratio.
Today’s data points: RBA Gov. Lowe Speaks; Philly Fed Manufacturing Index.
USD/JPY:
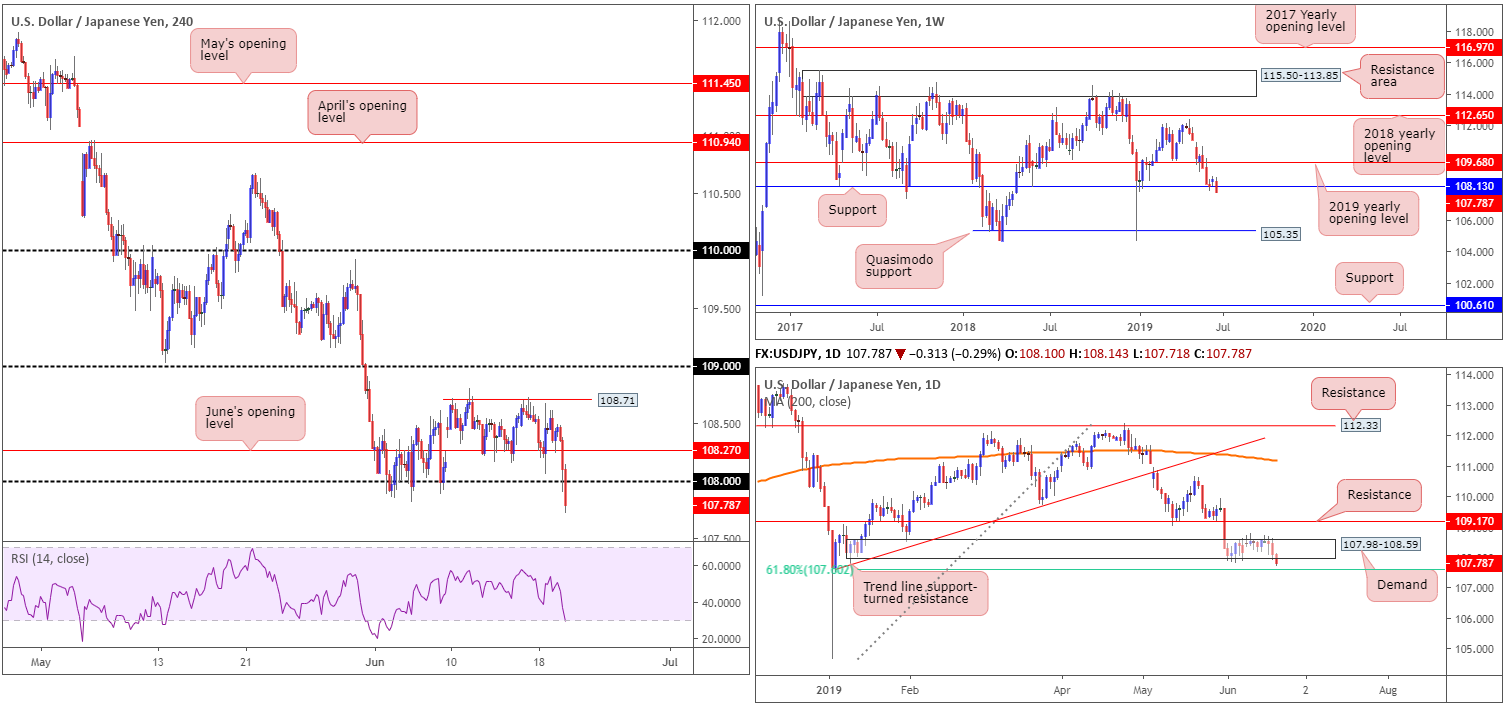
The US dollar declined vs. the Japanese yen in wake of Wednesday’s FOMC, calling for a move beneath June’s opening level at 108.27 on the H4 timeframe and test of the 108 handle. Although 108 held into the close, recent hours has seen the unit press beyond this barrier, currently trading at lows of 107.75. Beyond 108, the research team notes limited support until shaking hands with the 107 neighbourhood. Therefore, according to the H4 timeframe, further selling could be on the cards.
On a wider perspective, however, daily price has engulfed the lower edge of demand at 107.98-108.59, and is now within striking distance of testing a 61.8% Fibonacci support at 107.60. The story on the weekly timeframe has the current candle testing waters beneath notable support at 108.13. A decisive close below here exposes Quasimodo support at 105.35 as the next downside target.
Areas of consideration:
Assuming the current H4 candle closes below 108 in its current state, traders are urged to explore the possibility of a retest scenario, targeting 107.60 (the daily 61.8% Fibonacci support), followed by a possible run to 107.
As round numbers are prone to fakeouts, it is recommended to wait and see how H4 action behaves at the underside of 108 before committing funds to a position. A bearish candlestick configuration would be ideal. This not only helps identify seller intent, it also provides traders entry and risk levels to work with. An alternative to this is drilling down to the lower timeframes and attempting to trade local structure: a break of trend line support or retest of demand-turned supply, for example.
Today’s data points: Philly Fed Manufacturing Index; BoJ Monetary Policy Statement and Press Conference.
USD/CAD:
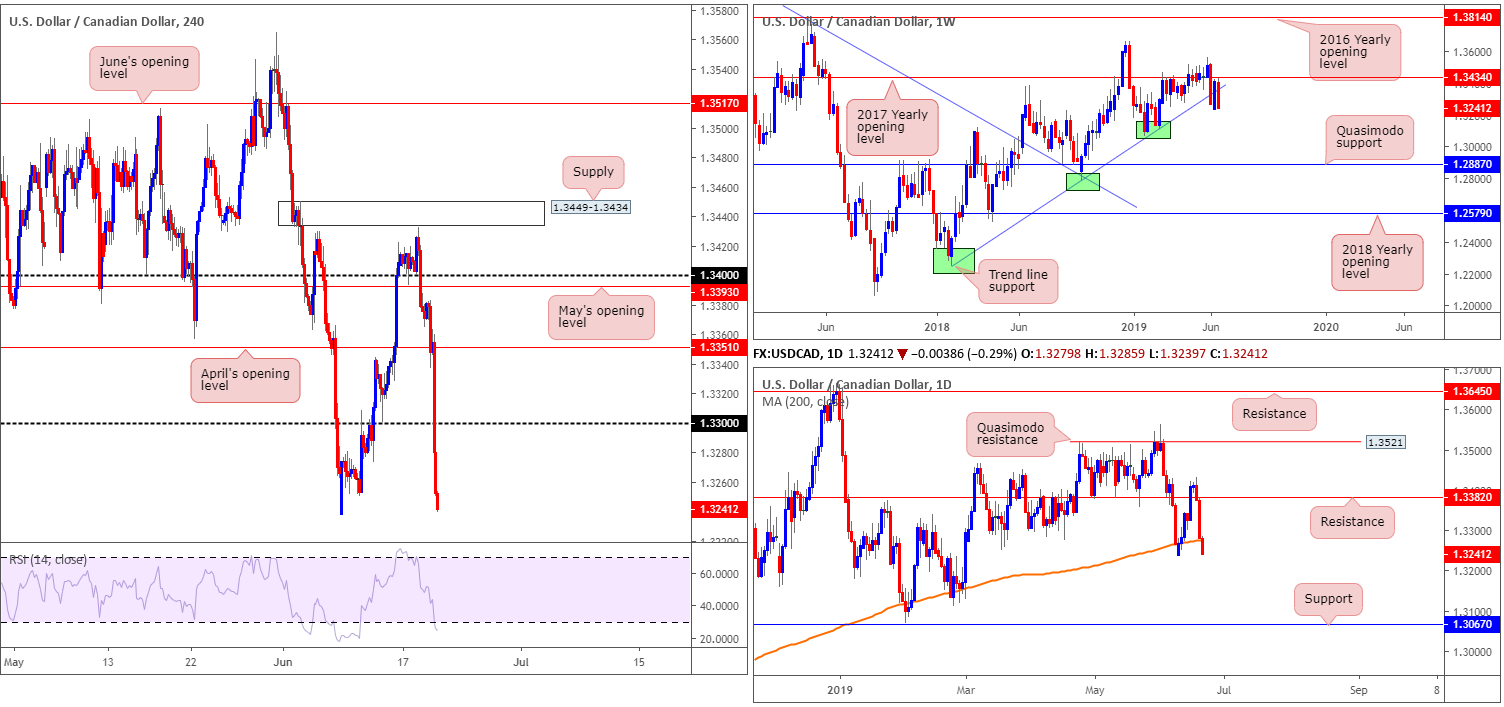
Kicking things off with a run over the weekly timeframe, we can see since recently coming within two points of the 2017 yearly opening level at 1.3434 (resistance), the pair reclaimed trend line support (extended from the low 1.2247) and is on track to push for lower ground.
A closer reading of price action on the daily timeframe recently observed the pair engulf the 200-day SMA to the downside. This has perhaps opened up the path lower to the 1.3187 February 25th low, closely shadowed by notable support at 1.3067.
With price action steaming lower in Asia today, the H4 candles are within touching distance of last week’s opening level at 1.3274. A break of this base, and we’re likely heading for the 1.32 handle.
Areas of consideration:
With all three timeframes displaying room to press lower, a retest at 1.33 would be an ideal setup to join recent selling. As highlighted in other markets, round numbers are prone to fakeouts. Therefore, it is recommended to wait and see how H4 action behaves at the underside of 1.33 before committing funds to a position. A bearish candlestick configuration would be ideal. This not only helps identify seller intent, it also provides traders entry and risk levels to work with. An alternative to this is drilling down to the lower timeframes and attempting to trade local structure: a break of trend line support or retest of demand-turned supply, for example.
Today’s data points: Philly Fed Manufacturing Index.
USD/CHF:
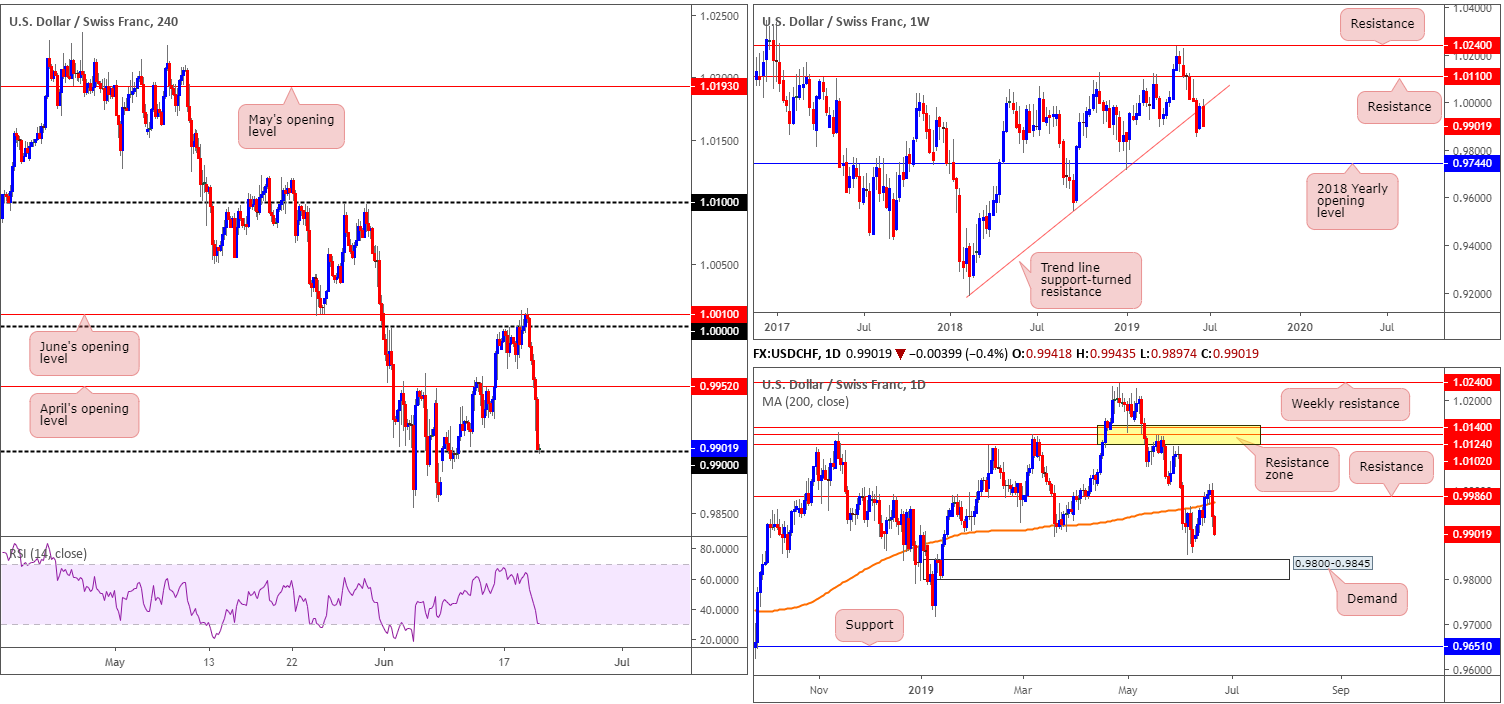
Down 0.58%, the USD/CHF discovered lower ground Wednesday after the Fed left rates unchanged between 2.25-2.50%, as expected, though did tweak the language in its statement to reflect a more dovish stance. By way of a daily bearish engulfing candle, the H4 candles failed to sustain gains above June’s opening level at 1.0010 and proceeded to engulf April’s opening level at 0.9952, consequently exposing 0.99 as the next support which has recently entered the fray.
Looking at higher-timeframe structure, the research team notes the weekly trend line support-turned resistance (taken from the low 0.9187) recently entered the mix. Continued selling from here has the 2018 yearly opening level at 0.9744 to target. Daily flow, on the other hand, shows possible support emerging from the 0.9853 June 5 low, shadowed closely by demand at 0.9800-0.9845.
Areas of consideration:
Having seen both weekly and daily timeframes suggesting further downside could be in store, the 0.99 handle as a support is perhaps fragile. For that reason, instead of looking to fade the psychological barrier, traders may want to consider selling beneath it. A H4 close below 0.99 allows traders to either sell the breakout candle and place the protective stop-loss order above its upper shadow, or simply wait and see if a retest at 0.99 develops and enter on the back of the rejection candle’s structure.
As for downside targets from 0.99, the 0.9853 June 5 low is first in line, followed closely by the top edge of demand at 0.9845.
Today’s data points: Philly Fed Manufacturing Index.
Dow Jones Industrial Average:
US stocks closed higher on Wednesday after the Federal Reserve kept interest rates unchanged, as widely expected, but signalled potential cuts later this year. The Dow Jones Industrial Average rose 0.15%, while the S&P 500 gained 0.30%. The Nasdaq 100 added 0.42%.
For traders who read Wednesday’s briefing you may recall the piece highlighted the following:
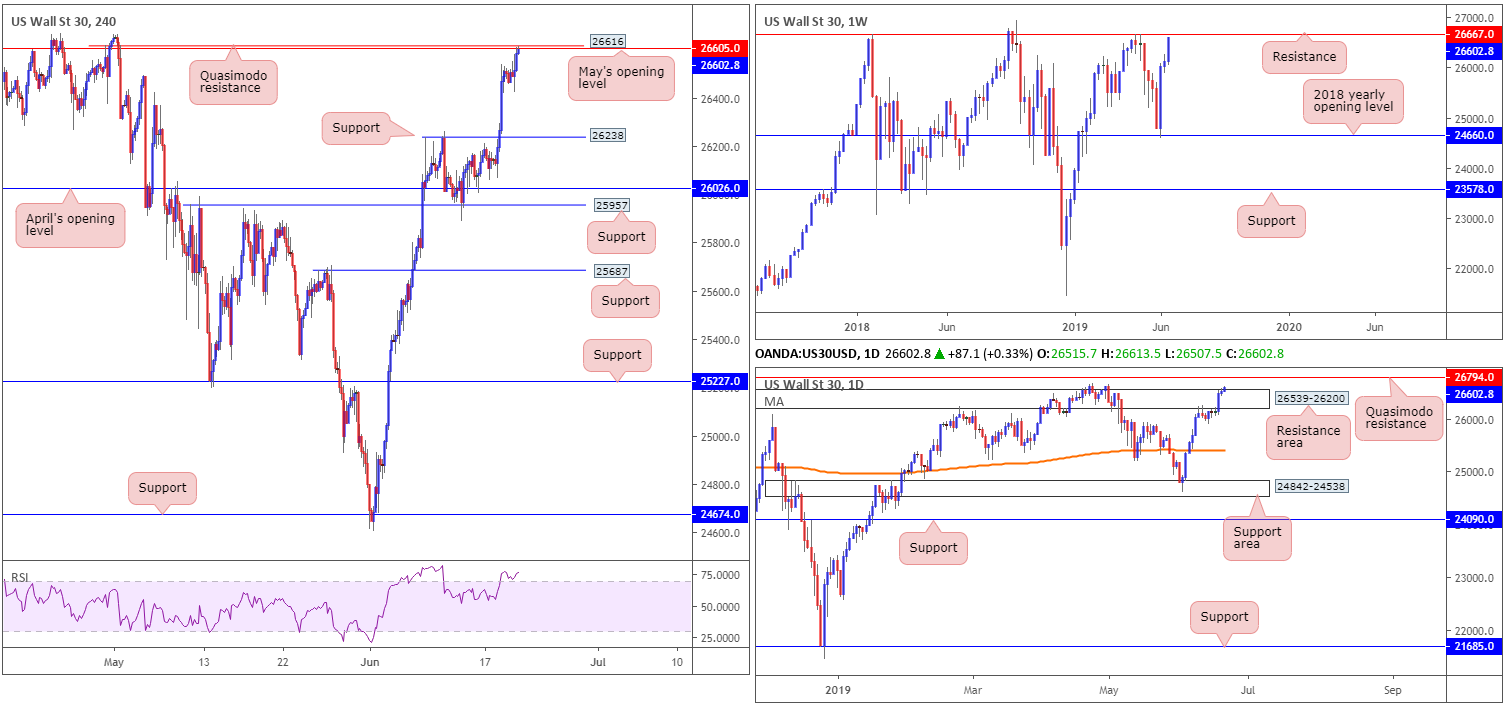
Between the weekly resistance at 26667 and May’s opening level on the H4 timeframe at 26605 (and a H4 Quasimodo resistance at 26616) is an area of interest for potential selling opportunities today.
As you can see, price action is currently testing the base of this 26667/26605.
The only drawback is the daily timeframe, which broke the top edge of a resistance area at 26539-26200 and shows room to press as far north as a daily Quasimodo resistance at 26794.
Areas of consideration:
Given we’re at a pre-determined sell zone between 26667/26605, Wednesday’s caution remains valid:
To help avoid being whipped out of a position on a deep fakeout above 26667/26605 to the daily Quasimodo resistance mentioned above at 26794, traders are urged to wait for additional confirmation to take shape before initiating a position. This could be anything from a H4 or H1 bearish candlestick configuration, a lower-timeframe MA crossover or even drilling down to the lower timeframes and attempting to trade local (price action) structure within the zone.
The next downside target from 26605 falls in around H4 support at 26238.
Today’s data points: Philly Fed Manufacturing Index.
XAU/USD (GOLD):
Since the beginning of the week, bullion is up nearly 3.00%. Wednesday saw the US dollar index turn lower from weekly resistance at 97.72 and continue to push lower in early Asia today, consequently bolstering demand for the yellow metal.
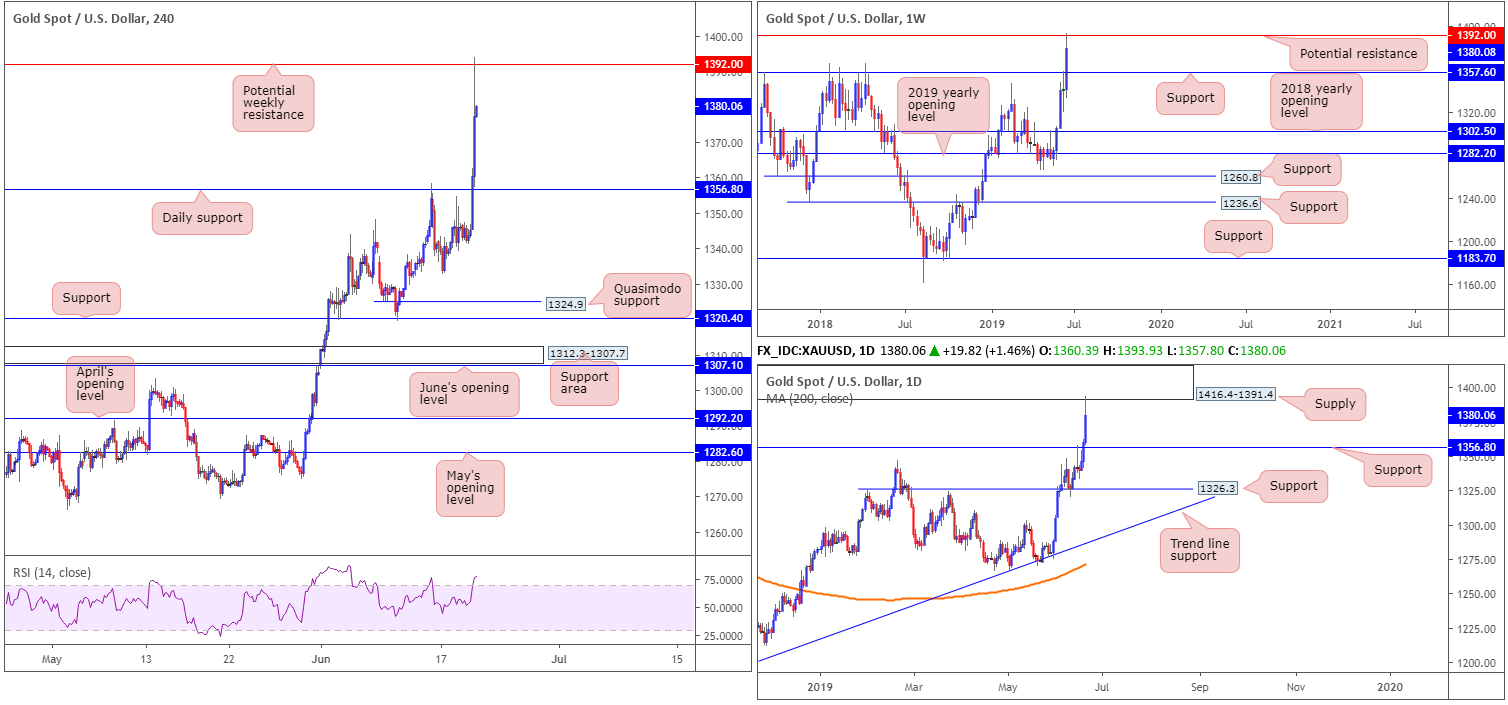
As of current price, we can see the unit mildly paring gains off potential weekly resistance at 1392.0 (the March 17, 2014 high), which combines with a daily supply area at 1416.4-1391.4. The next downside support falls in around weekly resistance-turned support at 1357.6, closely followed by a daily support at 1356.8, which was a prior Quasimodo resistance level.
Selling against the current flow of momentum would not likely end too well, even with the current higher-timeframe structure. For that reason, a long from the closely associated weekly and daily supports at 1356.8/1357.6 could be an option should we reach this low. This, however, is considered more of a longer-term position.
Areas of consideration:
In the event we test 1356.8/1357.6 today, waiting for additional confirmation is certainly worth considering. This is simply due to the buy zone offering a limited range to safely place a protective stop-loss order.
Should the market continue exploring higher ground, nonetheless, a H4 close above the weekly level at 1392.0, followed up with a retest as support, could be enough evidence to suggest daily supply at 1416.4-1391.4 is waning. For that reason, a long position, in line with the trend, could be considered with entry and risk levels determined according to the rejection candle’s structure.
The accuracy, completeness and timeliness of the information contained on this site cannot be guaranteed. IC Markets does not warranty, guarantee or make any representations, or assume any liability with regard to financial results based on the use of the information in the site.
News, views, opinions, recommendations and other information obtained from sources outside of www.icmarkets.com.au, used in this site are believed to be reliable, but we cannot guarantee their accuracy or completeness. All such information is subject to change at any time without notice. IC Markets assumes no responsibility for the content of any linked site. The fact that such links may exist does not indicate approval or endorsement of any material contained on any linked site.
IC Markets is not liable for any harm caused by the transmission, through accessing the services or information on this site, of a computer virus, or other computer code or programming device that might be used to access, delete, damage, disable, disrupt or otherwise impede in any manner, the operation of the site or of any user’s software, hardware, data or property.


