
DXY:
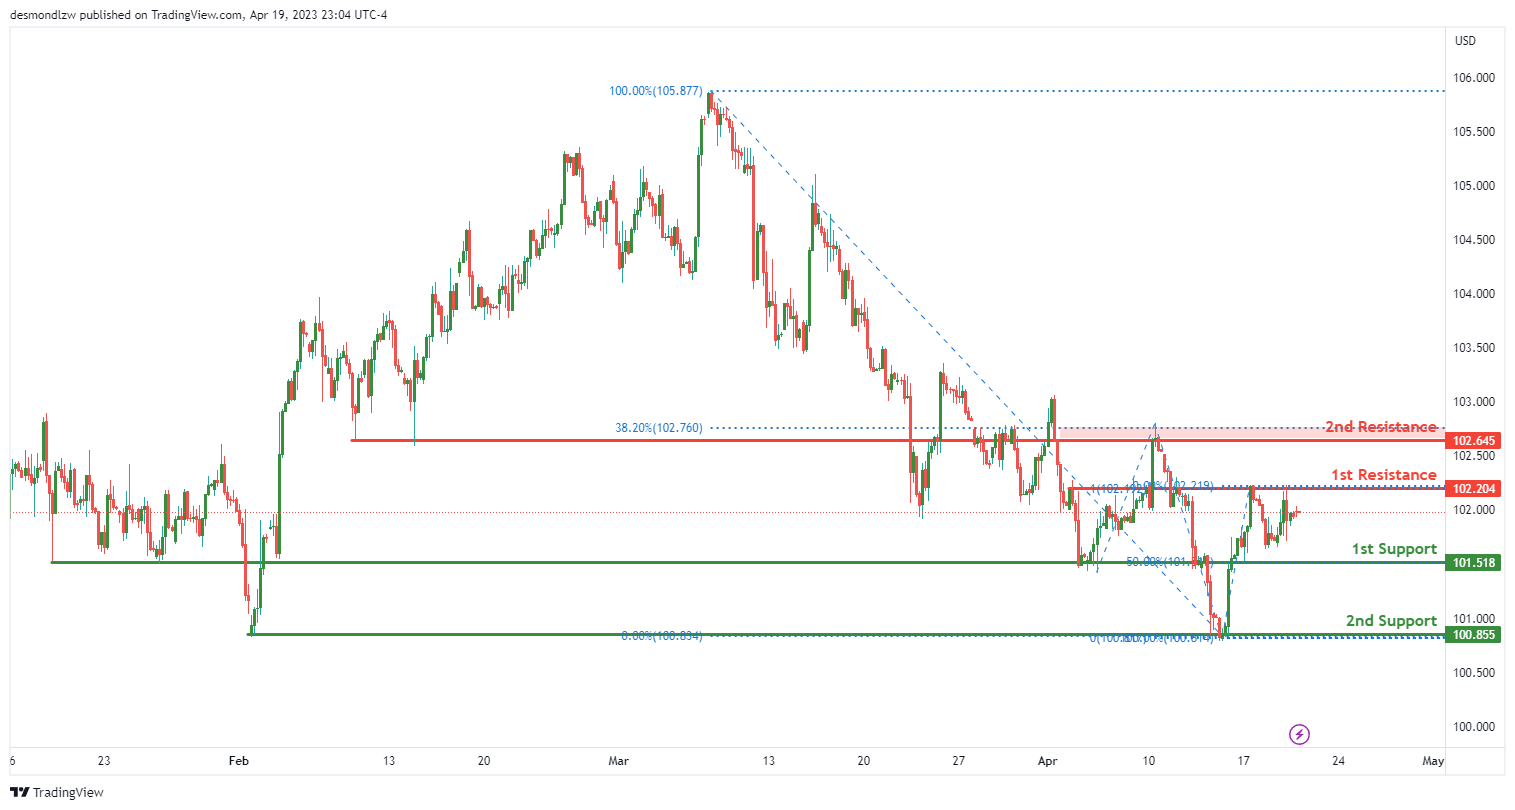
The DXY chart exhibits a neutral momentum, with potential fluctuations between the 1st resistance and 1st support level. Currently, the price is trading around the 1st resistance level at 102.20, which is a strong overlap resistance coinciding with the 100% Fibonacci projection. If price were to break above this level, it could potentially rise towards the 2nd resistance level at 102.79, which is another overlap resistance coinciding with the 38.20% Fibonacci retracement.
On the downside, the 1st support level is at 101.51, which is a significant level as it is an overlap support coinciding with the 50% Fibonacci retracement. Another support level is the 2nd support at 100.85, which is a multi-swing low support.
EUR/USD:
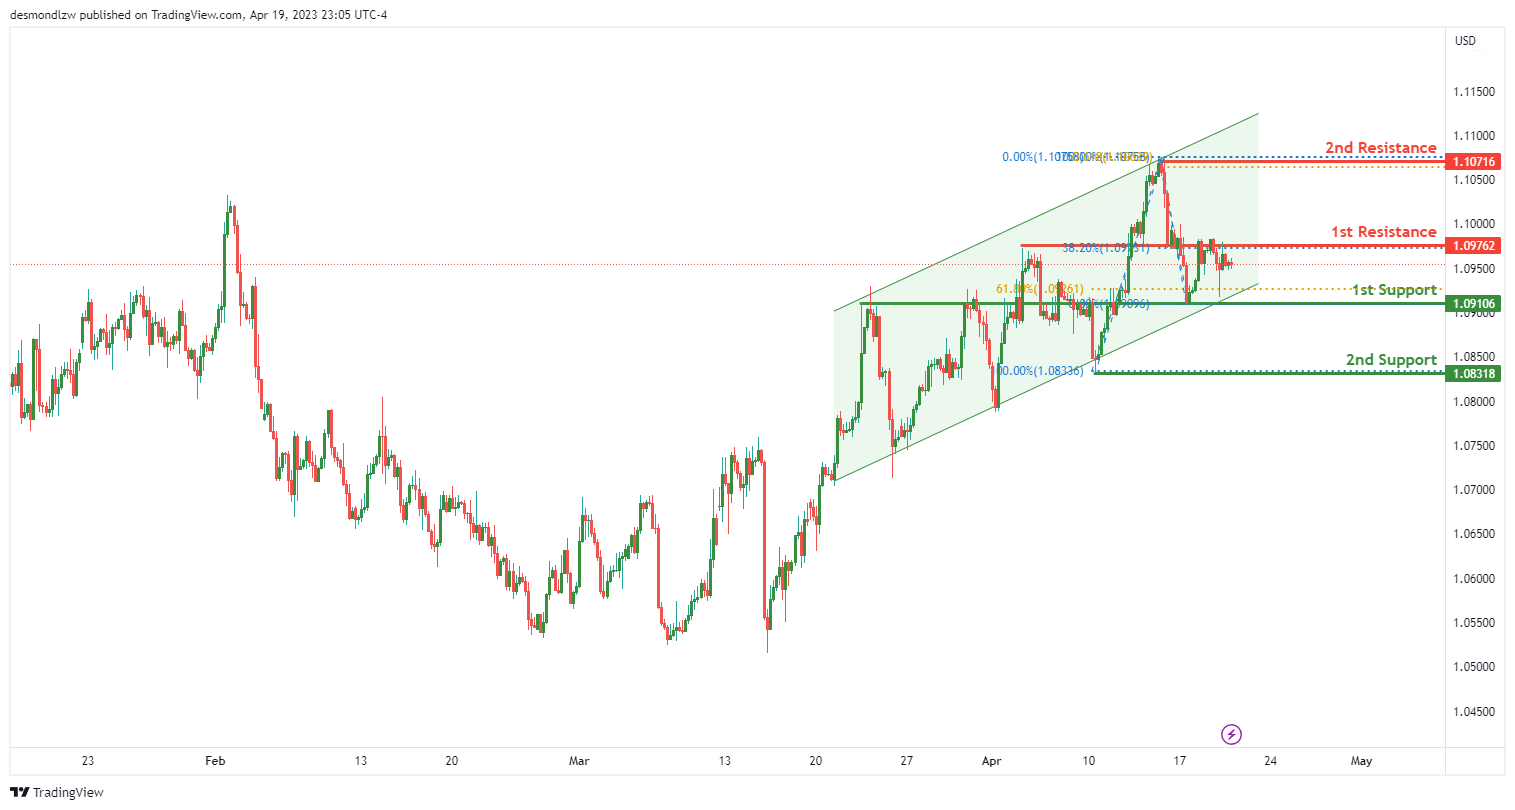
The EUR/USD chart shows strong bullish momentum as it is in a bullish ascending channel, indicating a potential continuation of the uptrend. This suggests that the price might potentially make a bullish break through the 1st resistance level and rise towards the 2nd resistance level.
The 1st support level is at 1.09, which is an overlap support and coincides with a 50% Fibonacci retracement level, making it a significant level to watch out for. Another support level is the 2nd support level at 1.08, which is a multi-swing low support.
On the other hand, the 1st resistance level is at 1.1020, which is an overlap resistance and coincides with a 100% Fibonacci projection level. The 2nd resistance level is at 1.1079, which is an overlap resistance and coincides with a 38.20% Fibonacci retracement level.
GBP/USD:
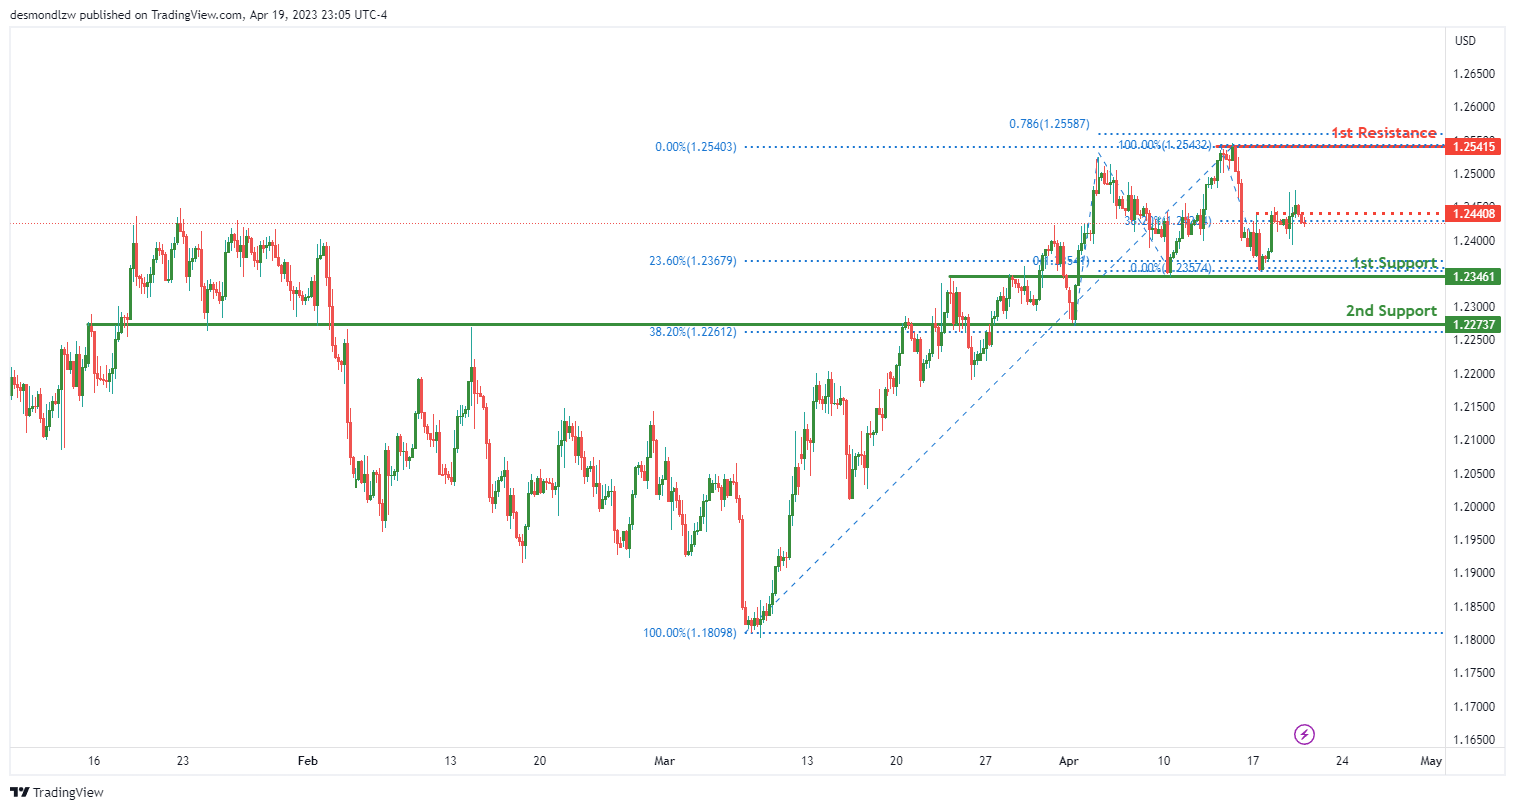
The GBP/USD chart exhibits a bullish bias, indicating a potential continuation towards the first resistance level. Price is currently trading above an ascending support line, which is in line with the bullish momentum of the chart.
The first support level is at 1.2346, which is a strong overlap support level, coinciding with the 38.20% Fibonacci retracement. The second support level is at 1.2273, which is another overlap support level.
On the other hand, the first resistance level is at 1.2541, which is a multi-swing high resistance level. It is a significant level to watch out for, as a break through this level could trigger a strong bullish acceleration towards the intermediate resistance level at 1.2440, which is also an overlap resistance and coincides with the 38.20% Fibonacci retracement.
USD/CHF:
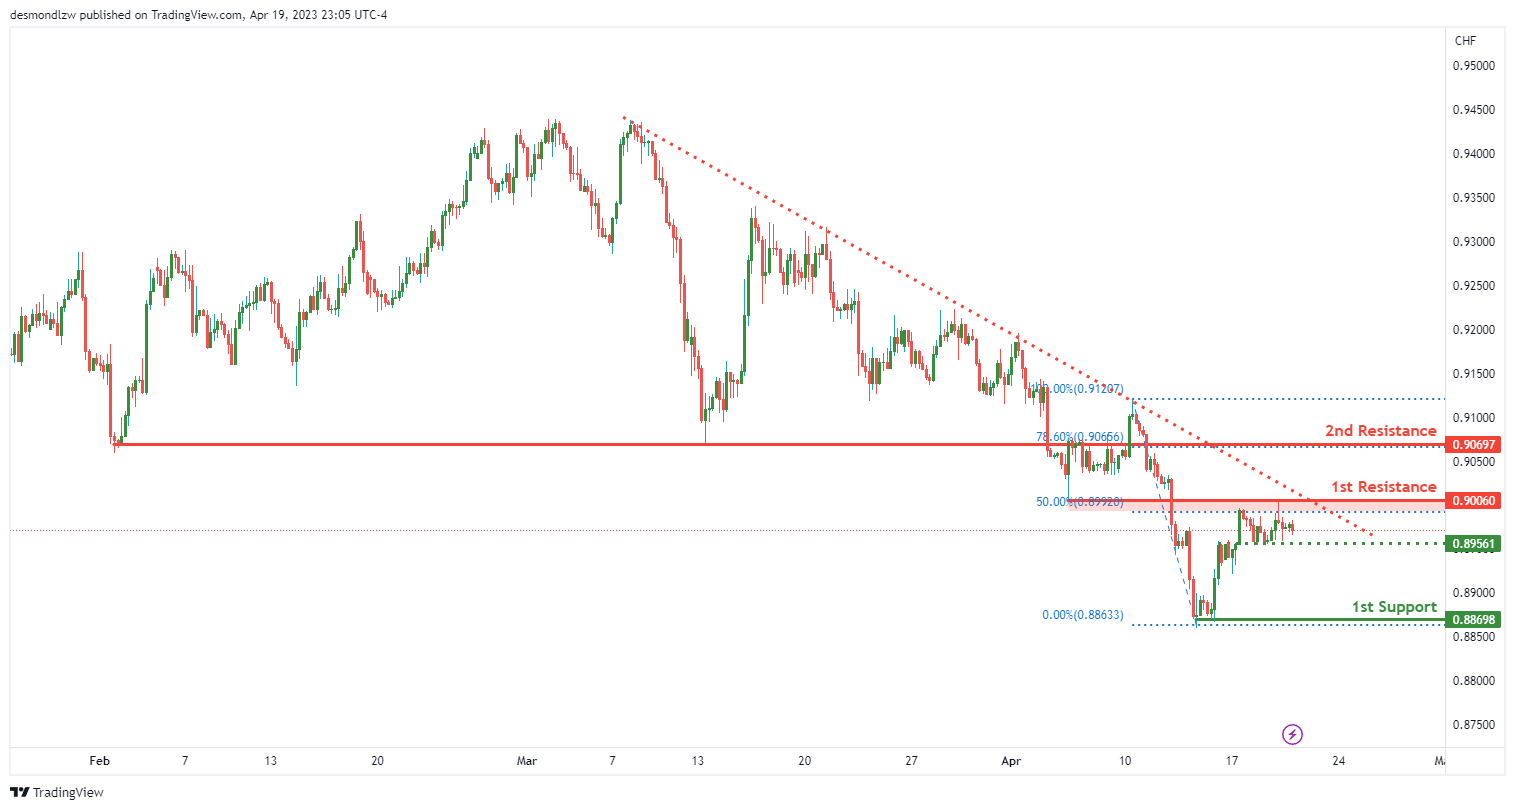
The USD/CHF chart currently shows a bearish bias as price is trading below a major descending trend line, suggesting a potential further downward movement. The first support level is at 0.8869, which is a multi-swing low support and could provide strong support for the pair. The intermediate support level is at 0.8956, which is an overlap support and could provide a short-term pause to the bearish momentum.
On the other hand, the first resistance level is at 0.9006, which is a significant level to watch out for as it is a multi-swing high resistance and coincides with a 50% Fibonacci retracement level. Another potential resistance level is at 0.9069, which is a pullback resistance and coincides with a 78.60% Fibonacci retracement level.
If price fails to break the first resistance level, it could potentially make a bearish continuation towards the first support level. However, if the first resistance level is broken, it could trigger a bullish acceleration towards the second resistance level.
USD/JPY:
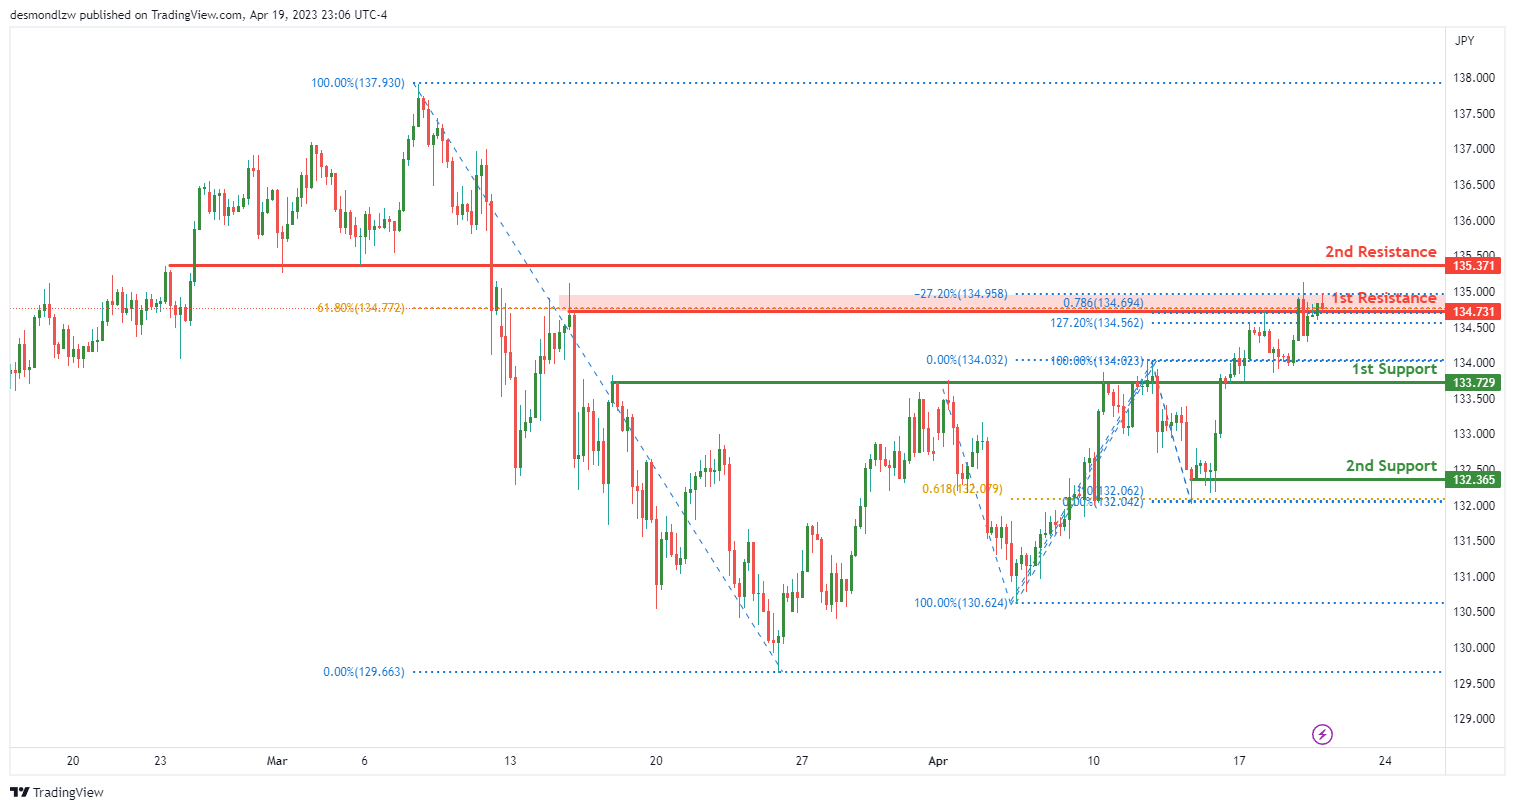
The USD/JPY chart, the overall momentum of the chart is currently bearish. This is due to the presence of a strong descending trend line, which suggests potential further downside movement.
In this scenario, the 1st support level is at 133.72, which is a good support level as it is an overlap support. The 2nd support level is at 132.36, which also serves as an overlap support and coincides with the 61.80% Fibonacci projection.
On the other hand, the 1st resistance level is at 134.73, which is a multi-swing high resistance and coincides with the 61.80% Fibonacci retracement. The 2nd resistance level is at 135.37, which serves as a pullback resistance.
If price fails to break the 1st resistance level, it could potentially make a bearish continuation towards the 1st support level. In the event that the 1st support level is breached, the next support level it could drop to is the 2nd support at 132.36.
AUD/USD:
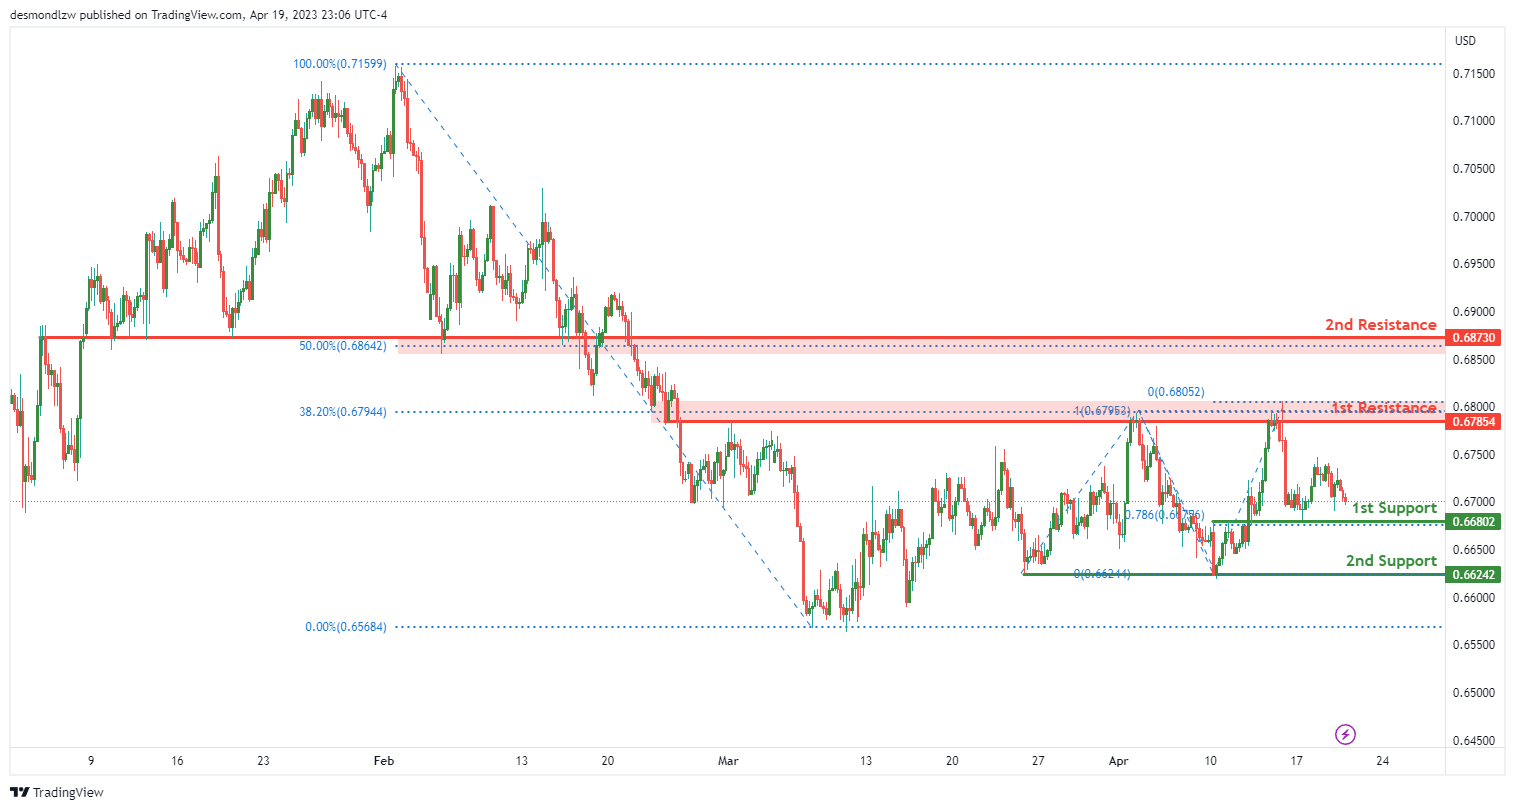
The AUD/USD chart, the overall momentum of the chart is bearish. There is a possibility of a bearish continuation towards the first support level, which is at 0.6680. This support level is a strong overlap support and coincides with the 78.60% Fibonacci projection. The second support level is at 0.6624, which is a multi-swing low support.
On the other hand, the first resistance level is at 0.6785, which is an overlap resistance and coincides with the 38.20% Fibonacci retracement level. The second resistance level is at 0.6873, which is a pullback resistance and coincides with the 50% Fibonacci retracement level.
It’s worth noting that the overall momentum of the chart is bearish, which suggests that the price may continue to move downwards. A break of the first support level could potentially trigger a strong bearish acceleration towards the second support level. However, if price were to break through the first resistance level instead, it could potentially rise towards the second resistance level.
NZD/USD:
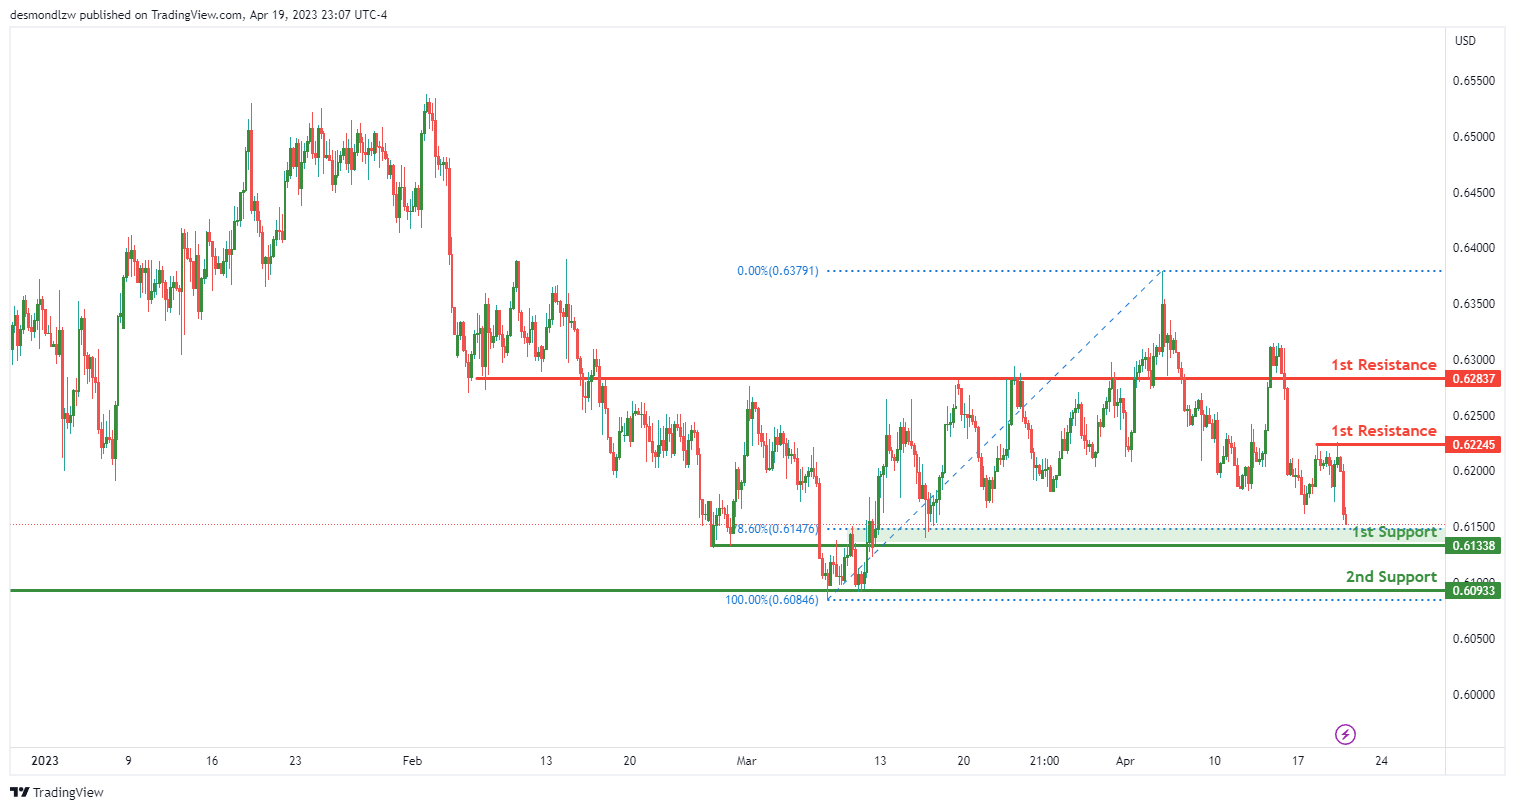
The NZD/USD chart is currently exhibiting bullish momentum overall. However, in the short term, there may be a potential drop towards the 1st support level at 0.6133, which is a strong overlap support and coincides with the 78.60% Fibonacci retracement level. If price bounces from this support, it could rise towards the 1st resistance level at 0.6224, which is a swing high resistance level.
If price manages to break above the 1st resistance level, it could potentially trigger a stronger bullish acceleration towards the 2nd resistance level at 0.6283, which is a pullback resistance level. On the other hand, if price fails to hold the 1st support level, the next support level it could drop to is the 2nd support level at 0.6093, which is a multi-swing low support level.
USD/CAD:
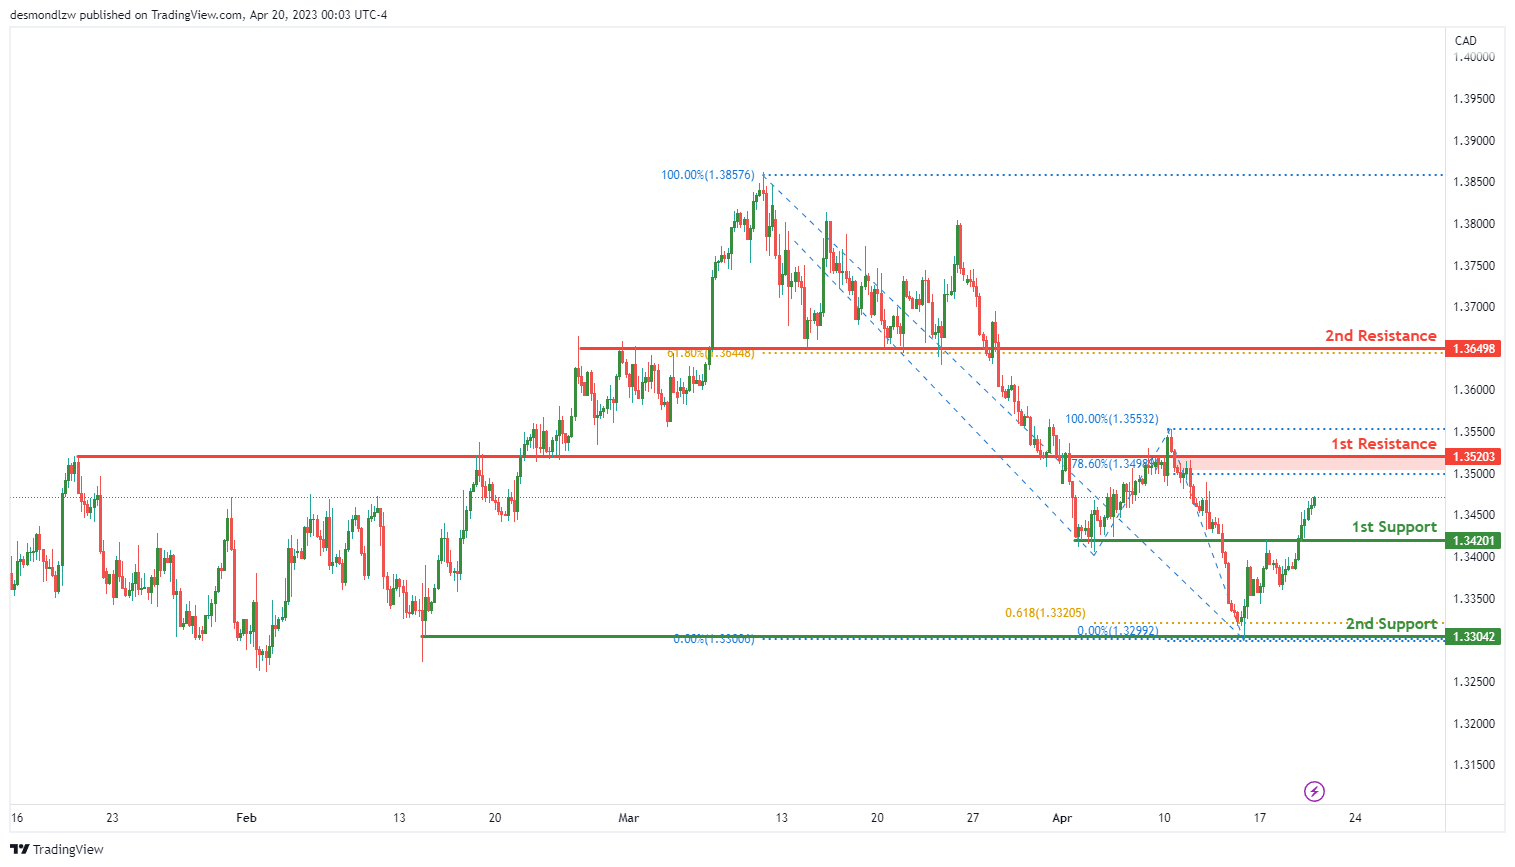
The USD/CAD chart is showing strong bullish momentum, with potential for further upside. Price is currently trading above a major descending trend line, which suggests that bullish momentum is on the cards.
If the momentum continues, there is a possibility that the price could potentially make a bullish continuation towards the first resistance level. The first support level is at 1.3420, which is a good overlap support level. It is also worth noting that this level lines up with a 23.6% Fibonacci retracement, which further strengthens its significance. Another support level is at 1.3304, which is a multi-swing low support level, coinciding with a 61.80% Fibonacci projection.
On the other hand, the first resistance level is at 1.3520, which is a pullback resistance. This level lines up with a 78.60% Fibonacci retracement, further adding to its strength. The second resistance level is at 1.3649, which is another pullback resistance, coinciding with a 61.80% Fibonacci retracement.
DJ30:
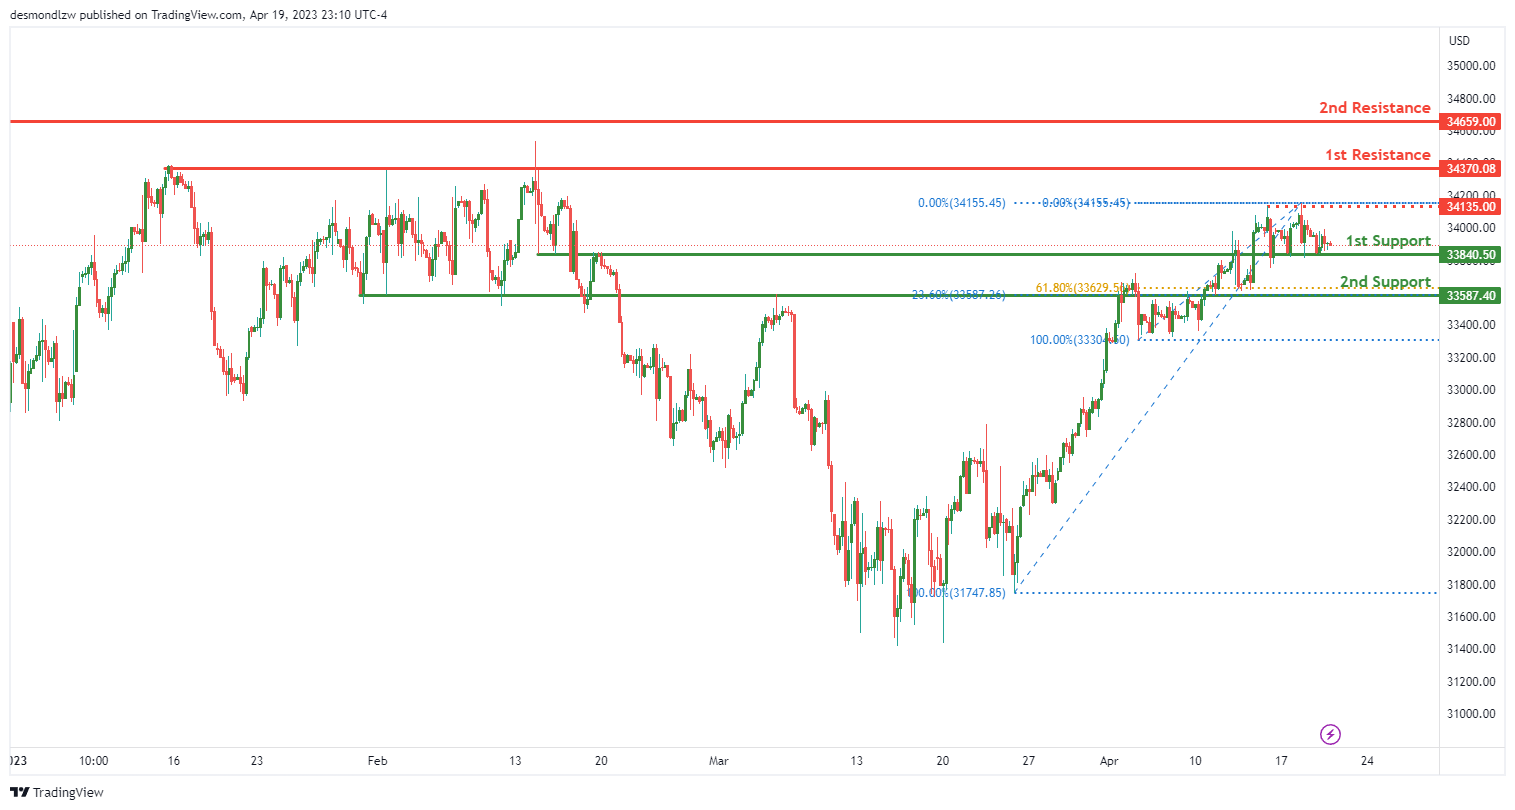
DJ30 chart analysis: Potential for short-term drop before a bounce towards resistance
The overall momentum of the DJ30 chart is bullish, suggesting that prices might continue to rise. However, the short-term momentum seems bearish as the price could potentially drop to the 1st support before bouncing back towards resistance.
The 1st support is at 33840.50, which is a good overlap support level. Another support level is the 2nd support level at 33587.40, which is a multi-swing low support and lines up with the 61.80% Fibonacci retracement.
On the other hand, the 1st resistance level is at 34370.08, which is a multi-swing high resistance level. The 2nd resistance level is at 34659.00, which is a swing high resistance. An intermediate resistance level can be found at 34135.00, which is a multi-swing high resistance level.
It’s worth noting that the overall momentum is bullish, and if the short-term drop occurs and the price bounces from the support level, it could potentially rise towards the resistance levels. However, if the price were to break the 1st support, the next support level it could drop to is the 2nd support level down at 33587.40.
GER30:
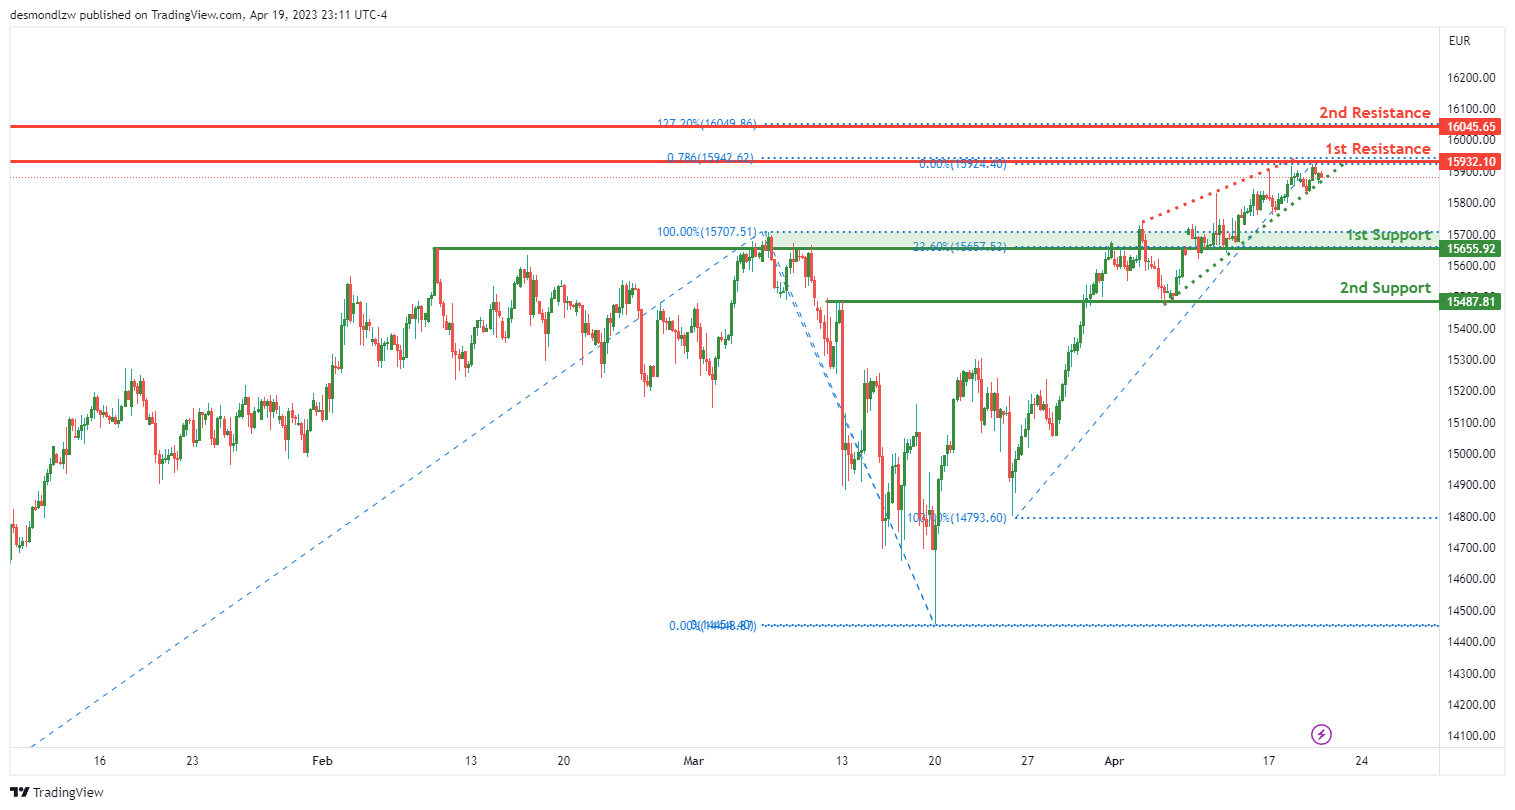
The overall momentum of GER30 is bearish, with the rising wedge pattern suggesting an imminent breakout to the downside. The potential move is a bearish reaction off the 1st resistance level, dropping towards the 1st support level.
The 1st support level at 15655.92 is an overlap support and lines up with a 23.60% Fibonacci retracement, making it a strong support level. If price were to break below this level, it could drop towards the 2nd support level at 15487.81, which is also an overlap support.
On the other hand, the 1st resistance level at 15932.10 is a multi-swing high resistance level, making it a strong resistance level. If price were to break above this level, it could potentially rise towards the 2nd resistance level at 16045.65, which is a swing high resistance and lines up with a 127.20% Fibonacci extension.
However, given the overall bearish momentum of the chart and the rising wedge pattern, a bearish continuation is more likely. Thus, a bearish reaction off the 1st resistance level is expected, with a drop towards the 1st support level.
BTC/USD:
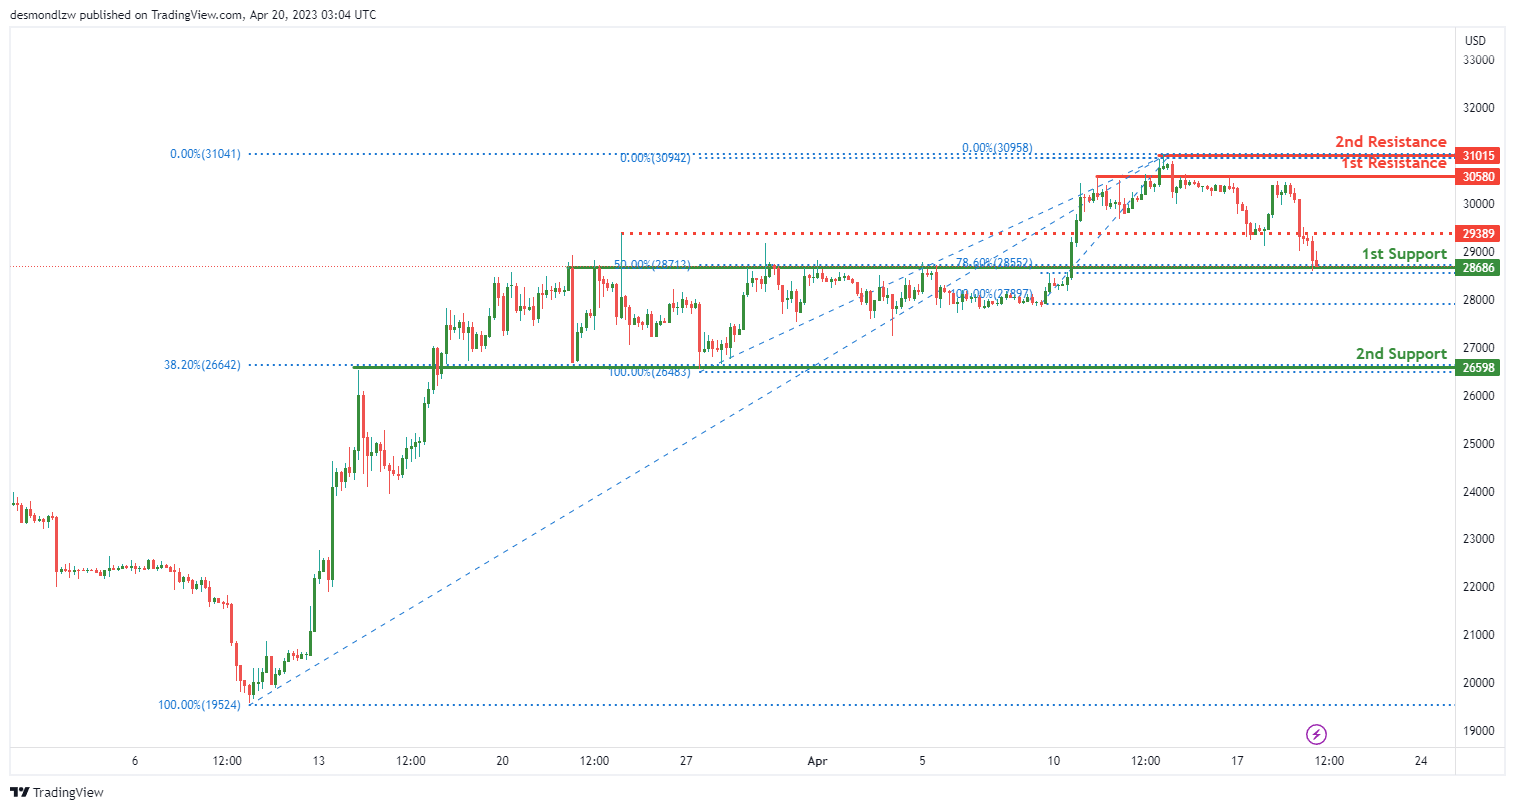
The BTC/USD chart is currently bullish, with prices potentially heading towards the first resistance level after a potential bounce off the first support level. The first support level at 28686 is a pullback support and is accompanied by a 50% Fibonacci retracement level, making it a strong support level. If prices bounce from this level, they could potentially rise towards the first resistance level at 30580, which is an overlap resistance.
The second support level at 26598 is another strong support level, as it is an overlap support accompanied by a 38.20% Fibonacci retracement level. However, if prices break below this level, they could drop towards the lower levels of support.
On the upside, the second resistance level at 31015 is a swing high resistance level and could prove to be a challenge for prices to break above. However, if prices manage to break above this level, they could potentially rise further.
In addition, there is an intermediate resistance level at 29389, which is also an overlap resistance level. If prices manage to break above this level, it could trigger a stronger bullish acceleration towards the first resistance level.
US500
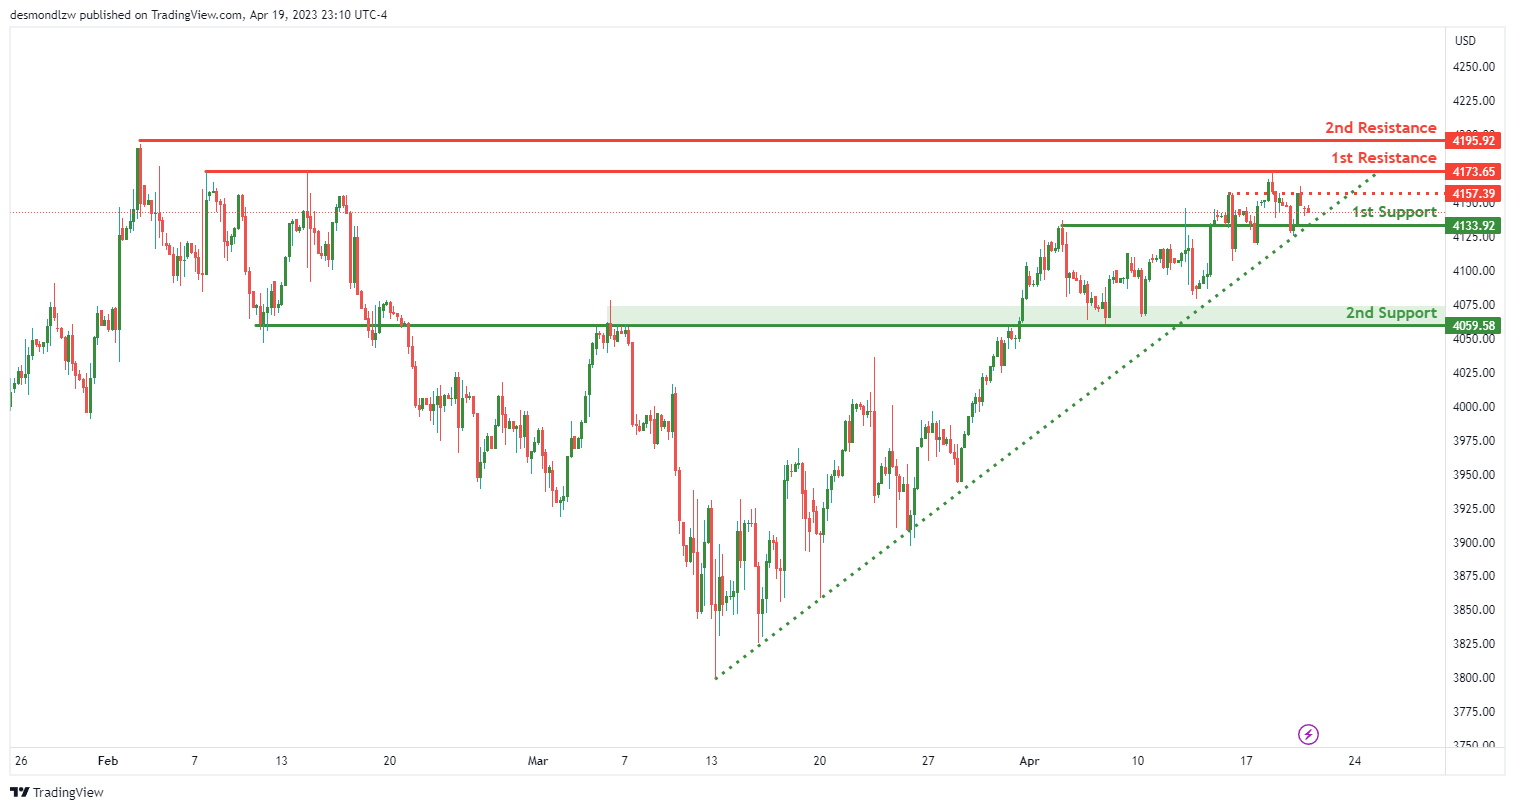
The US500 index is showing strong bullish momentum as it continues to trade above a major ascending trend line. This suggests that further gains could be on the horizon for the US stock market.
At present, the price is hovering around the 1st support level of 413.92. This is a good level for a bullish bounce as it is an overlap support level that provides a strong foundation for the index. Additionally, the 2nd support level at 4059.58 is also a good level to keep an eye on as it is an overlap support level.
If the price bounces from the 1st support level, it could head towards the 1st resistance level of 4173.65. This is a multi-swing high resistance level that will require significant bullish momentum to break. If the price breaks through this level, it could potentially continue to rise towards the 2nd resistance level of 4195.92, which is a swing high resistance level.
It’s worth noting that there is an intermediate resistance level at 4157.39, which is also an overlap resistance level. If the price is able to break through this level, it could indicate a strong bullish move towards the 1st resistance level.
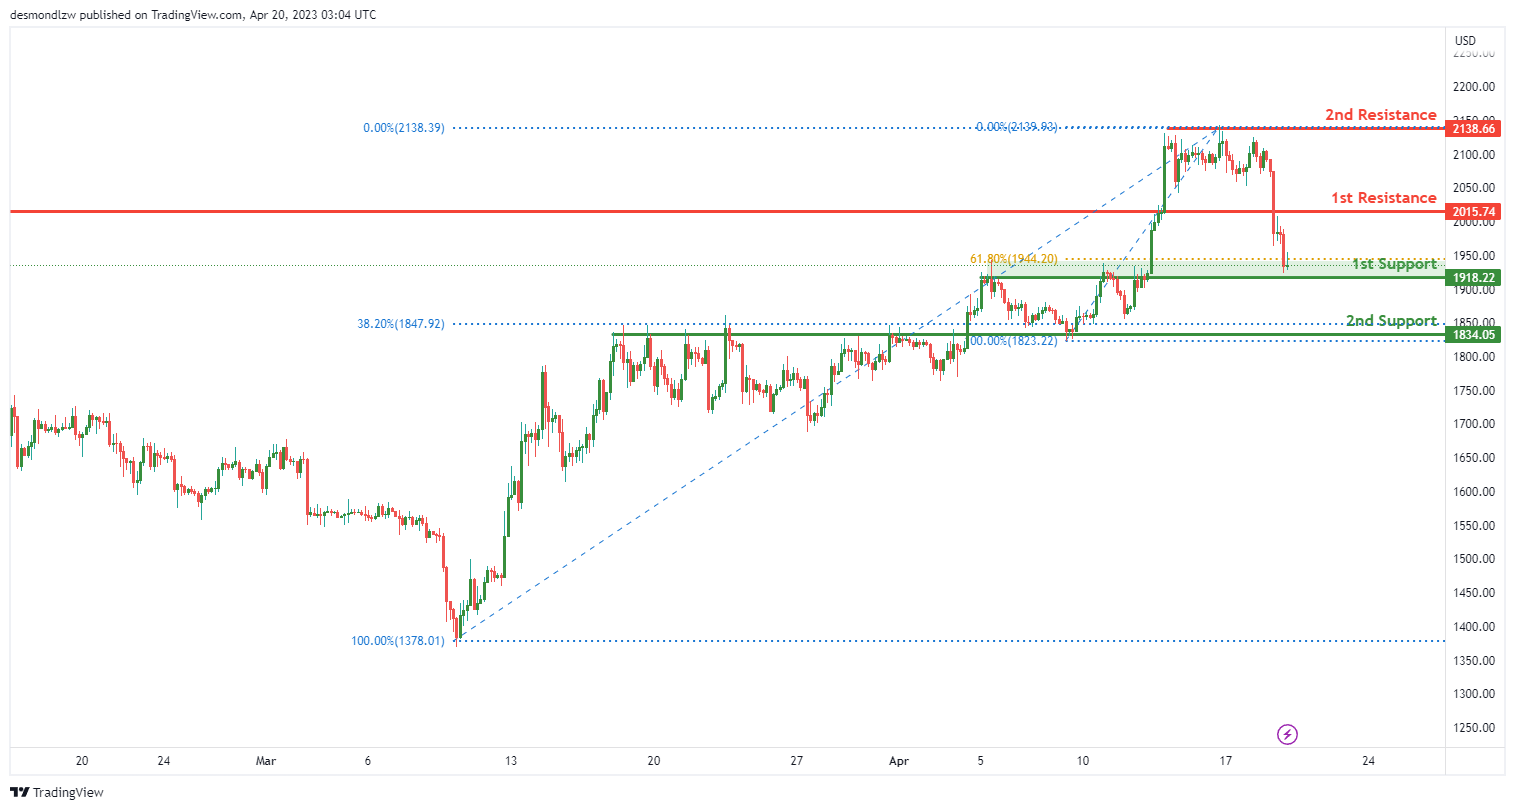
ETH/USD:
the ETH/USD chart shows an overall bullish momentum, which suggests that the price might continue to rise due to its bullish momentum. The potential price action could see a bullish bounce off the first support and head towards the first resistance.
The first support level for ETH/USD is at 1918.22, which is an overlap support and also coincides with the 61.80% Fibonacci retracement level. This support level has the potential to provide a strong buying opportunity for traders.
The second support level is at 1834.05, which is another overlap support and coincides with the 38.20% Fibonacci retracement level. This level is also important as it could provide a good buying opportunity for traders looking to enter the market.
On the upside, the first resistance level is at 2015.74, which is a pullback resistance level. This level could act as a temporary resistance, and if the price manages to break above it, it could continue to rise towards the second resistance level at 2138.66, which is a swing high resistance level.
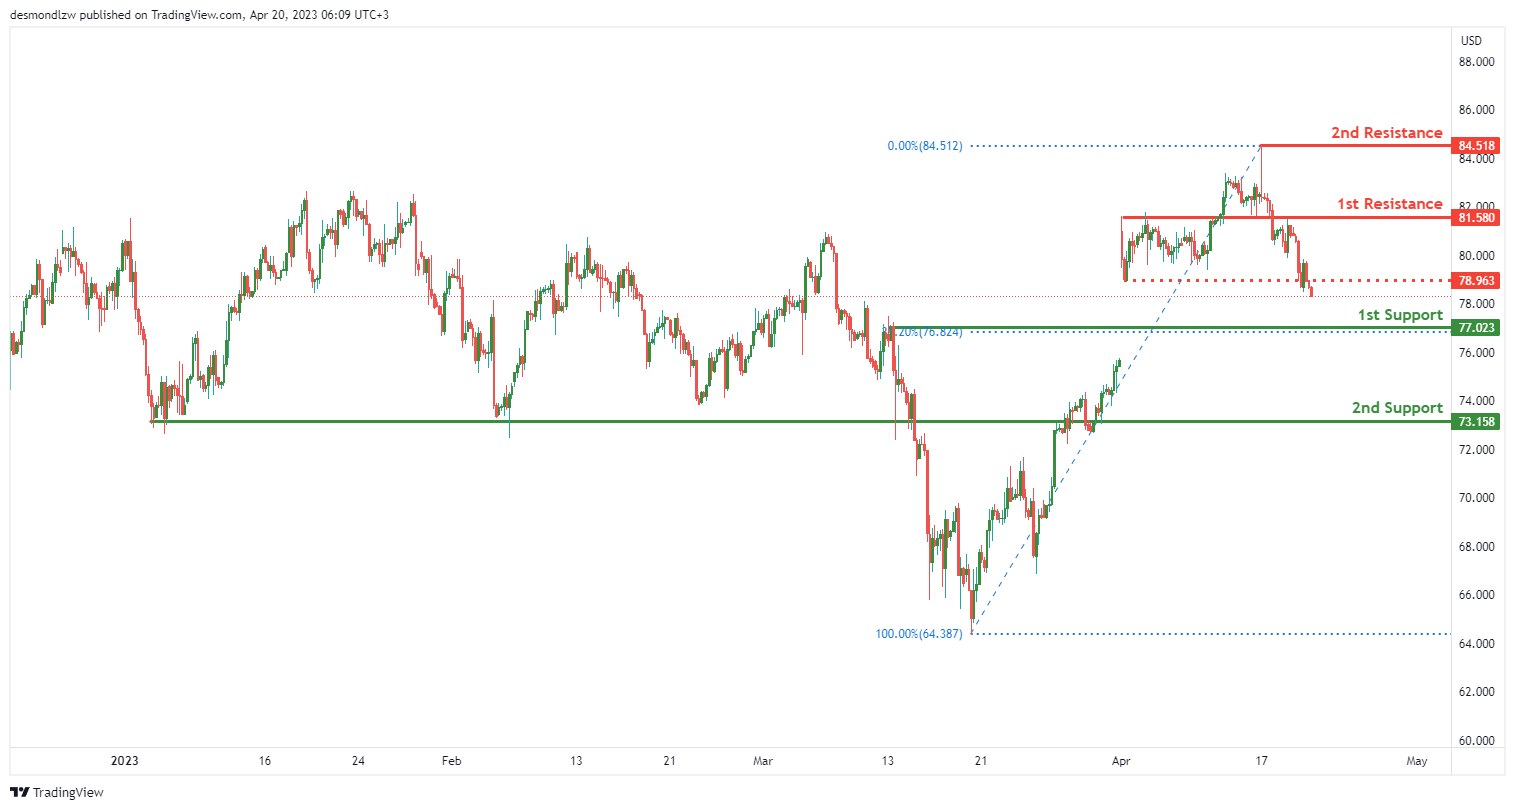
WTI/USD:
The overall momentum of WTI crude oil is bearish, and price could potentially make a bearish continuation towards the first support level. The swing low support at 77.02 is the first support level, followed by the overlap support at 73.15.
On the upside, the first resistance level is at 81.58, which is an overlap resistance. The swing high resistance is at 84.51, which is the second resistance level. Additionally, there is an intermediate resistance at 78.96, which is a pullback resistance.
The 38.20% Fibonacci retracement level at 77.02 is a good support level. If price breaks below this level, it could drop to the next support level at 73.15, which is also an overlap support.
On the upside, the first resistance level at 81.58 is a good level for traders to watch. If price manages to break above this level, it could rise to the second resistance level at 84.51, which is a swing high resistance.
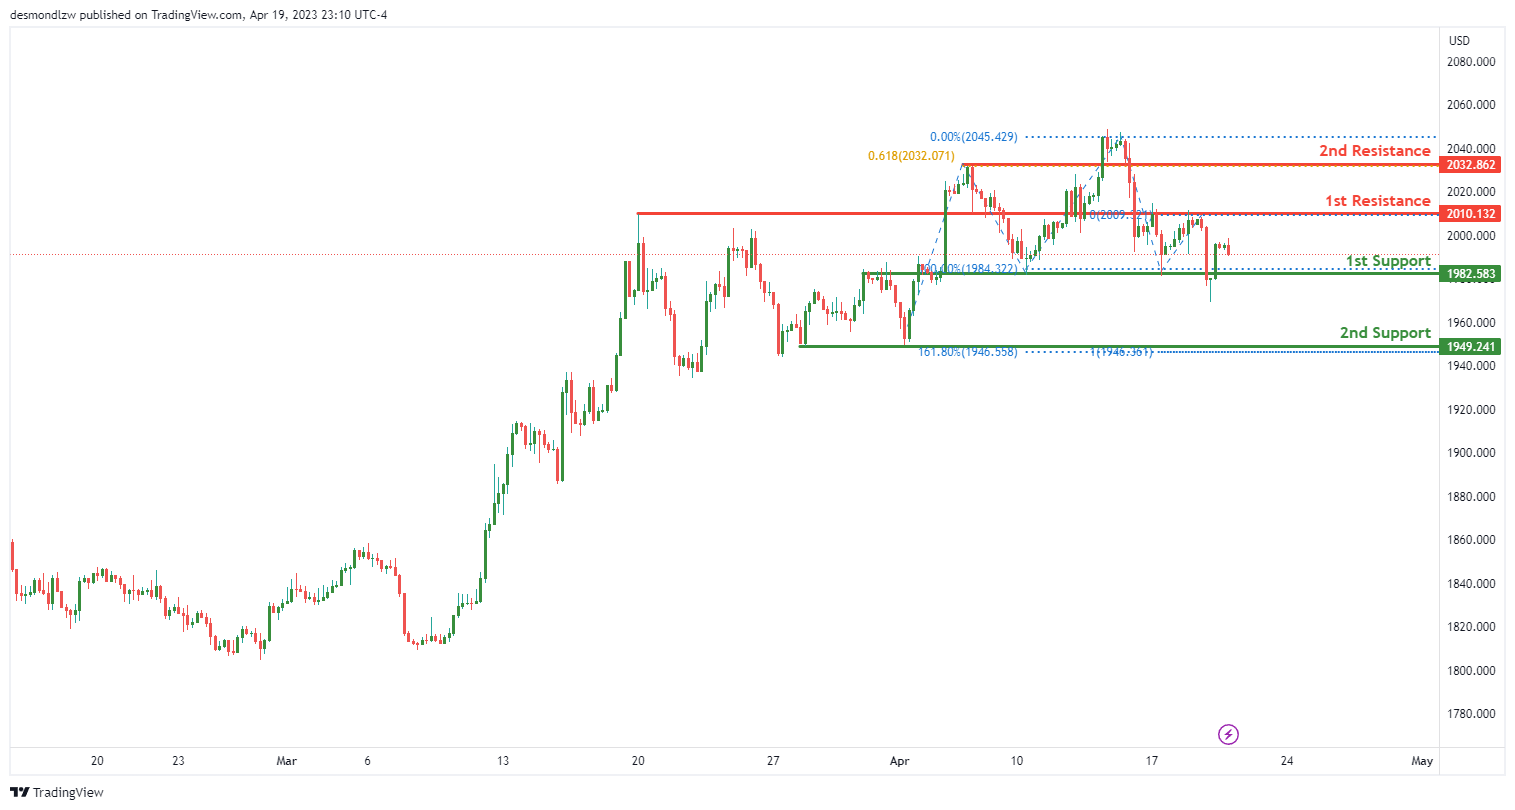
XAU/USD (GOLD):
Gold (XAU/USD) continues to show a bearish momentum on the chart. Currently, the price is expected to break below the 1st support level and drop towards the 2nd support level. The 1st support level is at 1982.58, which is a good level because it is an overlap support. The 2nd support level is at 1949.24, which is a swing low support and a 161.80% Fibonacci extension level.
On the resistance side, the 1st resistance level is at 2010.13, which is an overlap resistance level. The 2nd resistance level is at 2032.86, which is a pullback resistance level and a 61.80% Fibonacci projection level.
Overall, the momentum of the chart is still bearish, and the price is expected to drop towards the 2nd support level. If the price manages to break above the 1st resistance level, it could signal a potential shift in momentum towards the bullish side.
The accuracy, completeness and timeliness of the information contained on this site cannot be guaranteed. IC Markets does not warranty, guarantee or make any representations, or assume any liability regarding financial results based on the use of the information in the site.
News, views, opinions, recommendations and other information obtained from sources outside of www.icmarkets.com, used in this site are believed to be reliable, but we cannot guarantee their accuracy or completeness. All such information is subject to change at any time without notice. IC Markets assumes no responsibility for the content of any linked site.
The fact that such links may exist does not indicate approval or endorsement of any material contained on any linked site. IC Markets is not liable for any harm caused by the transmission, through accessing the services or information on this site, of a computer virus, or other computer code or programming device that might be used to access, delete, damage, disable, disrupt or otherwise impede in any manner, the operation of the site or of any user’s software, hardware, data or property.


