
A note on lower timeframe confirming price action…
Waiting for lower timeframe confirmation is our main tool to confirm strength within higher timeframe zones, and has really been the key to our trading success. It takes a little time to understand the subtle nuances, however, as each trade is never the same, but once you master the rhythm so to speak, you will be saved from countless unnecessary losing trades. The following is a list of what we look for:
- A break/retest of supply or demand dependent on which way you’re trading.
- A trendline break/retest.
- Buying/selling tails/wicks – essentially we look for a cluster of very obvious spikes off of lower timeframe support and resistance levels within the higher timeframe zone.
- Candlestick patterns. We tend to only stick with pin bars and engulfing bars as these have proven to be the most effective.
We search for lower timeframe confirmation between the M15 and H1 timeframes, since most of our higher-timeframe areas begin with the H4. Stops are usually placed 5-10 pips beyond confirming structures.
EUR/USD:
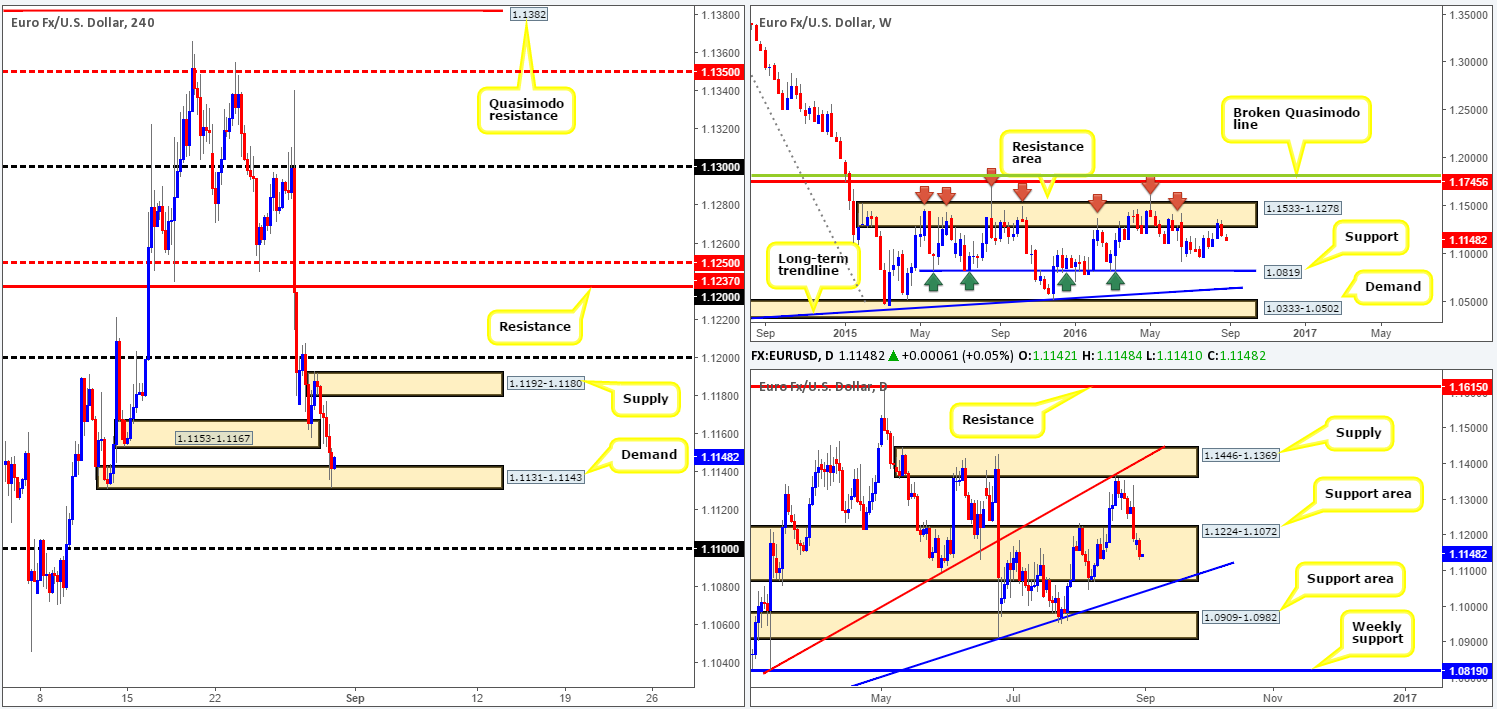
On the EUR/USD pair the balance of bids to offers appears even right now, with July’s US ADP Non-farm employment report largely being ignored during yesterday’s session. H4 candles are currently seen locked between a demand zone chalked up at 1.1131-1.1143 and a resistance area coming in at 1.1153-1.1167. A break north from here would likely prompt further upside towards supply at 1.1192-1.1180, followed closely by the 1.12 handle. Conversely, a push below this temporary range would likely see the EUR shake hands with the 1.11 region.
Higher-timeframe technicals show weekly price is trading from a major resistance area at 1.1533-1.1278. Should the bears remain dominant from here, the next downside targets to have an eye on falls in around the 1.0970 region, followed closely by a major support seen at 1.0819. On the other side of the field, however, daily action currently occupies a support area at 1.1224-1.1072.
Our suggestions: On the whole, we’re finding this pair rather restricted. Firstly, there’s very little room for the H4 candles to stretch their legs within its current range, and also beyond its barriers. Secondly, a long trade in this market would place one against potential weekly sellers, but in-line with daily structure, and vice versa for a short. With that in mind, we have come to the conclusion that it may be better to lay low until we see clearer direction form in this market.
On the data front, traders are now looking towards the US unemployment claims and manufacturing data, as well as Friday’s hard-hitting US NFP report.
Levels to watch/live orders:
- Buys: Flat (Stop loss: N/A).
- Sells: Flat (Stop loss: N/A).
GBP/USD:
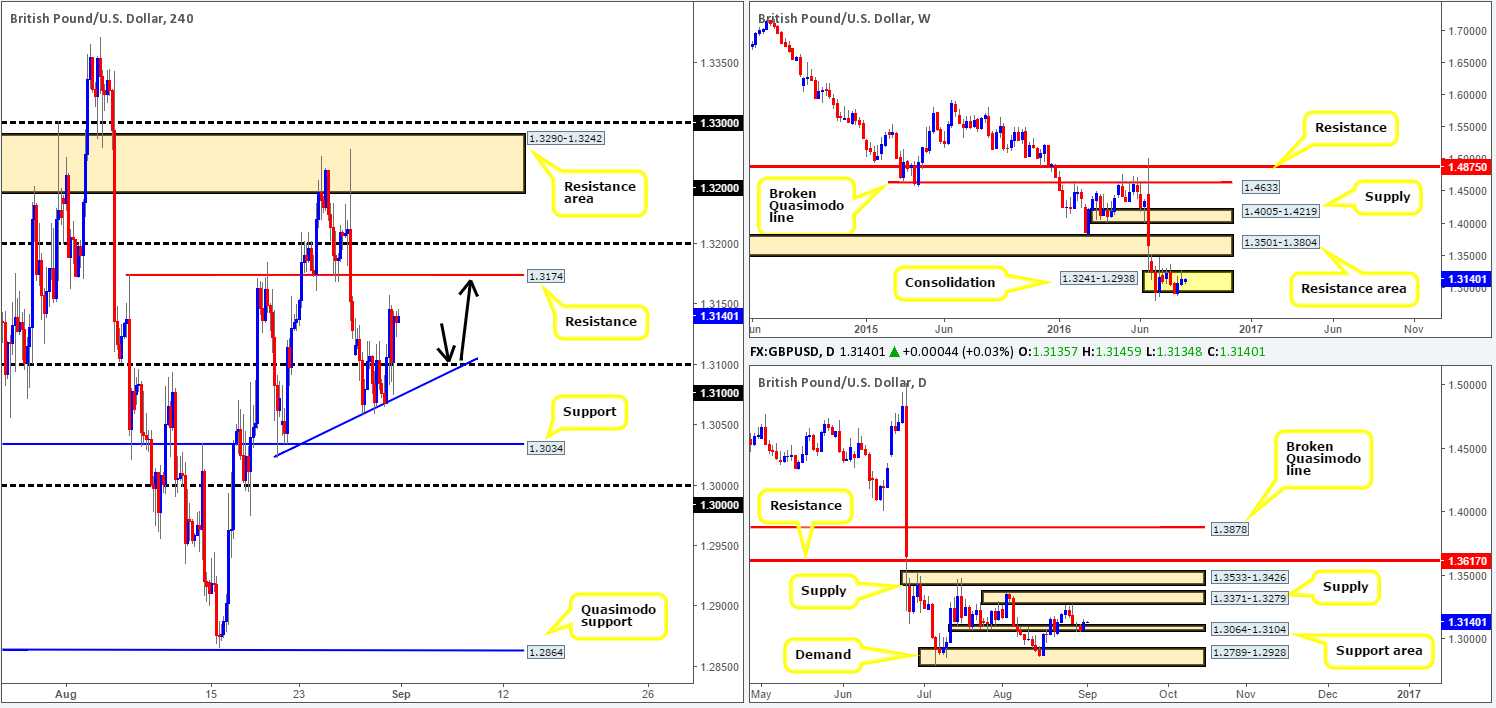
GBP bulls went on the offensive early on during yesterday’s sessions, eventually forcing the unit to close above the 1.31 handle. Shortly after, as you can see, price retested this boundary as support and extended up to the 1.3150ish range. Should the pair remain bid price will likely extend north up to the H4 resistance line at 1.3174, and quite possibly the 1.32 handle.
In support of a move higher today, over on the daily chart cable recently printed a strong bull candle from a support area coming in at 1.3064-1.3104, consequently wiping out Friday and Monday’s losses. Should this encourage further buying, the next upside barrier to keep a tab on is the supply zone registered at 1.3371-1.3279. Despite this, let’s not forget that this pair remains entrenched within a rather steep bearish trend that can be seen clearly on the weekly chart.
Our suggestions: Watch for price to retest the 1.31 band today. Assuming that price holds and prints a lower timeframe buy signal (see the top of this report), we would consider buying this market targeting 1.3174/1.32. If price tags 1.3174 before connecting with 1.31, however, we’d consider this trade invalid.
On the docket today, we have manufacturing data for both the UK and US, along with US unemployment claims. Therefore, do remain vigilant during those times guys!
Levels to watch/live orders:
- Buys: 1.31 region [Tentative – confirmation required] (Stop loss: dependent on where one confirms this area).
- Sells: Flat (Stop loss: N/A).
AUD/USD:
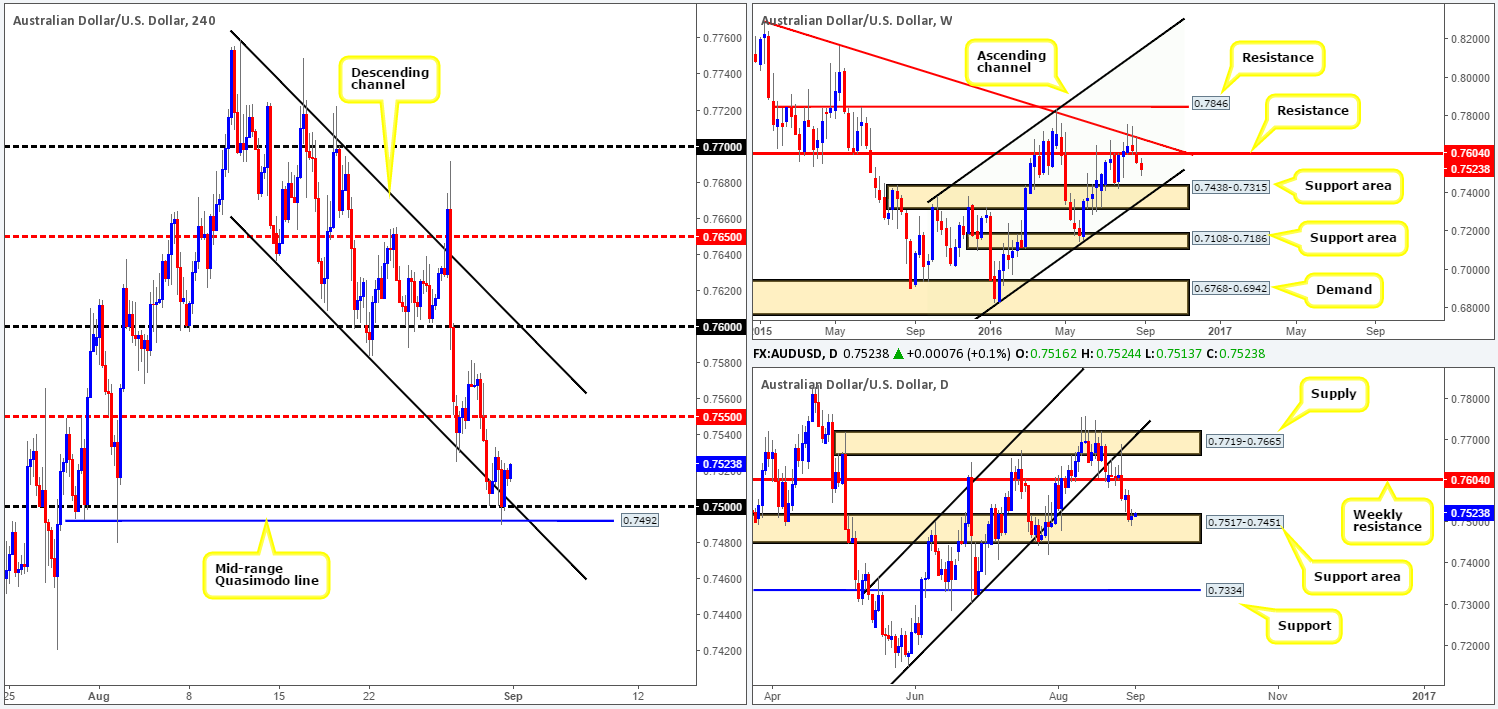
During the course of yesterday’s sessions, we saw the Aussie whipsaw through the 0.75 handle and tag in bids sitting just below it at 0.7492: a H4 mid-range Quasimodo support. With prices now seen loitering just above the 0.75 number, what’s likely in store for this market today? Well, weekly movement shows room to continue declining lower towards a support area at 0.7438-0.7315, and daily price is currently kissing the top edge of a support area at 0.7517-0.7451, consequently making the pair difficult to read. Even more so considering that in about an hour’s time from now, Aussie retail sales and private capital expenditure data will take center stage in the markets!
Our suggestions: We did initially report to watch for a bullish close back into the H4 channel support (0.7636), which did happen, but was unfortunately too large for us regarding stop-loss placement. Given the recent H4 two-candle whipsaw, we would usually look to buy now with stops just below the 0.7492 area. However, in light of the incoming Aussie data, we are going to sit on our hands for the time being and see how the market responds before making any further decisions.
Levels to watch/live orders:
- Buys: Flat (Stop loss: N/A).
- Sells: Flat (Stop loss: N/A).
USD/JPY:
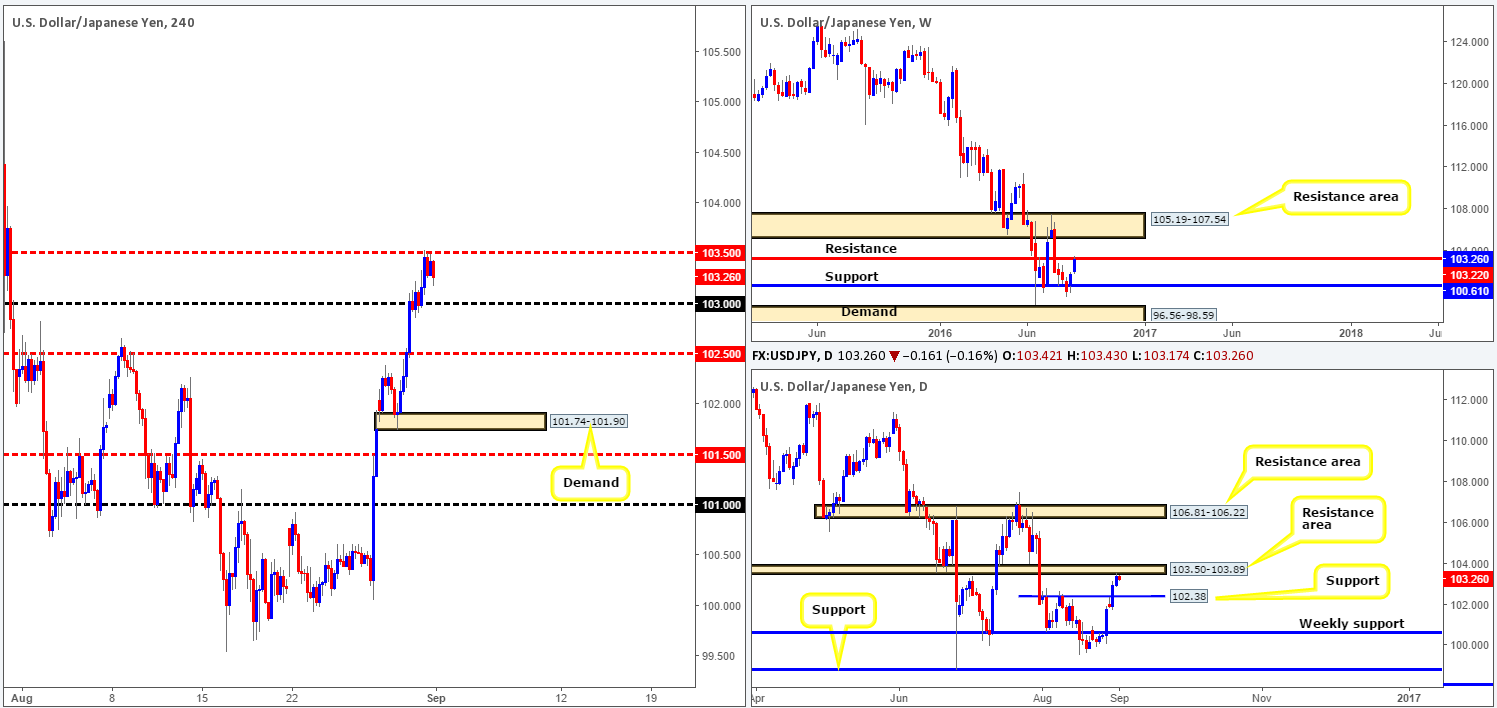
Beginning with a look at the weekly chart this morning, traders can see that price recently collided with a resistance level seen at 103.22. A rotation from here could potentially push the pair back down to retest support coming in at 100.61. Turning our attention to the daily chart, price has also connected with a resistance area drawn from 103.50-103.89. The next downside target from this angle, however, falls in at 102.38: a support level. Stepping across to the H4 chart, we can see that price began topping out around the mid-way resistance 103.50 level during yesterday’s London morning session.
Our suggestions: Quite simply, we’re now looking for the sellers to prove their selves. A close below the 103 handle would, in our opinion, do just that. Should this come into view followed by a convincing retest of 103, our team would enter short targeting the mid-way support 102.50 as our initial take-profit zone.
Levels to watch/live orders:
- Buys: Flat (Stop loss: N/A).
- Sells: Watch for price to close below the 103 handle and then look to trade any retest seen thereafter.
USD/CAD:
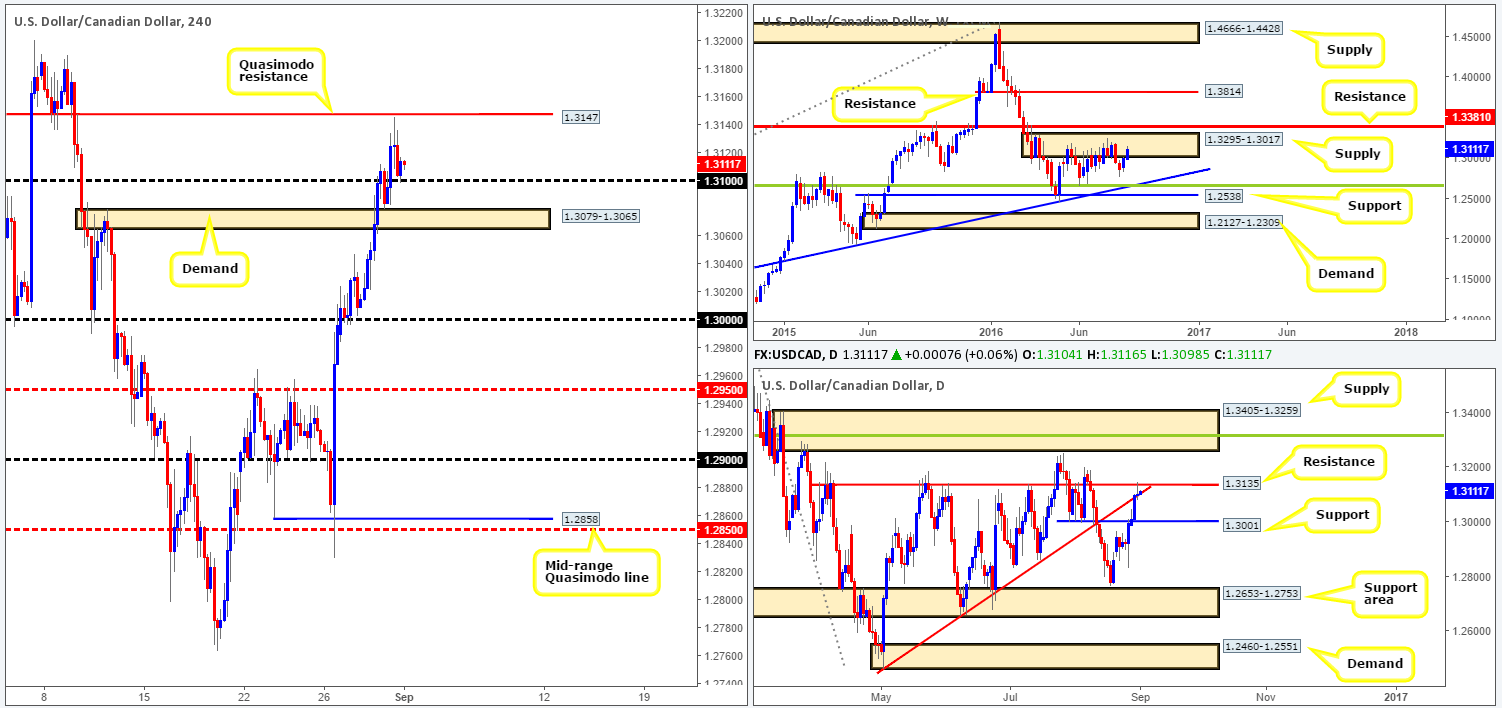
Looking at the weekly chart, the USD/CAD still remains trading within the confines of a supply zone coming in at 1.3295-1.3017, but has yet to really show any bearish intent. Down on the daily chart, however, price crossed swords with a resistance level seen at 1.3135 yesterday, consequently printing a rather interesting selling wick. This – coupled with the loonie coming within touching distance of hitting a H4 Quasimodo resistance level at 1.3147 yesterday (which was a noted level to watch for shorts in our previous report), suggests that the sellers may have the upper hand for the time being.
Despite the higher-timeframe structures (see above), our team will not become sellers in this market until a decisive close has been seen beyond H4 demand at 1.3079-1.3065. A close below this area along with a successful retest would, at least in our book, be sufficient enough to condone a sell down to the key figure 1.30, which also represents a minor daily support level at 1.3001.
Levels to watch/live orders
- Buys: Flat (Stop loss: N/A).
- Sells: Watch for price to close below the H4 demand base at 1.3079-1.3065 and then look to trade any retest seen thereafter.
USD/CHF:
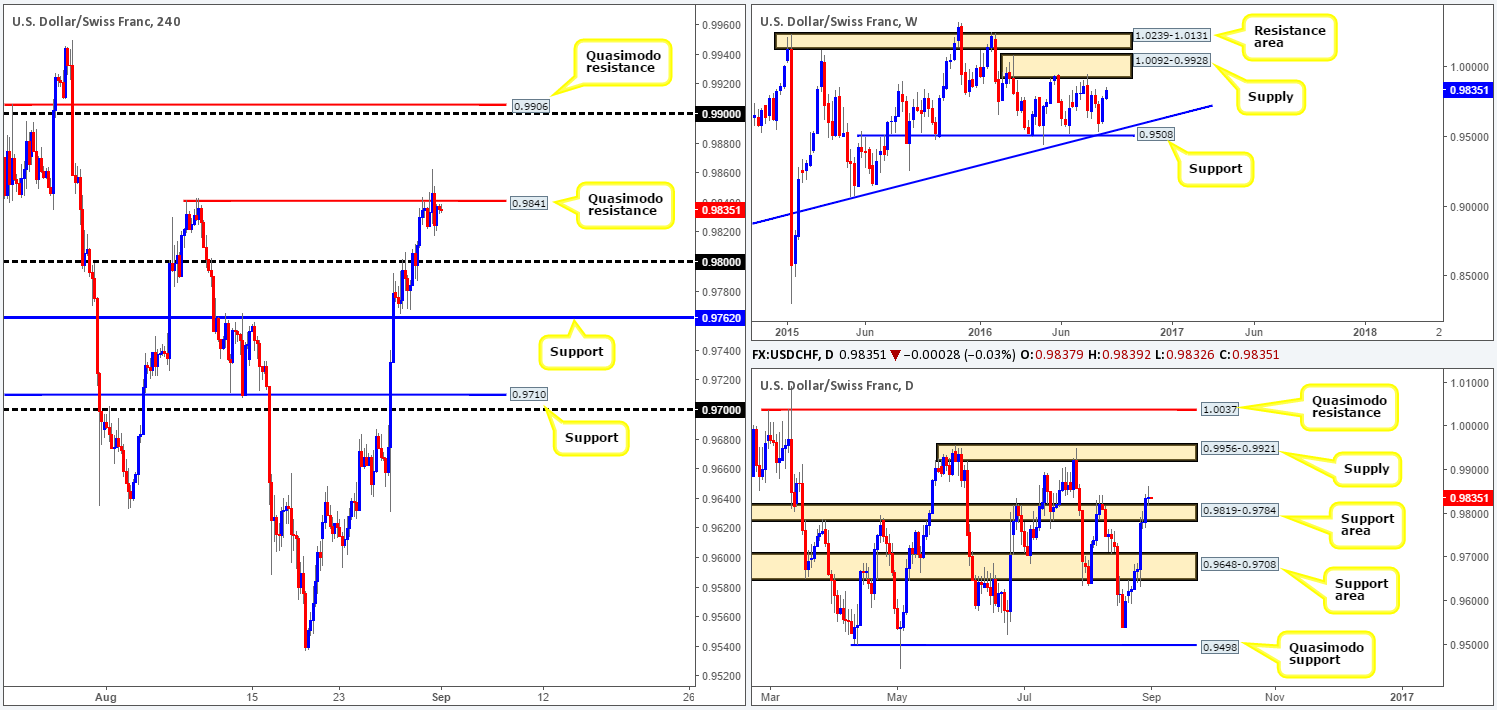
Mid-way through yesterday’s London morning session, the Swissy closed above a H4 Quasimodo resistance level at 0.9841. As you can see, however, price failed to sustain gains beyond this number and dropped to lows of 0.9817, ending the day relatively unchanged.
On the whole, it is likely that this H4 resistance level will be taken out today. Our reasoning lies within the higher-timeframe structures. Check out weekly action. Price shows room to continue advancing north until the unit connects with a supply zone drawn from 1.0092-0.9928. In conjunction with the weekly picture, we can see that price also retested the top edge of a daily support area at 0.9819-0.9784 yesterday, following Tuesday’s close higher.
Our suggestions: On account of the above points, our prime focus today will be on watching for price to decisively close above the current H4 Quasimodo resistance level. Should this come to fruition, and price follows up with a retest and a lower timeframe buy signal (see the top of this report), we would buy this pair targeting the 0.99/0.9906 neighborhood (round number/H4 Quasimodo resistance), which sits directly below a daily supply at 0.9956-0.9921: the next upside target on that timeframe.
Levels to watch/live orders:
- Buys: Watch for price to close above the H4 Quasimodo resistance at 0.9841 and then look to trade any retest seen thereafter (lower timeframe confirmation required).
- Sells: Flat (Stop loss: N/A).
DOW 30:
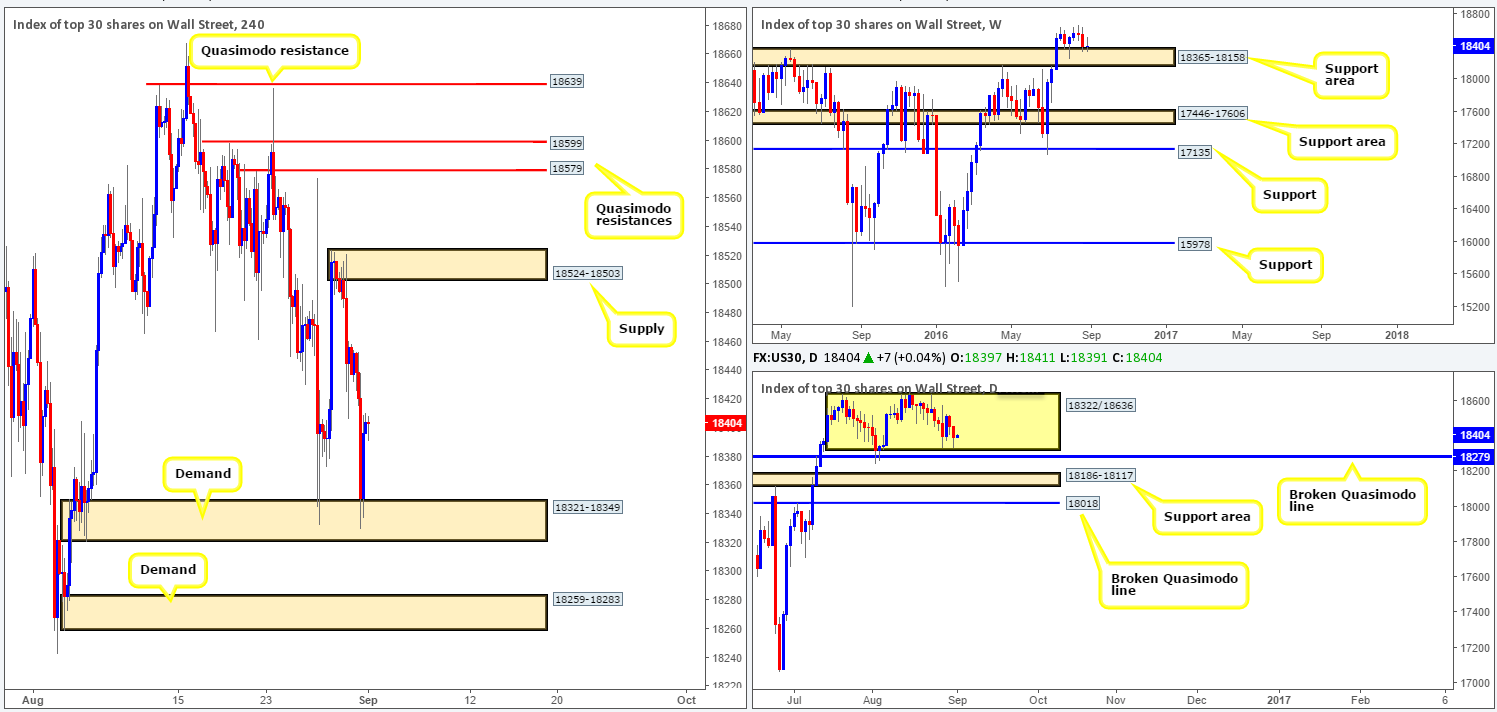
In recent trading, the DOW retested the H4 demand seen at 18321-18349 for a second time this week. So far, bids are holding firm, and given that this H4 demand is connected with the lower edge of a daily range at 18322 and around the top edge of a weekly support area at 18365-18158, further buying could very well be on the cards today. However, today’s US weekly unemployment claims and manufacturing data will likely stir things up, so be sure to remain vigilant around those times. A rise in unemployment claims is generally a bad sign for stocks since consumer spending is strongly correlated with labor conditions.
Our suggestions: In light of the above, here is what we have jotted down going forward:
- Watch for price to retest the H4 demand at 18321-18349. A bounce from here supported by a lower timeframe buy signal is, given the areas relationship with higher-timeframe structures, enough to justify a long trade targeting the H4 supply seen at 18524-18503.
- Should the above H4 demand fail to hold, our attention will then move down to H4 demand seen at 18259-18283. The zone surrounds a nice-looking broken daily Quasimodo line at 18279 and is also seen housed within the aforementioned weekly support area. In that this zone still remains fresh, a long trade from here could be taken at market (if there is no news due to be released), targeting the underside of the H4 supply at 18321-18349 as a first take-profit zone.
Levels to watch/live orders:
- Buys: 18321-18349 [Tentative – confirmation preferred] (Stop loss: dependent on where one confirms this area). 18259-18283 [Tentative – confirmation preferred] (Stop loss: dependent on where one confirms this area).
- Sells: Flat (Stop loss: N/A).
GOLD:
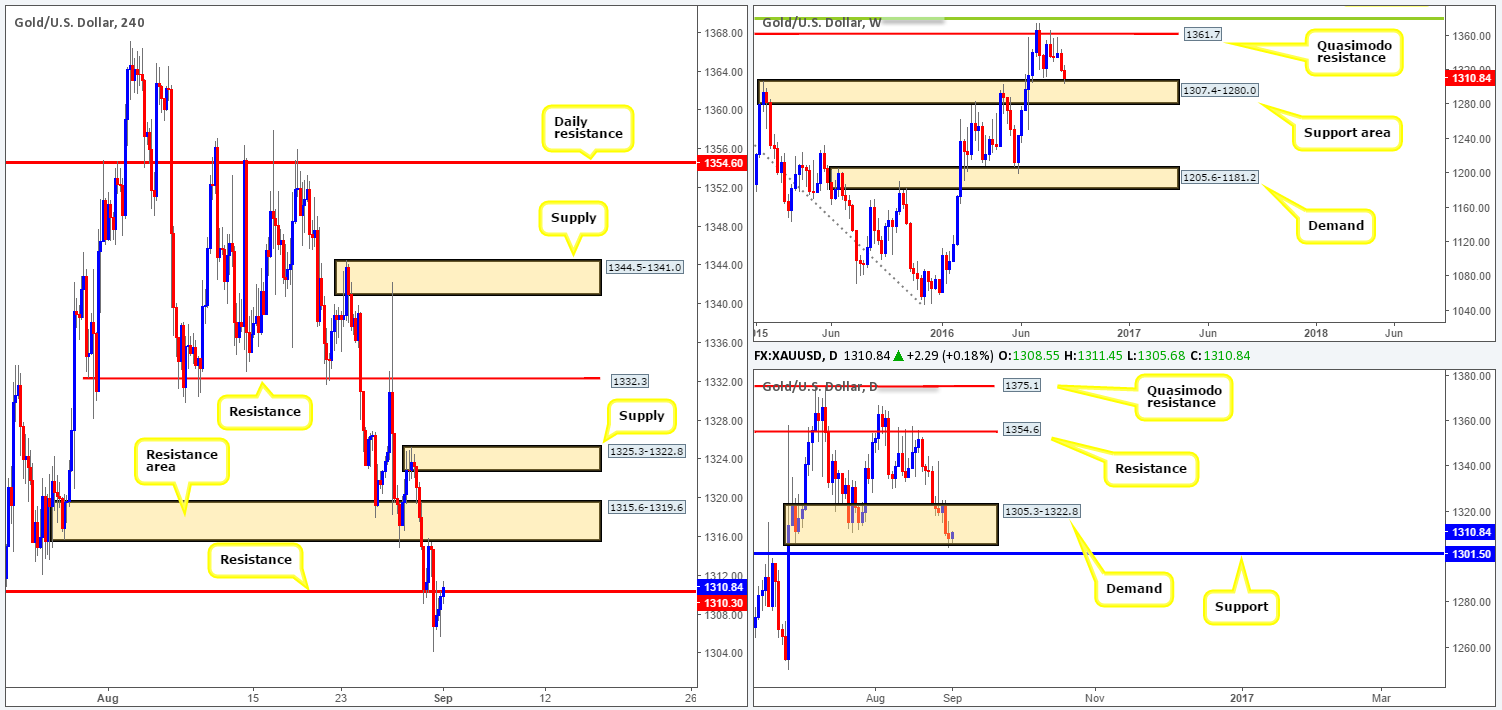
In view of weekly price now seen meandering around the top edge of a support area at 1307.4-1280.0, gold could potentially rebound and recover some of its recent losses here. Down on the daily chart, the yellow metal recently breached demand coming in at 1305.3-1322.8, leaving the support level seen just below it at 1301.5 unchallenged.
With the US dollar index recently topping out just ahead of a H4 supply at 9652-96.38, this appears to be pressuring the price of gold higher right now, forcing the unit to connect with a H4 resistance line at 1310.3. Seeing as how both the weekly and daily charts indicate that this market may advance (see above), we remain wary of the current H4 resistance line and believe it will likely be breached today.
Our suggestions: Should a decisive close above the current H4 resistance take shape, one could look to trade any retest seen to the top edge of this level (preferably with a lower timeframe buy signal), targeting the H4 resistance area at 1315.6-1319.6, followed by a fresh H4 supply at 1325.3-1322.8 and then quite possibly the H4 resistance 1332.3.
Levels to watch/live orders:
- Buys: Watch for price to close above the H4 resistance at 1310.3 and then look to trade any retest seen thereafter (lower timeframe confirmation required).
- Sells: Flat (Stop loss: N/A).


