
EUR/USD:
The US Federal Reserve kept interest rates unchanged on Wednesday, as expected. The Fed, which hiked interest rates three times last year, mentioned the economy warranted ‘further gradual’ increases in rates. The target range for the federal funds rate currently is 1.25%-1.50%.
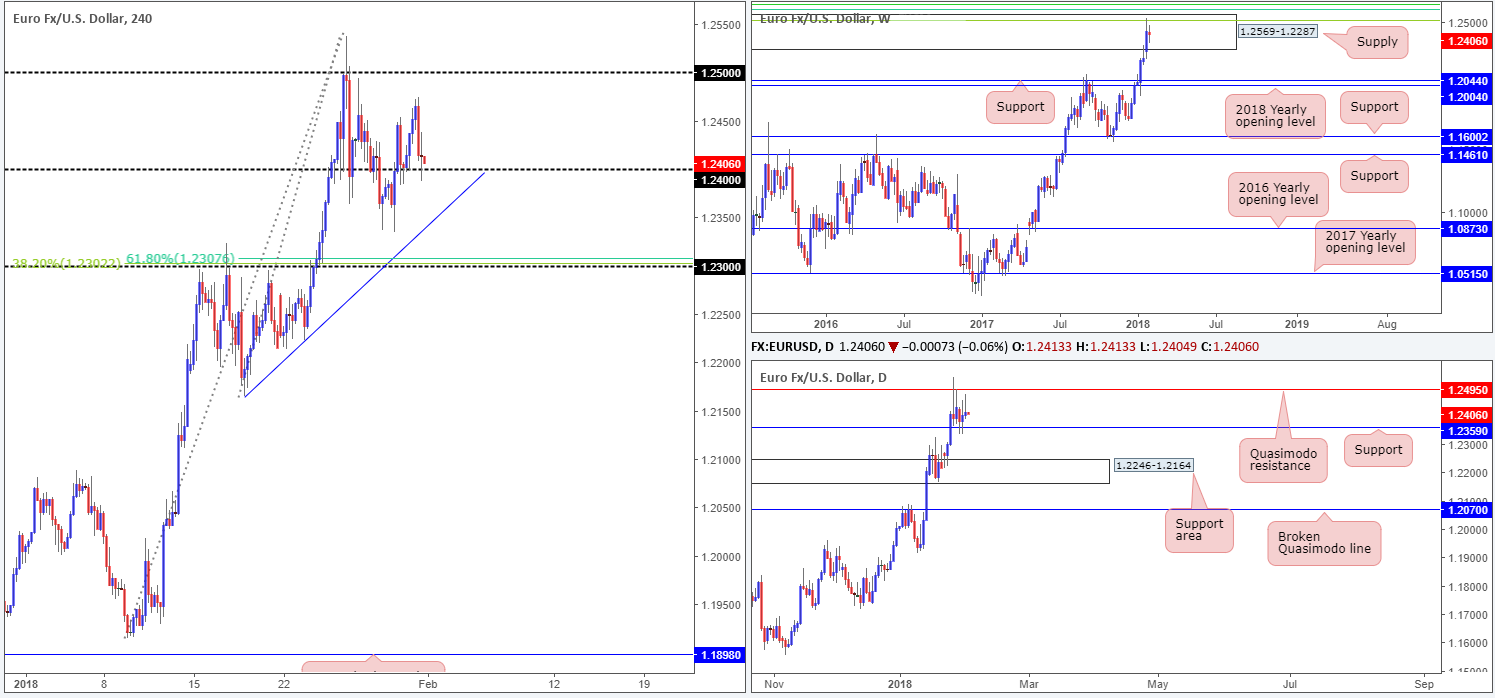
The impact of the Fed’s decision/statement was somewhat muted on the charts. The euro is seen hovering a few pips ahead of the 1.24 handle seen on the H4 timeframe after fading session highs of 1.2474, and the US dollar index continues to cling to 89.00.
Weekly movement remains confined within the walls of a weekly supply zone printed at 1.2569-1.2287. This zone also highlights a weekly Fibonacci cluster (green lines):
- 61.8% Fib resistance at 1.2604 taken from the high 1.3993.
- 50.0% Fib resistance at 1.2644 taken from the high 1.4940.
- 38.2% Fib resistance at 1.2519 taken from the high 1.6038.
Daily flow, on the other hand, is seen encased between a daily Quasimodo resistance level at 1.2495 and a daily support level coming in at 1.2359. Should weekly sellers push the unit lower, the next downside target seen beyond 1.2359 is a support area formed at 1.2246-1.2164.
Market direction:
To confirm bearish intent from the aforementioned weekly supply, a daily close beneath the current daily support level is vital, in our opinion. This would likely see the H4 candles engulf a H4 trendline support extended from the low 1.2165, and open up the possibility for an approach down to the 1.23 handle (seen nearby is a H4 Fib cluster comprised of a 61.8% Fib support at 1.2307 and a 38.2% Fib support at 1.2302).
On account of the above, intraday shorts could be an option beneath the H4 trendline, targeting 1.23 as an initial take-profit zone.
Data points to consider: US unemployment claims at 1.30pm; US ISM manufacturing PMI at 3pm GMT.
Areas worthy of attention:
Supports: 1.24 handle; 1.2307; 1.2302; 1.23 handle; H4 trendline support; 1.2359; 1.2246-1.2164.
Resistances: 1.2569-1.2287; Weekly Fib cluster; 1.2495.
GBP/USD:
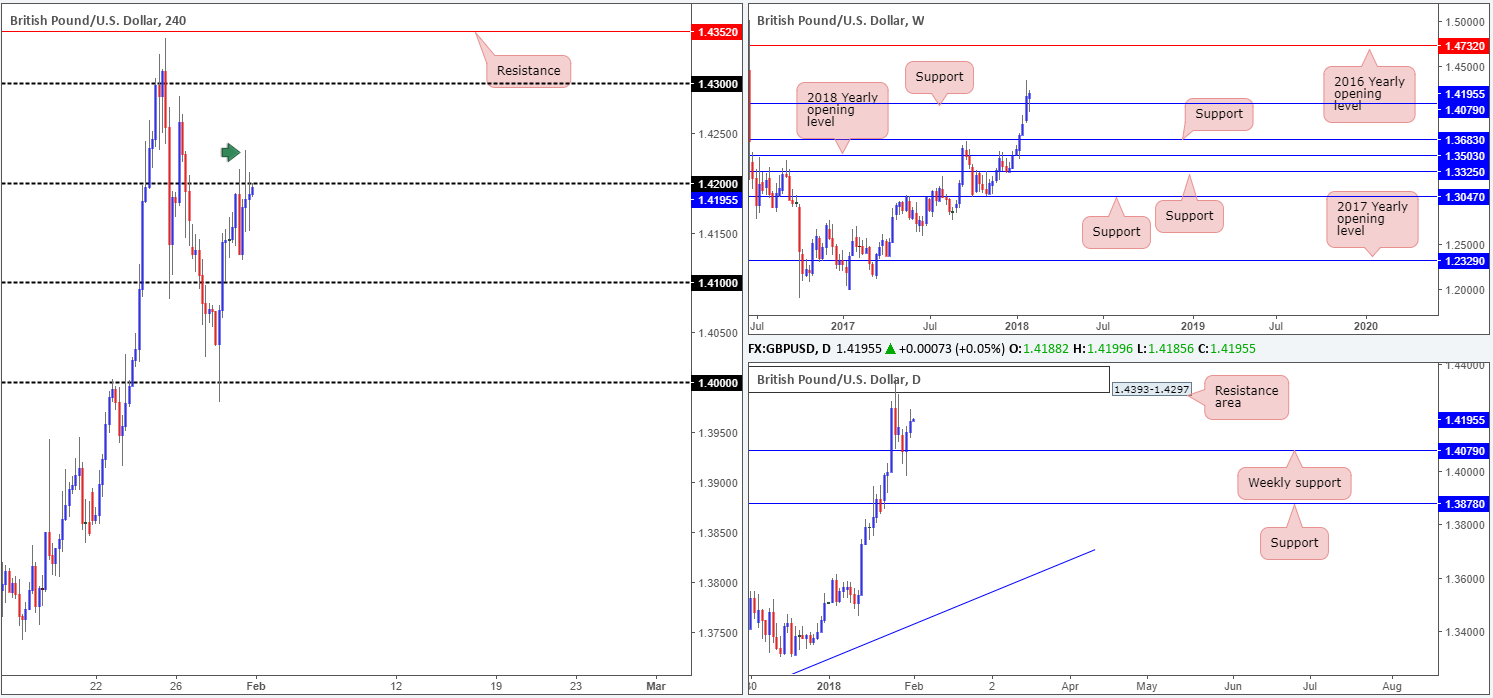
The British pound, as you can see on the H4 timeframe, spent Wednesday’s sessions consolidating beneath the 1.42 handle. As projected, the US Federal Reserve kept interest rates unchanged which failed to generate much movement.
Meanwhile, weekly price continues to reflect a bullish stance above weekly support at 1.4079. Continued bidding from this neighborhood is a reasonable possibility, since there’s little resistance in view until we arrive at 1.4732: the 2016 yearly opening level.
Tuesday’s daily bullish engulfing candle formed off the noted weekly support level prompted further upside on Wednesday, consequently placing the pair within close distance of a daily resistance area fixed at 1.4393-1.4297.
Market direction:
With stop-loss orders above 1.42 now likely filled (high marked by the green arrow at 1.4233), the runway beyond is likely free. Above this number we do not see much in the way of resistance until we reach the 1.43 handle, which is housed within the lower limits of the daily resistance area mentioned above at 1.4393-1.4297.
Therefore, keeping it Simple Simon today, watch for H4 price to CLOSE above 1.42 and retest the number as support. Should it hold, and print a reasonably strong supporting H4 candle, the odds of cable reaching for higher prices are strong, in our technical opinion.
Data points to consider: UK manufacturing PMI at 9.30am; US unemployment claims at 1.30pm; US ISM manufacturing PMI at 3pm GMT.
Areas worthy of attention:
Supports: 1.4079.
Resistances: 1.4393-1.4297; 1.4732; 1.42/3 handle.
AUD/USD:
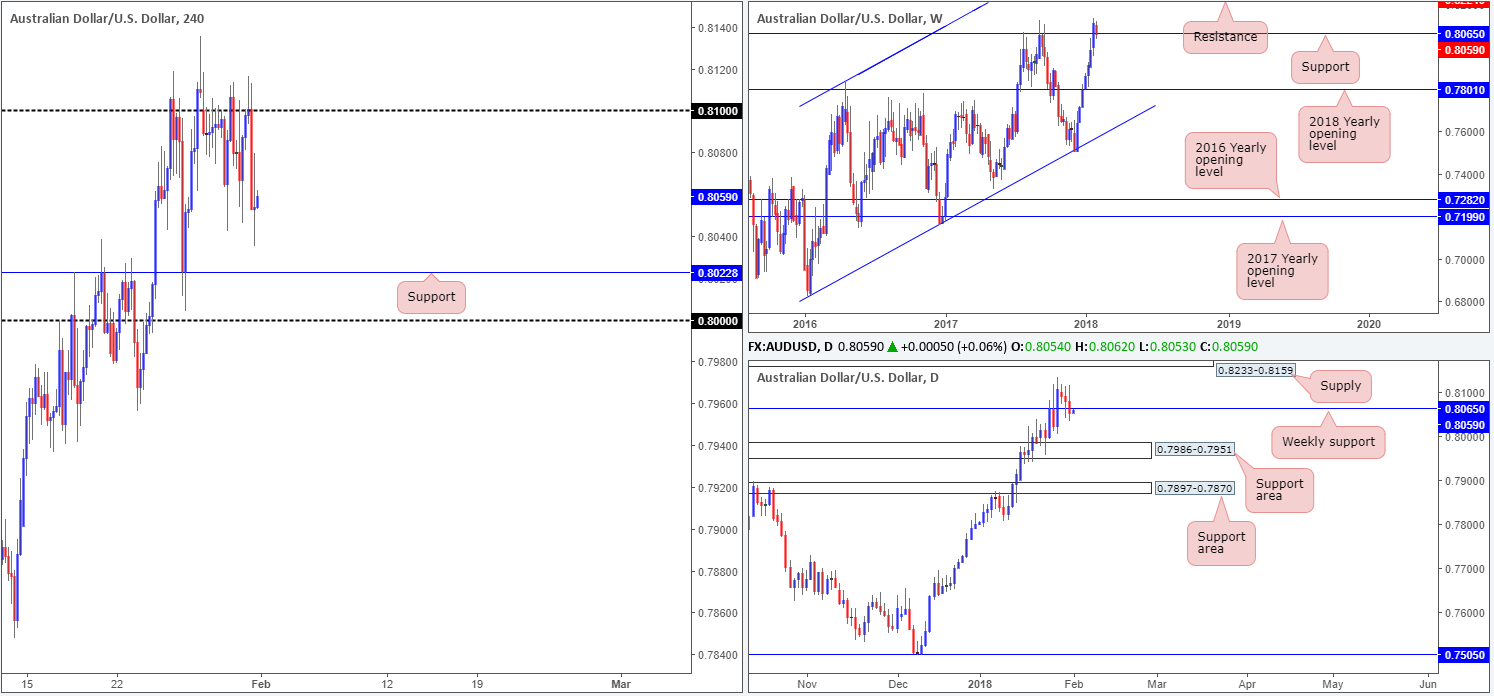
Despite numerous attempts to breach the 0.81 handle on the H4 timeframe, the buyers just couldn’t pull it off! Wednesday’s session concluded following a somewhat dominant selloff to lows of 0.8035, placing the H4 support at 0.8022, followed closely by the 0.80 handle, in view.
What’s also interesting about yesterday’s descent is that daily price closed beneath weekly support at 0.8065. Although this is only a marginal close, it could potentially prompt further selling down to a daily support area positioned at 0.7986-0.7951 (located a few pips beneath the 0.80 band).
Market direction:
0.80 is likely a watched number in this market – even more so considering that it has the backing of a daily support area at 0.7986-0.7951. The question is though; would a long from 0.80 be valid considering the break of weekly support? Personally, we think a ‘bounce’ trade is certainly reasonable. What we mean by this is look to catch a bounce, and protect the trade accordingly. Should the trade show promise, you then have the option to take some profit off the table and leave the remainder to run with stops positioned at breakeven, targeting 0.81.
Data points to consider: AUD building approvals m/m at 12.30am; CNY caixin manufacturing PMI at 1.45am; US unemployment claims at 1.30pm; US ISM manufacturing PMI at 3pm GMT.
Areas worthy of attention:
Supports: 0.8022; 0.80 handle; 0.7986-0.7951.
Resistances: 0.8065 (potential); 0.81 handle.
USD/JPY:
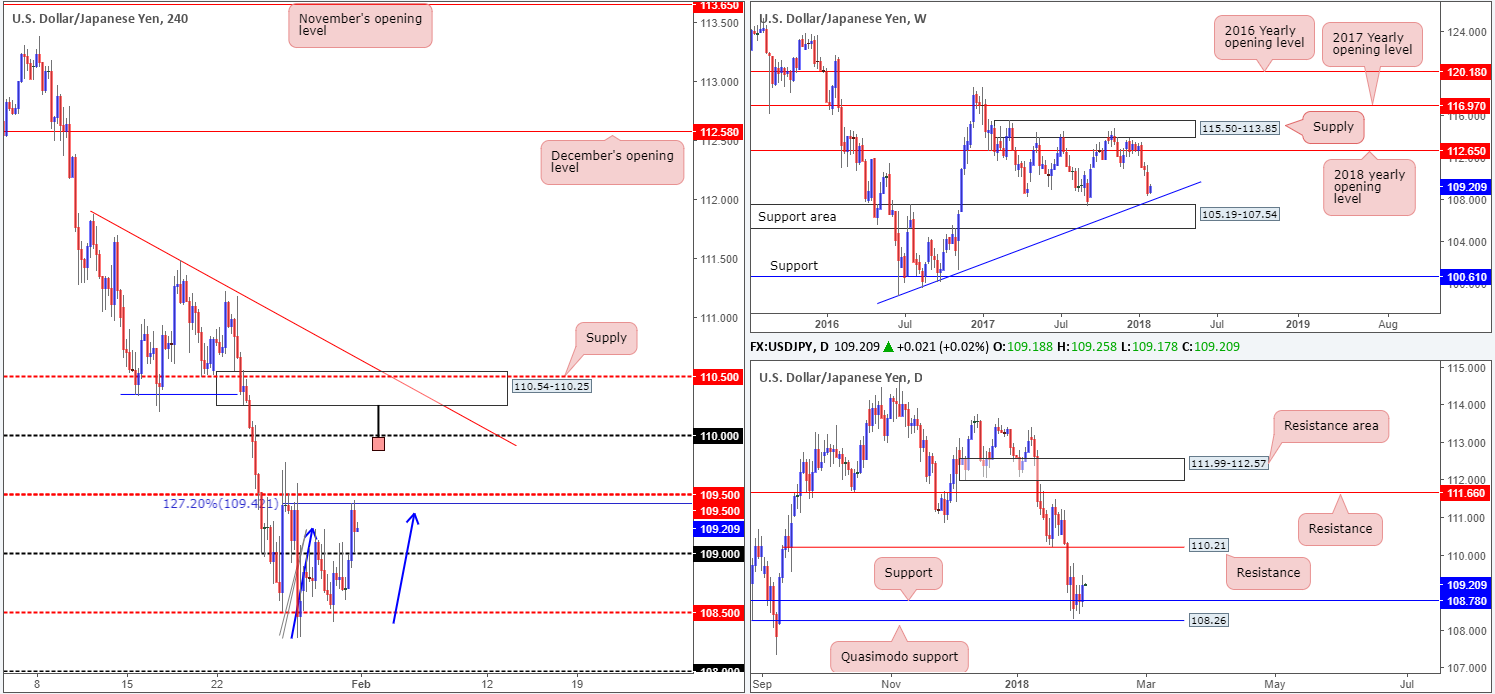
USD/JPY bulls went on the offensive amid Wednesday’s segment, swallowing the 109 handle and reaching highs of 109.44. This recent bout of buying also completed the D-leg to a H4 AB=CD (see blue arrows) 127.2% Fib ext. point at 109.42, located just ahead of the H4 mid-level resistance at 109.50. While selling has already been seen from this angle, it failed to overcome 109, which is now an acting support.
Turning the focus over to the daily timeframe, daily resistance at 108.78 was engulfed during yesterday’s movement in reasonably strong fashion. By and of itself, this could spark another round of buying, since upside is relatively free until we shake hands with daily resistance printed at 110.21.
Weekly action, on the other hand, shows us that the USD/JPY still has some wiggle room to probe as low as a weekly trendline support taken from the low 98.78, followed closely by a weekly support area at 105.19-107.54.
Market direction:
As of current prices, buying is not something we would label high probability. In fact, even with a H4 close above 109.50, we would still not consider buying to be valid, given the threat of additional selling on the weekly timeframe at the moment.
An area we do have an eyeball on, however, is the H4 supply zone coming in at 110.54-110.25, as it is positioned nearby the aforesaid daily resistance and merges with a H4 mid-level resistance at 110.50, as well as a H4 trendline resistance taken from the high 111.87.
An ideal sell signal, in our view, would be a H4 selling wick that penetrates through 110 and connects with the underside of the above noted H4 supply (see H4 chart). That way stop-loss orders above 110 would be filled and therefore provide liquidity to those wishing to sell from the H4 supply. One could look jump aboard following the close of the candle, with stops either placed above the candle’s wick or above the H4 supply itself. The first target objective from here can be set at 109.50.
Data points to consider: US unemployment claims at 1.30pm; US ISM manufacturing PMI at 3pm GMT.
Areas worthy of attention:
Supports: 109 handle; 108.78; Weekly trendline support; 105.19-107.54.
Resistances: 109.50; 109.42; 110 handle; 110.54-110.25; 110.50; H4 trendline resistance; 110.21.
USD/CAD:
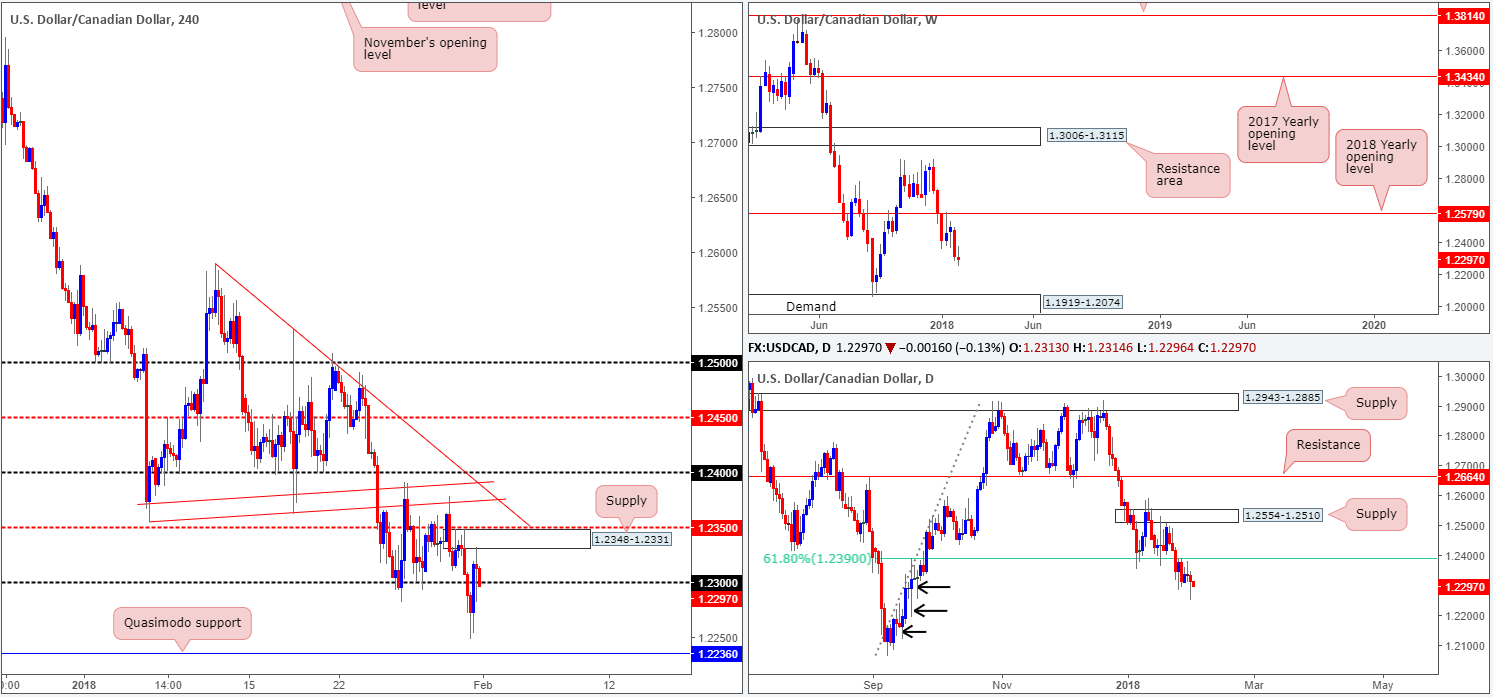
During the course of Wednesday’s sessions, the USD/CAD put in a bottom at 1.2248 and rose back above the 1.23 handle into the close. Traders may have also noticed that the break lower highlighted a H4 Quasimodo support located at 1.2236.
While H4 buyers and sellers battle for position around 1.23, the higher-timeframe picture remains in a bearish position, according to our technicals.
After spending two weeks consolidating below the 2018 yearly opening level on the weekly timeframe at 1.2579, the sellers finally cranked it up a gear and moved lower last week. With little weekly support in sight until we reach the weekly demand base at 1.1919-1.2074, further selling in the coming weeks is a real possibility.
Daily price, as you can see, remains below 1.2390: a daily 61.8% Fib support-turned resistance. Below 1.2390 there’s little support worthy of mention, in our opinion. Note the clear daily buying tails marked with black arrows at 1.2253, 1.2194 and 1.2118. These, to us, resemble consumption of unfilled buy orders.
Market direction:
To the upside, near-term movement is somewhat restricted given the H4 supply at 1.2348-1.2331.
Should 1.23 fail to hold ground today, we could possibly see the aforementioned H4 Quasimodo support brought into the fray.
Our bias, at least medium/long term, remains short. This is largely because of where price is located on the bigger picture. A H4 close beneath 1.23 would, in our view, further confirm this bearish bias and open up the possibility for a short trade. However, we would not label a breakout as a high-probability setup as they have a tendency to recoil. Instead, consider waiting for a H4 close to form back below 1.23 and look to then trade any (successful) retest of this number thereafte, targeting the noted H4 Quasimodo support as an initial take-profit zone.
Data points to consider: US unemployment claims at 1.30pm; US ISM manufacturing PMI at 3pm GMT.
Areas worthy of attention:
Supports: 1.23 handle; 1.2236; 1.1919-1.2074.
Resistances: 1.2348-1.2331; 1.2390.
USD/CHF:
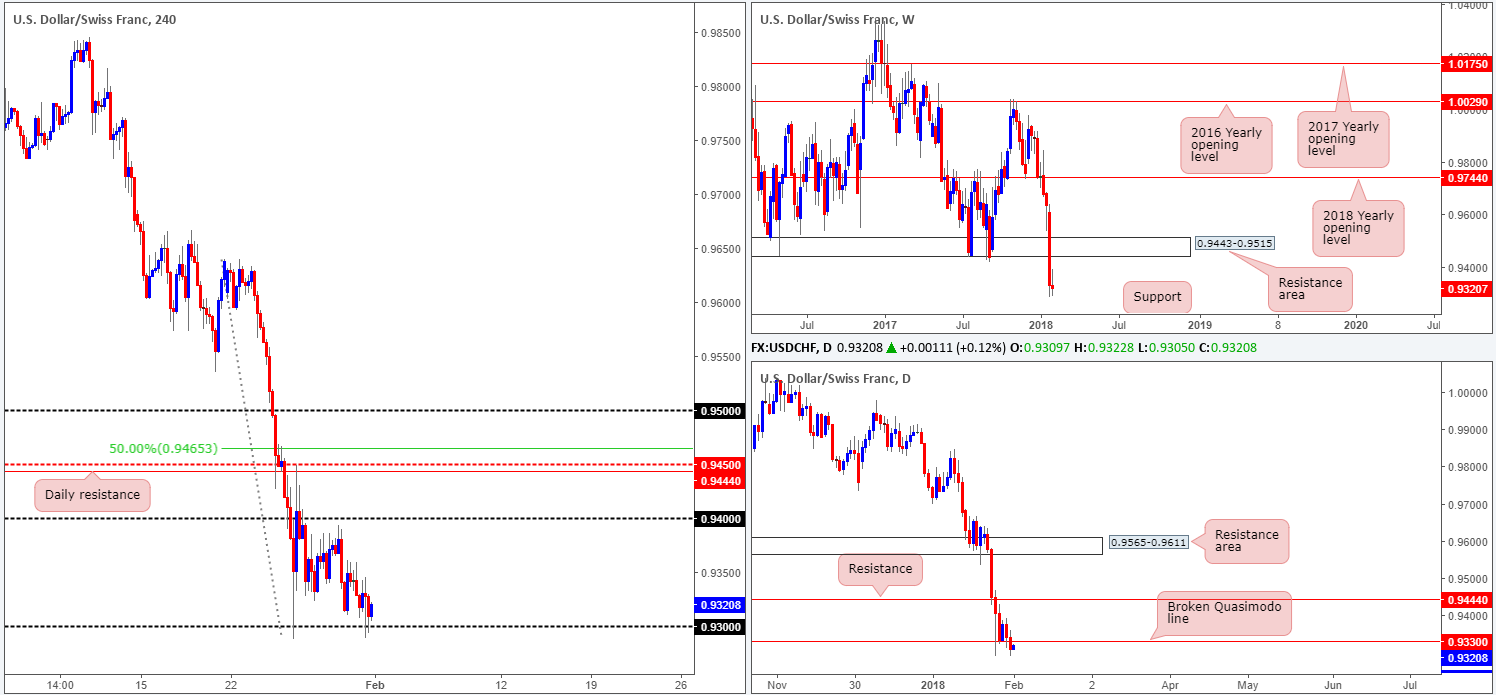
After cranking its way through a weekly support area at 0.9443-0.9515 last week (now acting resistance zone), the path south appears relatively free as far down as the weekly support level coming in at 0.9163. Sliding down to the daily structure, we can see that yesterday’s bout of selling helped daily price cross below a daily Quasimodo support at 0.9330 (also now acting resistance). This has potentially opened up the river south down to a daily Quasimodo support level at 0.9233.
Across on the H4 timeframe, however, the 0.93 handle is currently seen offering support to the market. Before traders look to short based on the higher-timeframe picture, it might be a good idea to wait for this psychological band to be engulfed. With 0.93 out of the picture, we see very little stopping the unit from stretching down to tap in the aforementioned daily Quasimodo support.
Market direction:
Overall, we’re biased to the downside in this market, which is a little odd since we’re also biased to the downside on the EUR/USD, too!
In the event that a H4 close is seen beyond 0.93, watch for the unit to retest this number as resistance and hold firm. A solid bearish rejection from this number would, in our view, be enough evidence to confirm further selling down to at least the noted daily Quasimodo support, and maybe even the weekly support printed at 0.9163.
One final point, however, do remain aware that over on the US dollar index, there is a major monthly support in play from 88.50.
Data points to consider: US unemployment claims at 1.30pm; US ISM manufacturing PMI at 3pm GMT.
Areas worthy of attention:
Supports: 0.93 handle; 0.9233; 0.9163.
Resistances: 0.9330; 0.9443-0.9515.
DOW 30:
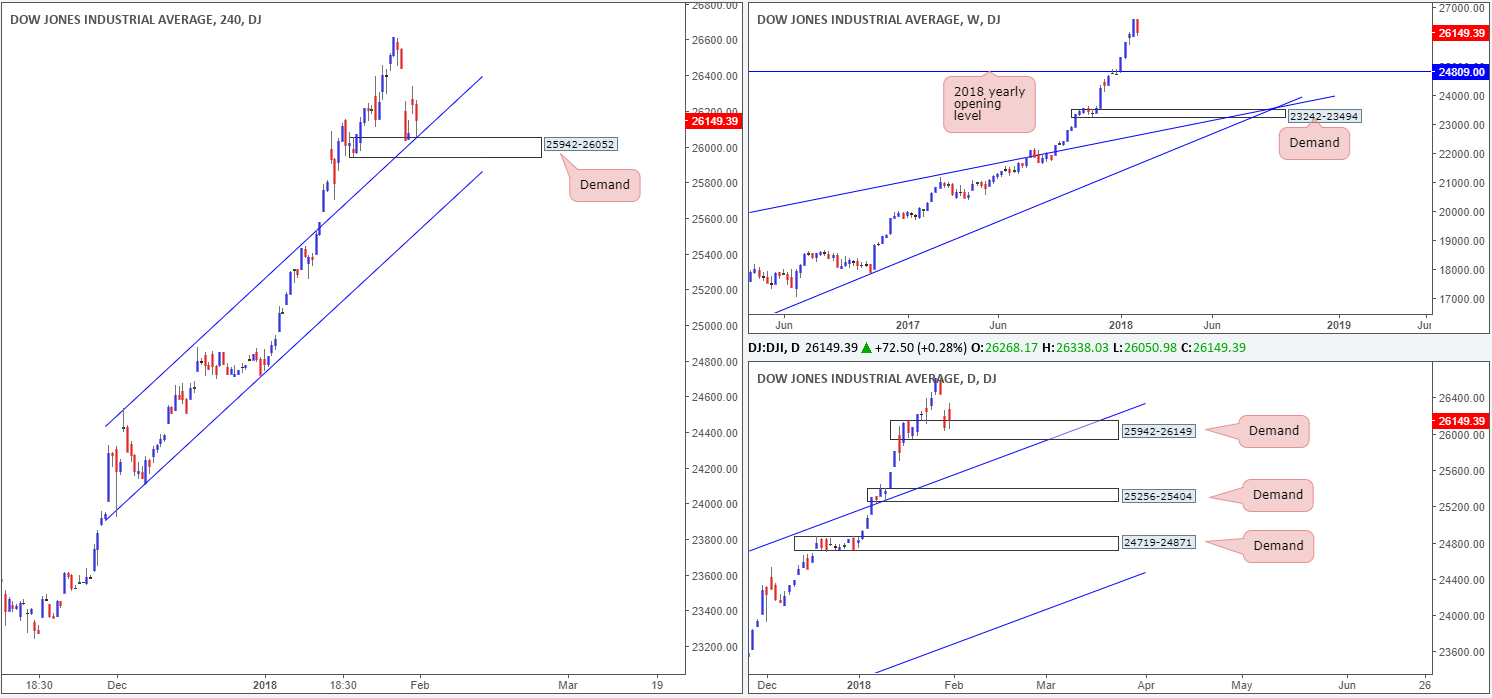
Although the DJIA is currently in retreat mode, the month, once again, ended in gains.
H4 demand at 25942-26052, along with its converging H4 channel resistance-turned support taken from the high 24535, remains in view. Also worth remembering here is that these H4 barriers are seen positioned within the lower limits of daily demand at 25942-26149. While H4 bulls have yet to register anything noteworthy from this area yet, we believe it is only a matter of time until we see the buyers make an appearance.
Market direction:
Given the current position of price, a rotation to the upside is still very likely to take place today. Stop-loss orders would be best positioned beneath the current H4 demand area. Ultimately, a healthy bid from current price would fill Tuesday’s gap and possibly push on to fresh record highs.
Data points to consider: US unemployment claims at 1.30pm; US ISM manufacturing PMI at 3pm GMT.
Areas worthy of attention:
Supports: 25942-26052; H4 channel support; 25942-26149.
Resistances: …
GOLD:
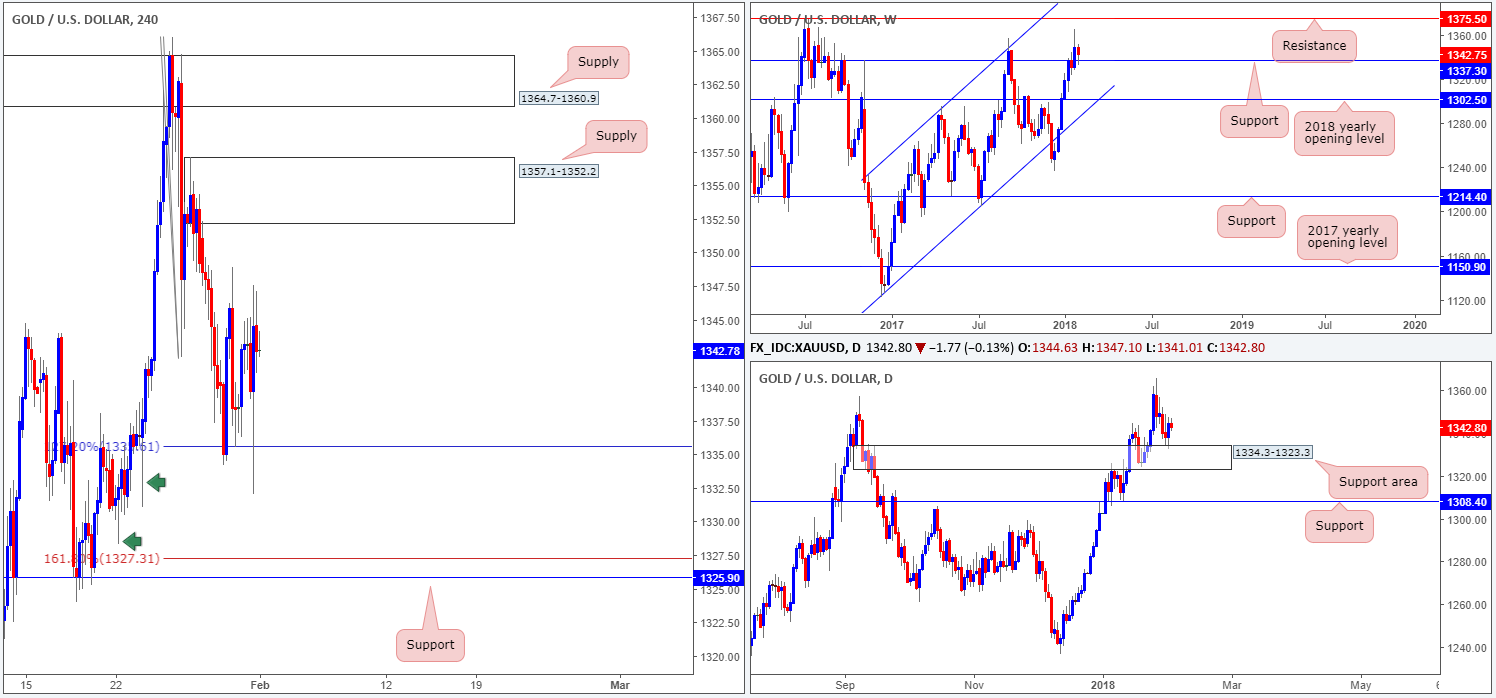
As can clearly be seen from the H4 timeframe this morning, the 127.2% H4 Fib ext. point at 1335.6 remained in the fight on Wednesday, bouncing prices north for a third time this week. While this level has the backing of a weekly support level at 1337.3 and a daily support area coming in at 1334.3-1323.3, H4 price has been unable to conquer 1345.8.
Should buyers crank things up a gear, however, the next port of call beyond 1345.8 is not seen too far off at 1357.1-1352.2: a H4 supply area, which is also shadowed closely by another H4 supply zone coming in at 1364.7-1360.9. Therefore, in view of how close H4 resistances are at the moment, buying is not a method we’d label as high probability.
Market direction:
H4 price will likely end the week contained between the H4 Fib ext. point at 1335.6 and H4 supply base coming in at 1357.1-1352.2. As of current prices, we do not see much on offer as far as technical setups go. Well, none that provides sufficient confluence, that is.
Areas worthy of attention:
Supports: 1335.6; 1337.3; 1334.3-1323.3.
Resistances: 1357.1-1352.2; 1364.7-1360.9.
This site has been designed for informational and educational purposes only and does not constitute an offer to sell nor a solicitation of an offer to buy any products which may be referenced upon the site. The services and information provided through this site are for personal, non-commercial, educational use and display. IC Markets does not provide personal trading advice through this site and does not represent that the products or services discussed are suitable for any trader. Traders are advised not to rely on any information contained in the site in the process of making a fully informed decision.
This site may include market analysis. All ideas, opinions, and/or forecasts, expressed or implied herein, information, charts or examples contained in the lessons, are for informational and educational purposes only and should not be construed as a recommendation to invest, trade, and/or speculate in the markets. Any trades, and/or speculations made in light of the ideas, opinions, and/or forecasts, expressed or implied herein, are committed at your own risk, financial or otherwise.
The use of the site is agreement that the site is for informational and educational purposes only and does not constitute advice in any form in the furtherance of any trade or trading decisions.
The accuracy, completeness and timeliness of the information contained on this site cannot be guaranteed. IC Markets does not warranty, guarantee or make any representations, or assume any liability with regard to financial results based on the use of the information in the site.
News, views, opinions, recommendations and other information obtained from sources outside of www.icmarkets.com.au, used in this site are believed to be reliable, but we cannot guarantee their accuracy or completeness. All such information is subject to change at any time without notice. IC Markets assumes no responsibility for the content of any linked site. The fact that such links may exist does not indicate approval or endorsement of any material contained on any linked site.
IC Markets is not liable for any harm caused by the transmission, through accessing the services or information on this site, of a computer virus, or other computer code or programming device that might be used to access, delete, damage, disable, disrupt or otherwise impede in any manner, the operation of the site or of any user’s software, hardware, data or property.


