EUR/USD:
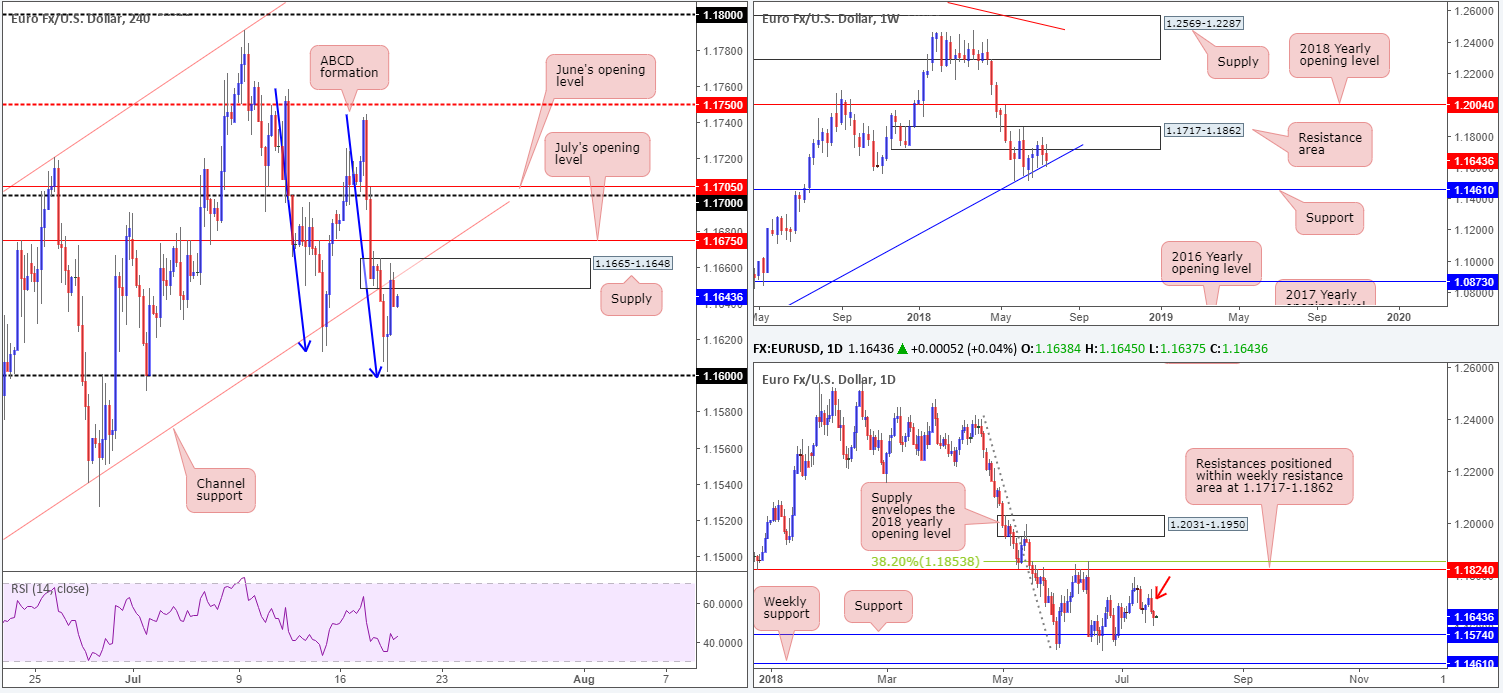
As anticipated, the single currency broke through H4 channel support (extended from the low 1.1508) and came within touching distance of the 1.16 handle on Wednesday. The move, as far as we can see, was largely in sympathy with the GBP’s recent decline. Unable to sustain downside momentum ahead of 1.16 (1.1602 to be exact), which was supported by a H4 ABCD bullish formation (taken from the high 1.1758 – blue arrows), the euro began paring losses on disappointing US housing data (DXY topped at 95.41) and concluded the day retesting the underside of the recently broken channel support as resistance (along with newly formed H4 supply at 1.1665-1.1648).
Weekly movement is now seen touching gloves with trend line support (etched from the low 1.0340). The pair has been tightly confined between this trend line support and a nearby resistance area at 1.1717-1.1862 since late May. On the other side of the spectrum, though, daily flows still show room to press as far south as support coming in at 1.1574, after extending Tuesday’s clear-cut bearish engulfing candle (see red arrow).
Areas of consideration:
Neither a long nor short seems attractive at the moment.
Shorting from the current H4 supply/H4 channel support-turned resistance would have you selling into potential weekly buying. What’s more, July’s opening level (hovering above these H4 zones) at 1.1675 has ‘fakeout to me’ written all over it. For that reason, shorting this market is precarious.
Buying, on the other hand, is favored on the weekly chart, but troublesome on both H4 and daily timeframes.
Today’s data points: US Philly Fed manufacturing index; US unemployment claims; FOMC member Quarles speaks.
GBP/USD:
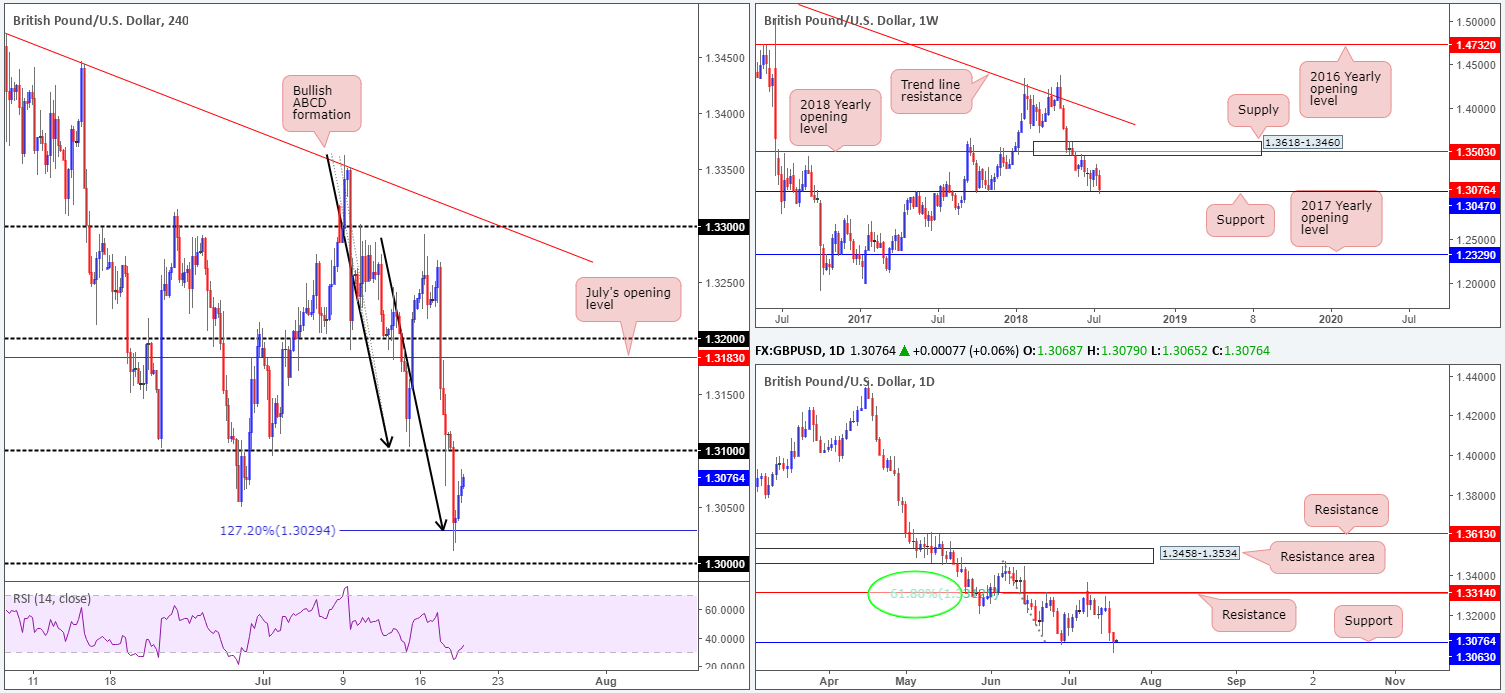
Lower-than-expected UK inflation, along with USD strength seen across the board, guided the GBP/USD southbound amid Wednesday’s movement. Conquering the 1.31 handle in strong fashion, the pair fell sharply to lows of 1.3010 in one fell (H4) swoop. The move brought both weekly support at 1.3047 and daily support at 1.3063 into the fray. Further to this, a H4 ABCD bullish formation (black arrows) completed at the 127.2% Fib ext. point drawn from 1.3029. As you can see, these supports (along with a USD decline based on less-than-stellar US housing data [DXY topped at 95.41]) held price action higher, allowing the unit to pare a portion of the day’s losses into the close.
Areas of consideration:
H4 candles appear poised to reconnect with the underside of 1.31. The question is, would this number be a suitable platform for shorts? Technically speaking, a bounce lower from 1.31 is possible. Yet, the odds of a break higher is more likely, given where we’re coming from on the bigger picture (see above).
On account of the above, keep eyes out for a H4 close back above 1.31. This – coupled with a retest in the shape of a full or near-full-bodied H4 bull candle – would likely be enough to consider longs, targeting July’s opening level on the H4 timeframe at 1.3183, followed closely by the 1.32 handle.
Today’s data points: UK retail sales m/m; US Philly Fed manufacturing index; US unemployment claims; FOMC member Quarles speaks.
AUD/USD:
Recovering sharply from lows of 0.7343 on Wednesday as the market abandoned the USD, the H4 candles ended the day settling just beneath the 0.74 handle. Broader markets lost their flavor for the greenback following lower-than-expected US housing data. Also worthy of note on the H4 scale is nearby resistance in the form of July’s opening line at 0.7411, along with trend line resistance (taken from the high 0.7483).
Bids/offers appear even at the moment on the weekly timeframe, as the market continues to engage with a somewhat fragile demand area at 0.7371-0.7442. Continued indecisiveness here could open the window to a possible test of the 2016 yearly opening level at 0.7282 sometime down the road. In the event that the bulls regain consciousness, however, a retest of supply at 0.7812-0.7669 may be on the cards. Support at 0.7314, alongside its closely associated channel support taken from the low 0.7758, remains a focal point on the daily timeframe, as does the resistance level seen overhead at 0.7479. Both levels carry equal weight, in our opinion.
Areas of consideration:
Despite the recent advance, the 0.74 handle, as well as its nearby resistances mentioned above, stand a good chance of holding ground today (we also like the fact that H4 price printed a lower low yesterday, breaking key H4 support at 0.7361 [marked with black arrows]). We say this because direction on the weekly timeframe is, well, let’s just say it is undecided for the time being, and daily price shows room to press as far south as support coming in at 0.7314.
However, before one contemplates shorts from the 0.74 neighborhood (downside targets form here sit at yesterday’s low of 0.7343, followed by H4 Quasimodo support at 0.7323), Aussie traders will be looking closely at the Australian job’s report due in less than two hours as of writing. As with all high-impacting events, technical setups tend to take a back seat. Just bear this in mind, traders.
Today’s data points: Australian job’s data; US Philly Fed manufacturing index; US unemployment claims; FOMC member Quarles speaks.
USD/JPY:
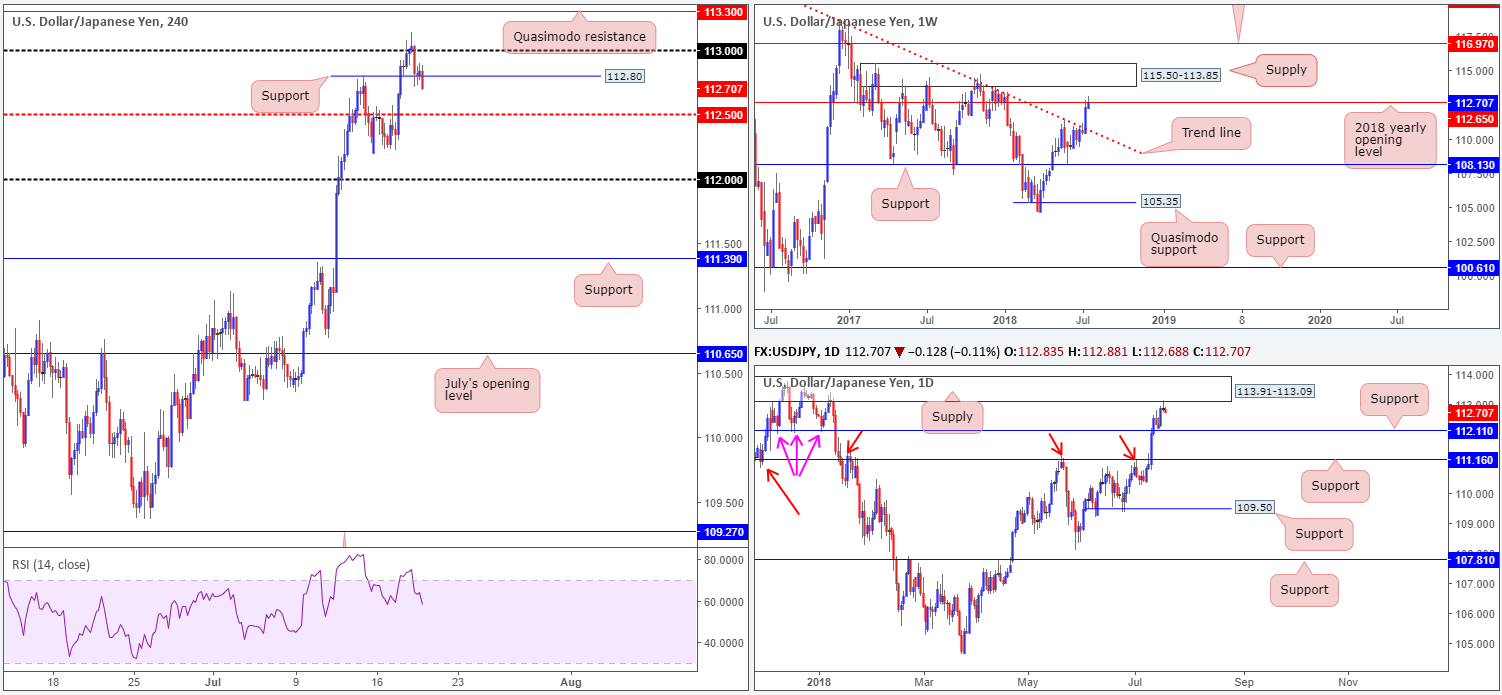
In the shape of a H4 bearish pin-bar candle formation, the pair topped at highs of 113.13 in early Europe on Wednesday. In one fell (H4) swoop, price edged beneath the nearby 113 handle to lows of 112.70, exacerbated by lower-than-expected US housing figures.
H4 local support at 112.80 (July 13 high) is, as you can see, struggling to embrace price action. A move beyond this level has the H4 mid-level support at 112.50 to target. Interestingly, buyer weakness here could be due the fact we connected with the underside of a daily supply area at 113.91-113.09 yesterday and formed a nice-looking daily bearish pin-bar candle formation. On this scale, the next downside support comes in at 112.11 (note how this level held price higher in December 2017 and early January 2018 – pink arrows). On top of the daily supply, we can also see weekly action respecting the 2018 yearly opening base at 112.65.
Areas of consideration:
In light of recently shaking hands with daily supply and weekly resistance, this market certainly has a bearish vibe to it this morning.
Longer-term traders may be looking to short the daily bearish pin-bar candle formation, targeting daily support mentioned above at 112.11 as their initial take-profit zone.
Intraday (H4 and lower), it’s a difficult short given how close we are to testing the H4 mid-level support at 112.50. By all means, if a H4 close beneath 112.50 comes to life that’s followed up with a retest as resistance, intraday shorts down to at least the 112 handle (daily support at 112.11 is unlikely to hold to the pip) are possible.
Today’s data points: US Philly Fed manufacturing index; US unemployment claims; FOMC member Quarles speaks.
USD/CAD:
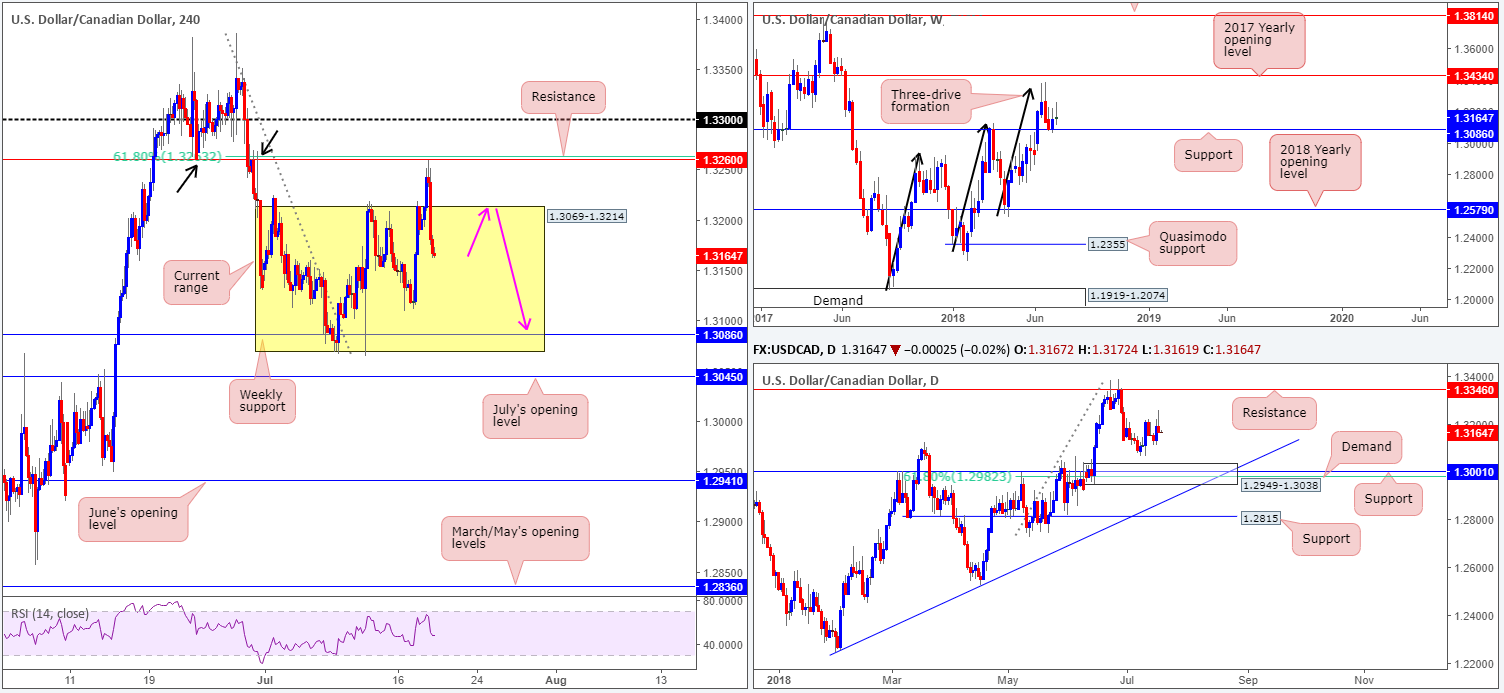
Recent trade witnessed the USD advance against its Canadian counterpart, breaching the top edge of the H4 range at 1.3214. Reinforced by a rally in crude oil prices, though, H4 action swiftly topped at H4 resistance drawn from 1.3260, which happens to merge nicely with a 61.8% H4 Fib resistance value at 1.3263. The move from here, as you can see, has so far been incredibly dominant, consequently pulling H4 price back into the walls of its range marked in yellow between 1.3069-1.3214.
Further selling within the range has the weekly support level at 1.3086 to target, sitting just beneath the 1.31 handle (not marked). Another key thing to note is yesterday’s daily bearish pin-bar candle formation. While the pattern boasts limited resistance, further selling from here may transpire, targeting daily demand at 1.2949-1.3038. Note this area houses strong daily support standing at 1.3001 (history dating back to Sept 2016), followed by a 61.8% daily Fib support value at 1.2982.
Areas of consideration:
Having seen H4 price action re-enter its range, a retest to the underside of the top edge at 1.3214 (as per the pink arrows), is of interest this morning, with an ultimate target set at the weekly support level mentioned above at 1.3086. To help avoid an unnecessary loss on a whipsaw higher at 1.3214, traders could consider waiting and seeing if H4 price prints a full or near-full-bodied bearish candle, before pulling the trigger.
Today’s data points: US Philly Fed manufacturing index; US unemployment claims; FOMC member Quarles speaks.
USD/CHF:
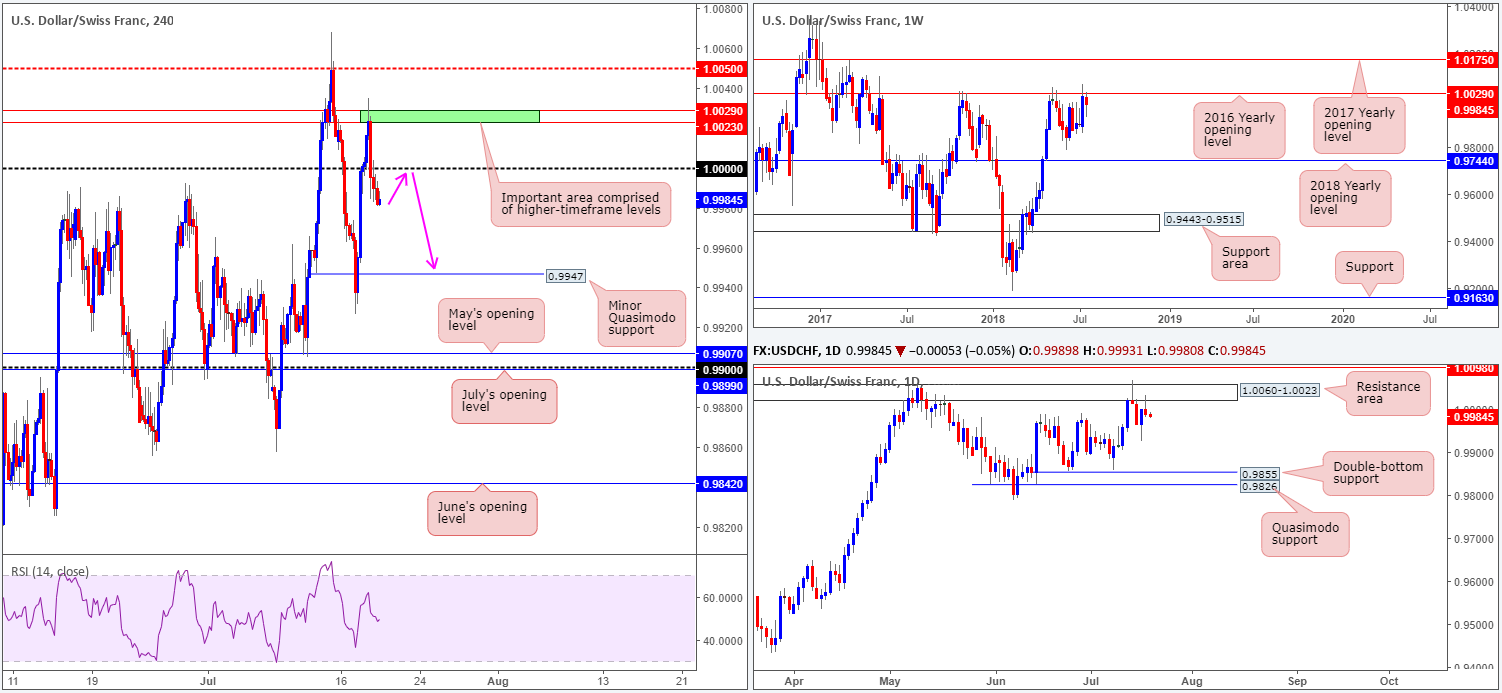
For those who read Wednesday’s report you may recall the team highlighting 1.0029/1.0023 marked in green on the H4 timeframe as a potential sell zone. Our reasons for selecting such a zone came down to its higher-timeframe connection: the 2016 yearly opening level on the weekly timeframe at 1.0029 and the underside of a daily resistance area at 1.0023. Well done to any of our readers who managed to pin down a setup based off this area, as H4 action recently crossed back beneath parity (1.0000).
Areas of consideration:
Knowing we’re coming from higher-timeframe resistances, along with daily price printing a nice-looking bearish pin-bar candle formation yesterday and H4 price now firmly positioned beneath 1.0000, further selling could on the cards today.
A retest to the underside of 1.0000 is a viable platform for shorts, as per the pink arrows, targeting H4 minor Quasimodo support at 0.9947 as the initial port of call.
Today’s data points: US Philly Fed manufacturing index; US unemployment claims; FOMC member Quarles speaks.
Dow Jones Industrial Average:
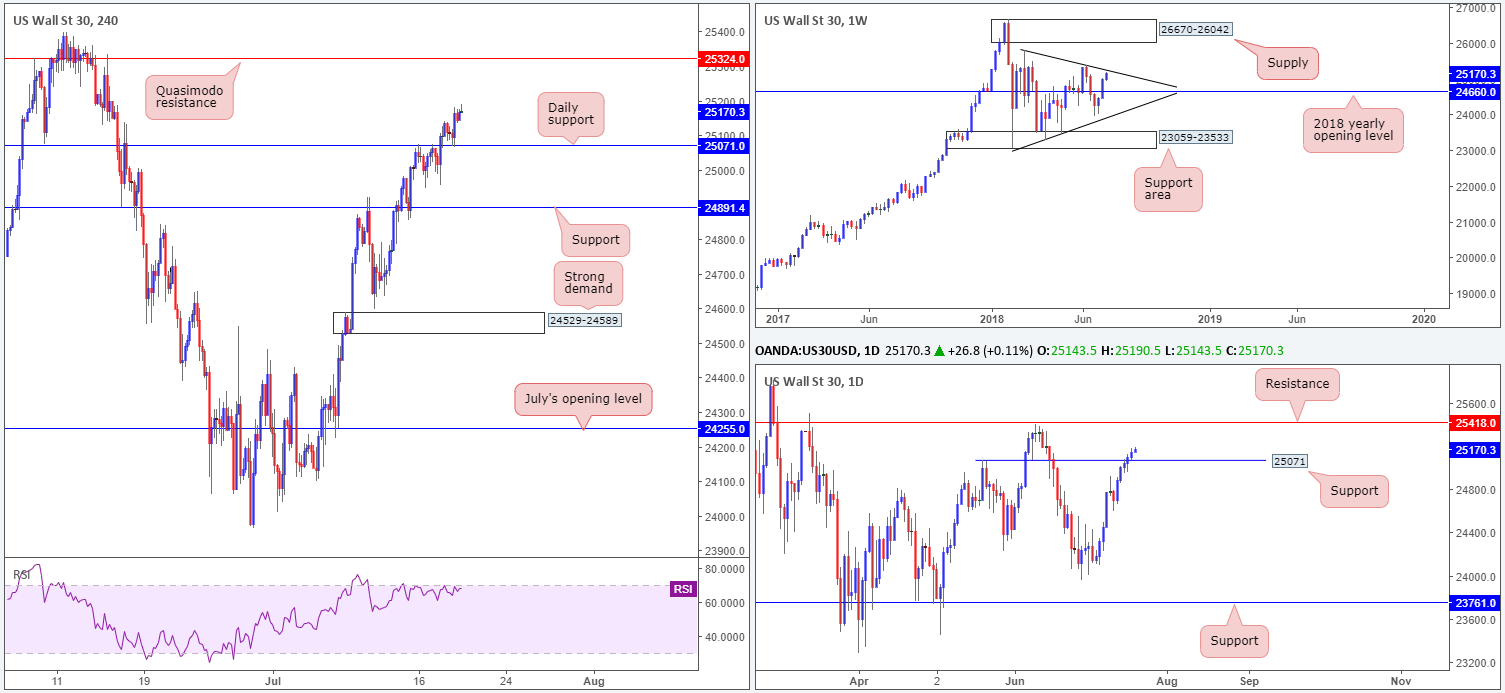
US equities penciled in a fifth consecutive daily close higher on Wednesday, boosted by gains observed in the financial sector. For folks who read Wednesday’s morning briefing, you may recall the team suggested watching the daily support at 25071 on the H4 timeframe for a possible retest play, targeting weekly trend line resistance (etched from the high 25807). As is evident from the H4 chart, the setup played out beautifully. We also touched on the possibility of a run up to the H4 Quasimodo resistance level plotted at 25342, in light of the room seen to move higher on the daily timeframe to resistance at 25418.
Areas of consideration:
Well done to any of our readers who managed to secure a long position off 25071. Risk should already be reduced to breakeven with eyes on the weekly trend line resistance mentioned above for partial profit taking. The next area of interest beyond here, as mentioned above, falls in at the H4 Quasimodo resistance level at 25342.
Aside from the recent setup, we do not see much to hang our hat on in terms of trading opportunities at the moment.
Today’s data points: US Philly Fed manufacturing index; US unemployment claims; FOMC member Quarles speaks.
XAU/USD (Gold)
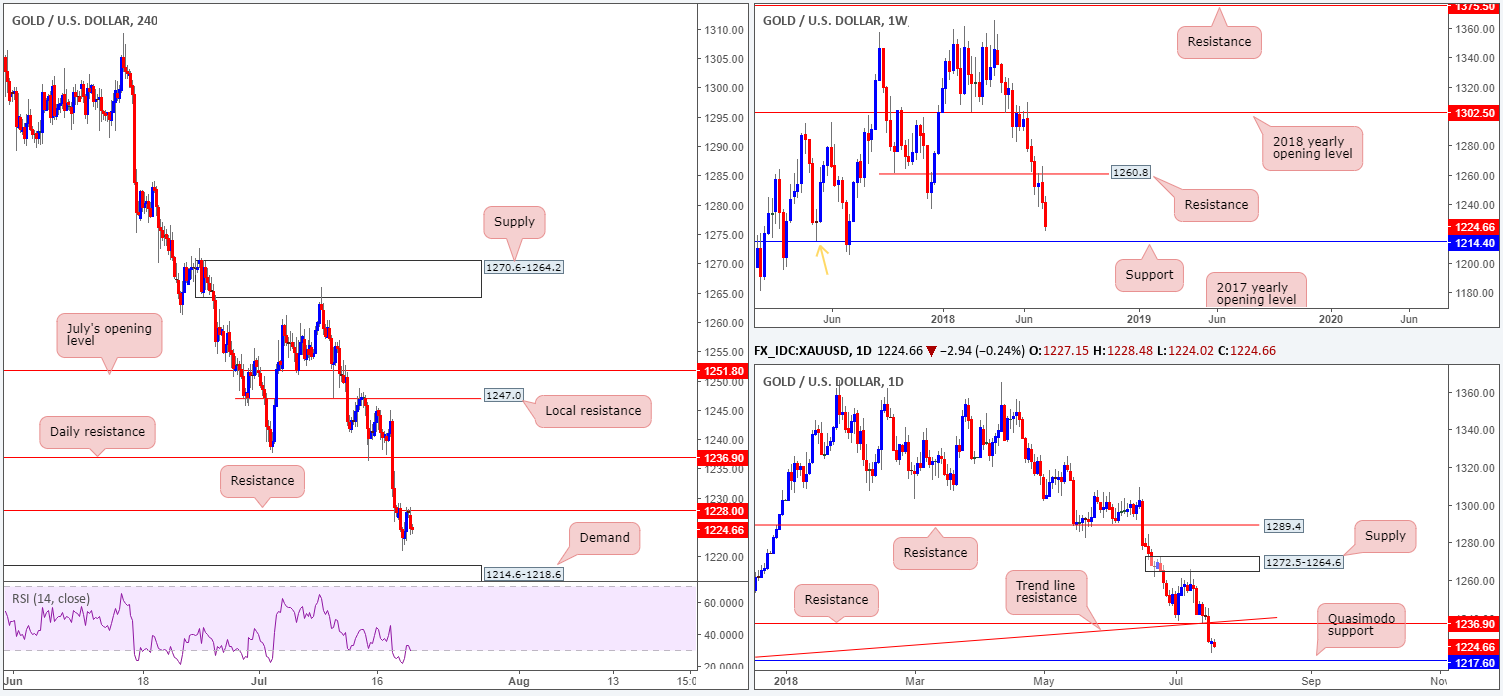
The price of gold closed unchanged on Wednesday, despite a brief spell to lows of 1221.2.
Weekly flows show room to press as far south as weekly support at 1214.4, which also happens to represent a Quasimodo support taken from the left shoulder marked with an orange arrow. In addition to this, daily action also displays room to probe as low as Quasimodo support at 1217.6.
In Wednesday’s report the team highlighted the H4 support at 1228.0 as a level likely to suffer a breach. On this occasion we were correct. The team also underlined a possible selling opportunity at the underside of 1228.0, should the unit retest the level as resistance, which, as you can see, played out and has closed in the shape of a near-full-bodied H4 bearish candle.
Areas of consideration:
In view of the above scenario, entering short off of the recently closed H4 near-full-bodied bearish candle is an option (stop-loss order best placed above 1228.4 – the rejection candle’s wick), targeting H4 demand at 1214.6-1218.6. Note this area houses the daily support mentioned above at 1217.6, and is plotted just north of the weekly support at 1214.4. Therefore, looking for gains beyond these levels will potentially be a challenge.
The use of the site is agreement that the site is for informational and educational purposes only and does not constitute advice in any form in the furtherance of any trade or trading decisions.
The accuracy, completeness and timeliness of the information contained on this site cannot be guaranteed. IC Markets does not warranty, guarantee or make any representations, or assume any liability with regard to financial results based on the use of the information in the site.
News, views, opinions, recommendations and other information obtained from sources outside of www.icmarkets.com.au, used in this site are believed to be reliable, but we cannot guarantee their accuracy or completeness. All such information is subject to change at any time without notice. IC Markets assumes no responsibility for the content of any linked site. The fact that such links may exist does not indicate approval or endorsement of any material contained on any linked site.
IC Markets is not liable for any harm caused by the transmission, through accessing the services or information on this site, of a computer virus, or other computer code or programming device that might be used to access, delete, damage, disable, disrupt or otherwise impede in any manner, the operation of the site or of any user’s software, hardware, data or property.
