
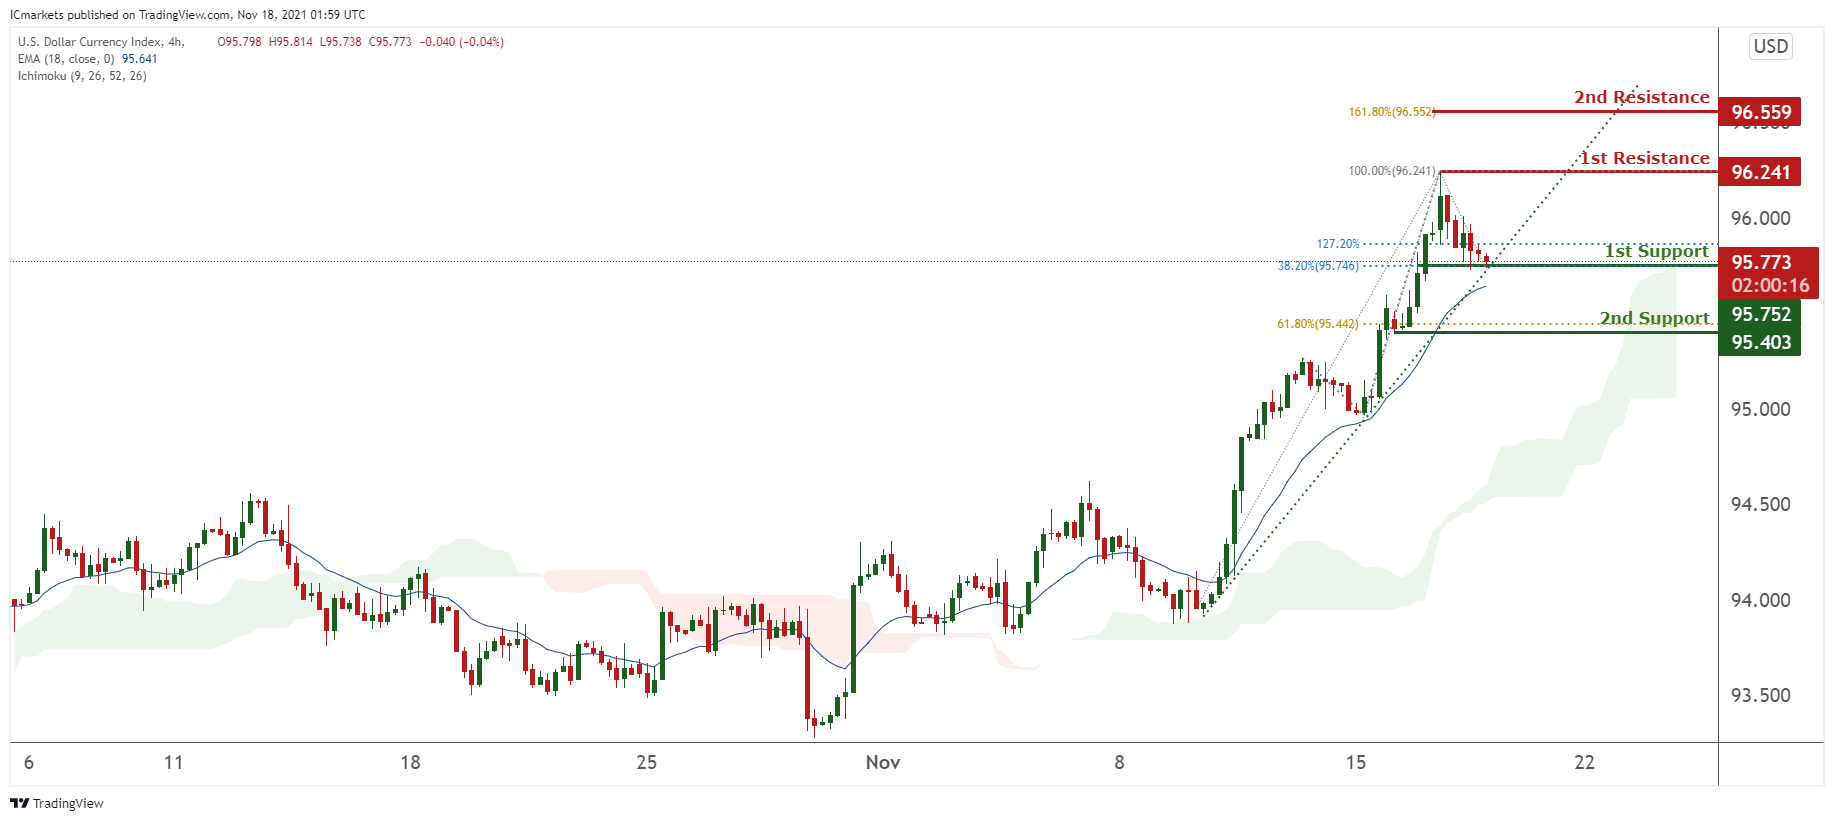
DXY:
On the H4 timeframe, prices are on a bullish momentum. We see potential for a bounce towards our 1st resistance at 96.241 in line with 100% Fibonacci retracement. Technical indicators are at a level where bounces happened previously. Alternatively, breaking our 1st support might find prices dip towards our 2nd support at 95.403 in line with 61.8% Fibonacci retracement.
Areas of consideration:
- H4 time frame, 1st resistance at 96.241
- H4 time frame, 1st support at 95.752
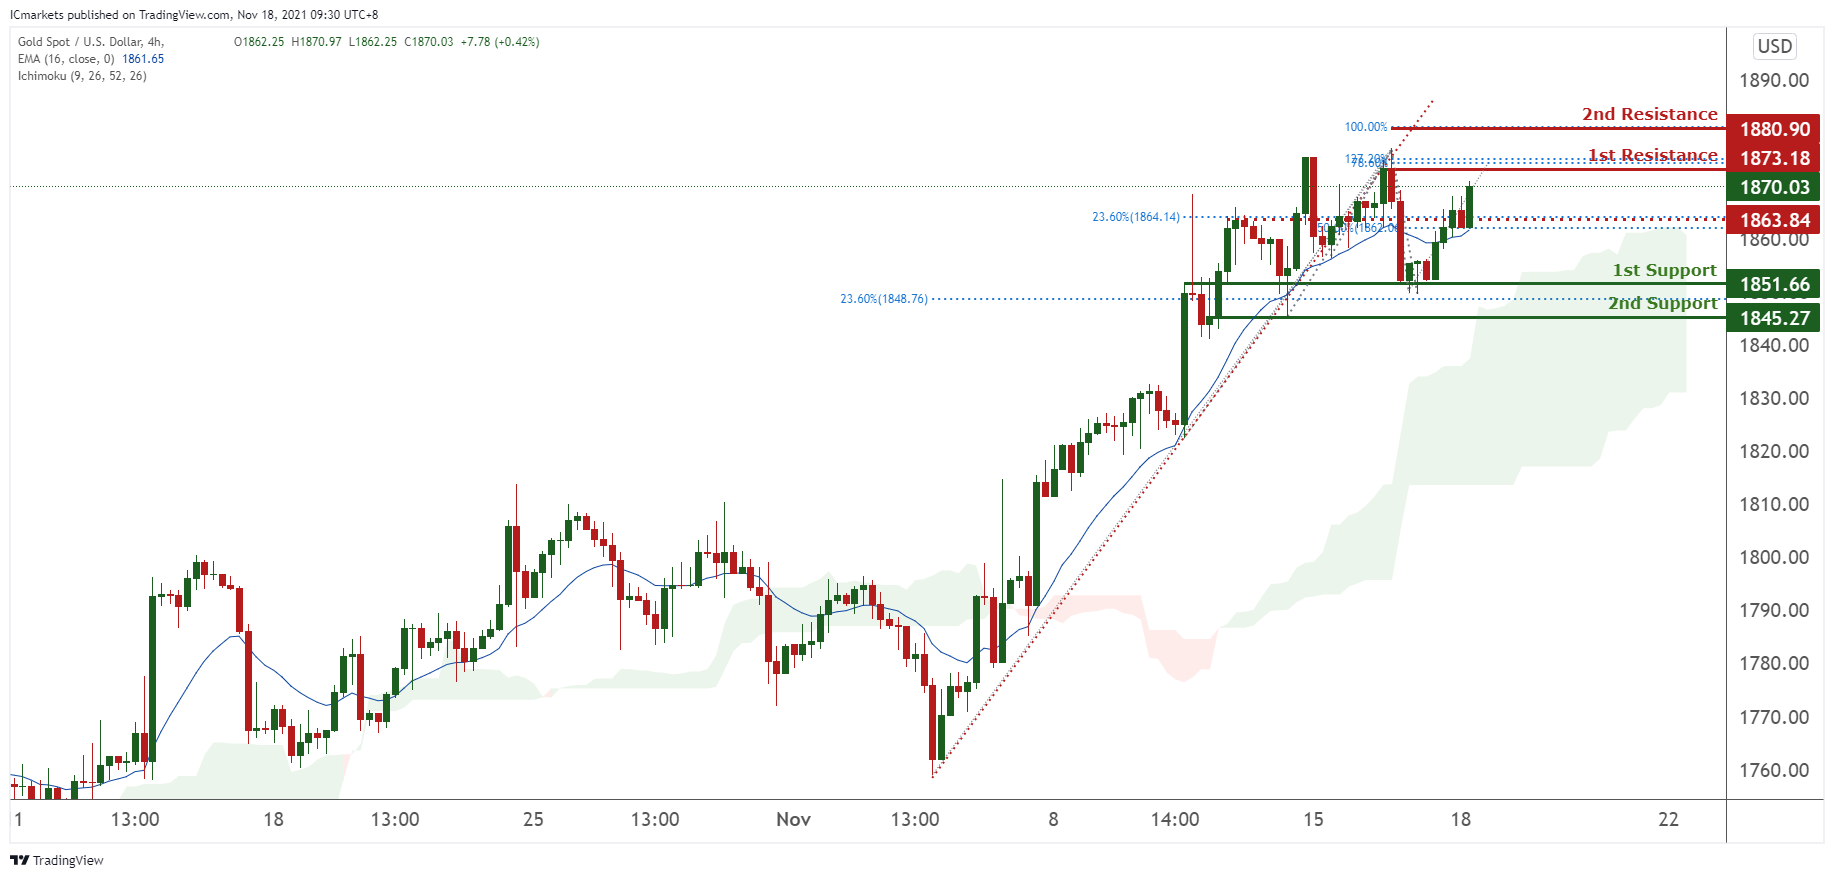
XAU/USD (GOLD):
On the H4 chart, as mentioned previously, prices have recently broken out of our ascending trendline and tested our 1st support at 1851.66. We see potential for prices to retest our ascending trendline and test our 1st resistance at 1873.18 in line with 78.6% Fibonacci retracement and Fibonacci extension. As technical indicators are showing bullish momentum. Alternatively, prices might dip towards our 1st support at 1851.66 in line with 23.6% Fibonacci retracement.
Areas of consideration:
- 4h 1st support at 1851.66
- 4h 1st resistance at 1873.03
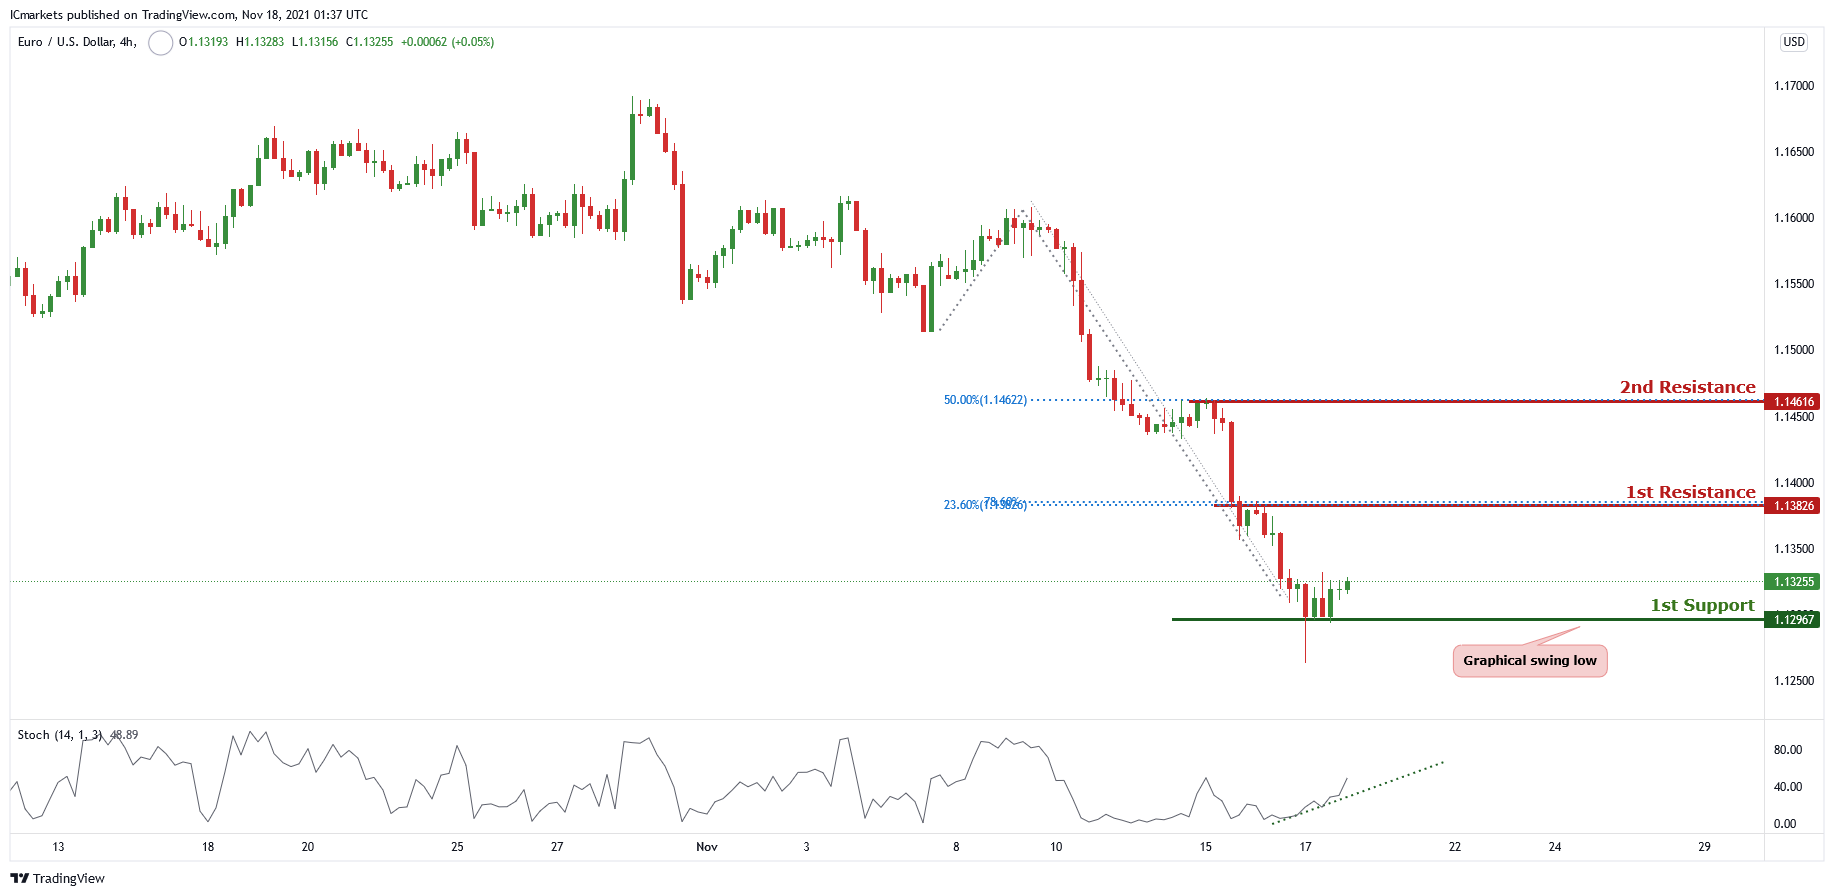
EUR/USD:
On the H4 chart, price is near the first support of 1.12967 and graphical swing low level. Price can potentially go to the first resistance of 1.13826 which is also 23.6% Fibonacci retracement and 78.6% Fibonacci projection. Our bullish bias is supported by stochastic as it is on an ascending trendline.
Areas of consideration
H4 first resistance – 1.13826
H4 first support 1.12967
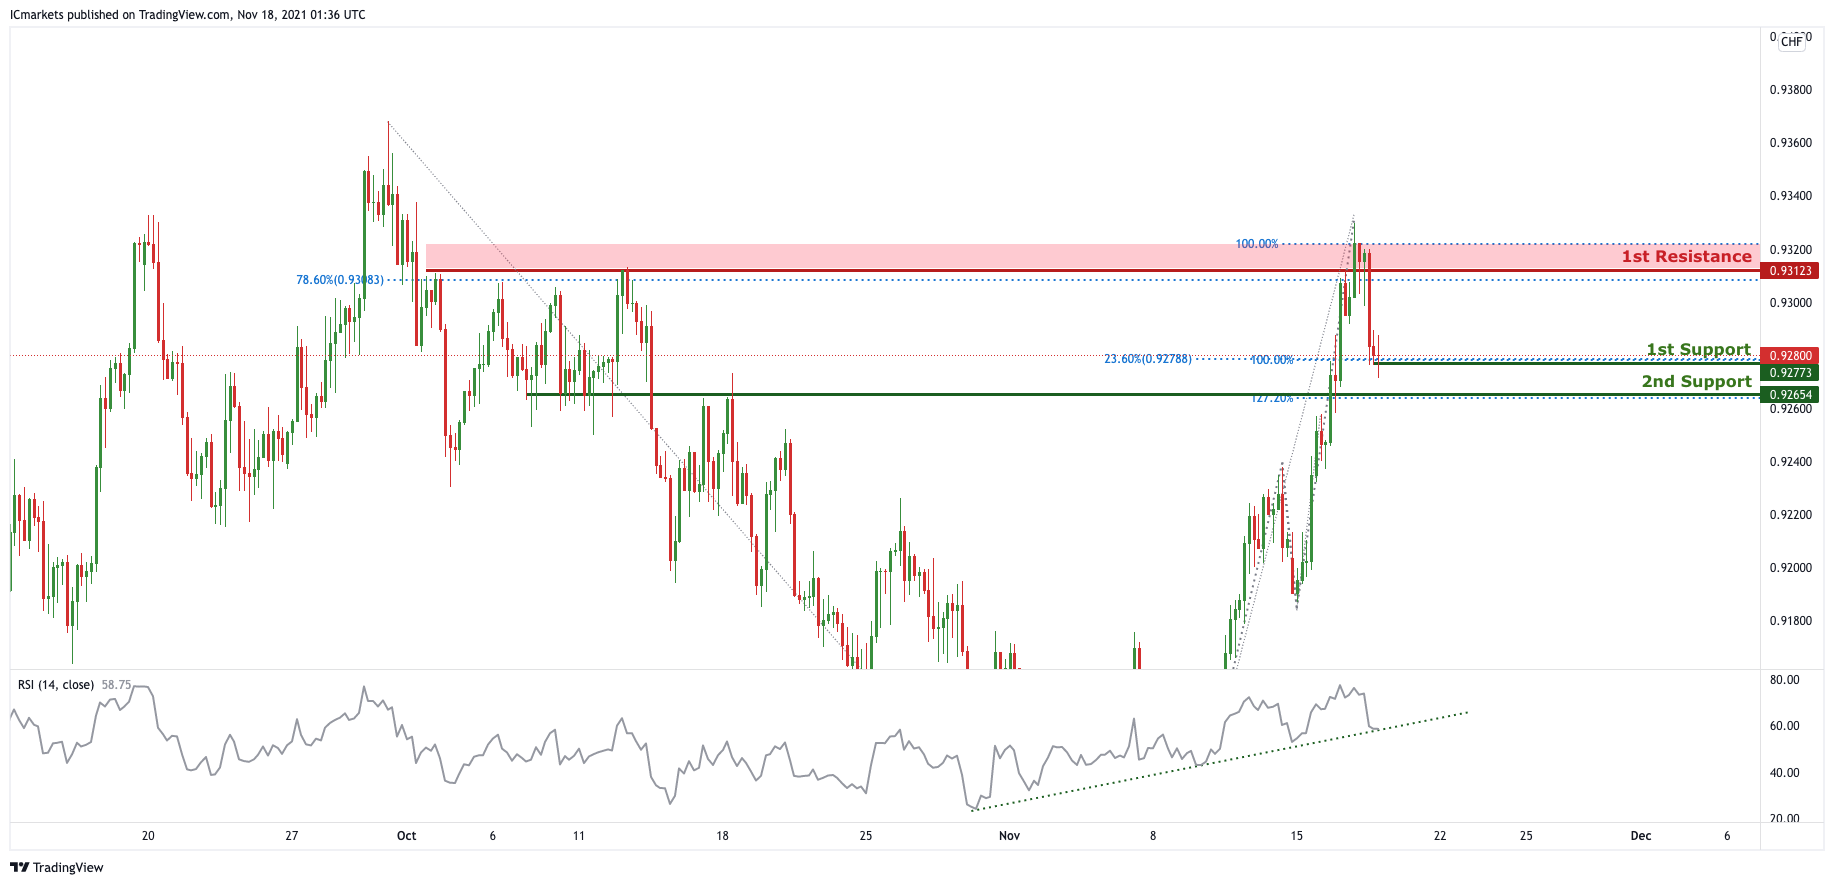
USD/CHF:
In reference to yesterday’s analysis, on the H4 timeframe,price indeed dropped and is reaching 1st Support. We can now expect price would bounce from the 1st Support in line with 23.6% Fibonacci retracement and 100% Fibonacci projection towards 1St resistance in line with 78.6% Fibonacci retracement and graphical swing highs. Our bullish bias is further supported by RSI indicator where it is abiding to the ascending trendline support.
Areas of consideration:
- Watch 1st Support at 0.92773
- Watch 1st Resistance at 0.92654
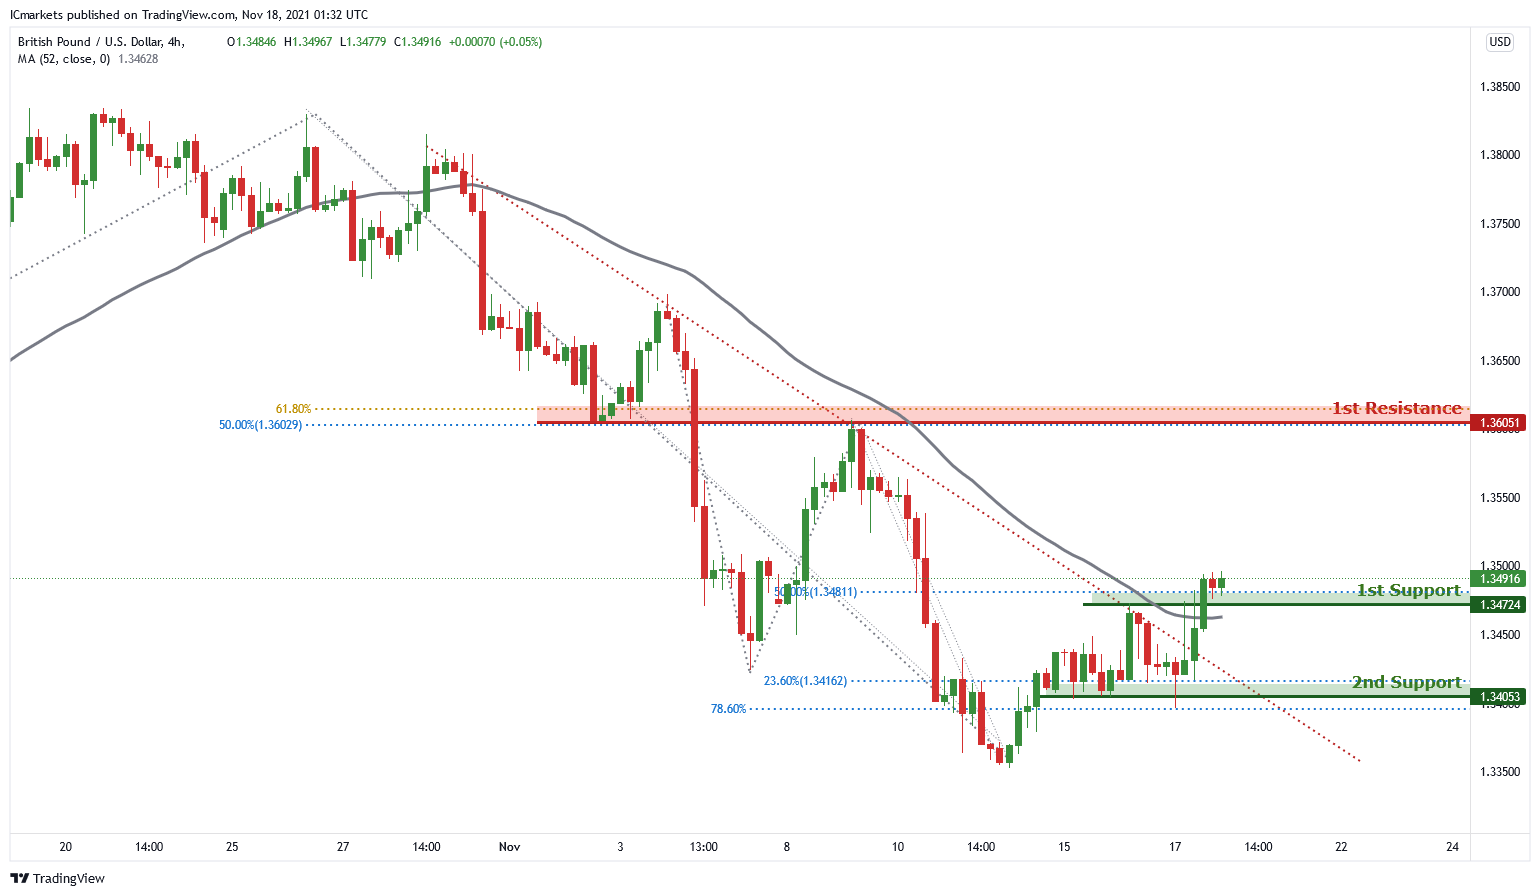
GBP/USD:
Price recently broke out of the descending trendline and near the first support level of 1.34724 which is also 50% Fibonacci retracement. Price can go to the first resistance level of 1.36051 which is 61.8% Fibonacci projection and 50% Fibonacci retracement. Our bullish bias is supported by the moving average as price is trading above it.
Areas of consideration :
H4 first support: 1.34724
H4 first resistance : 1.36051
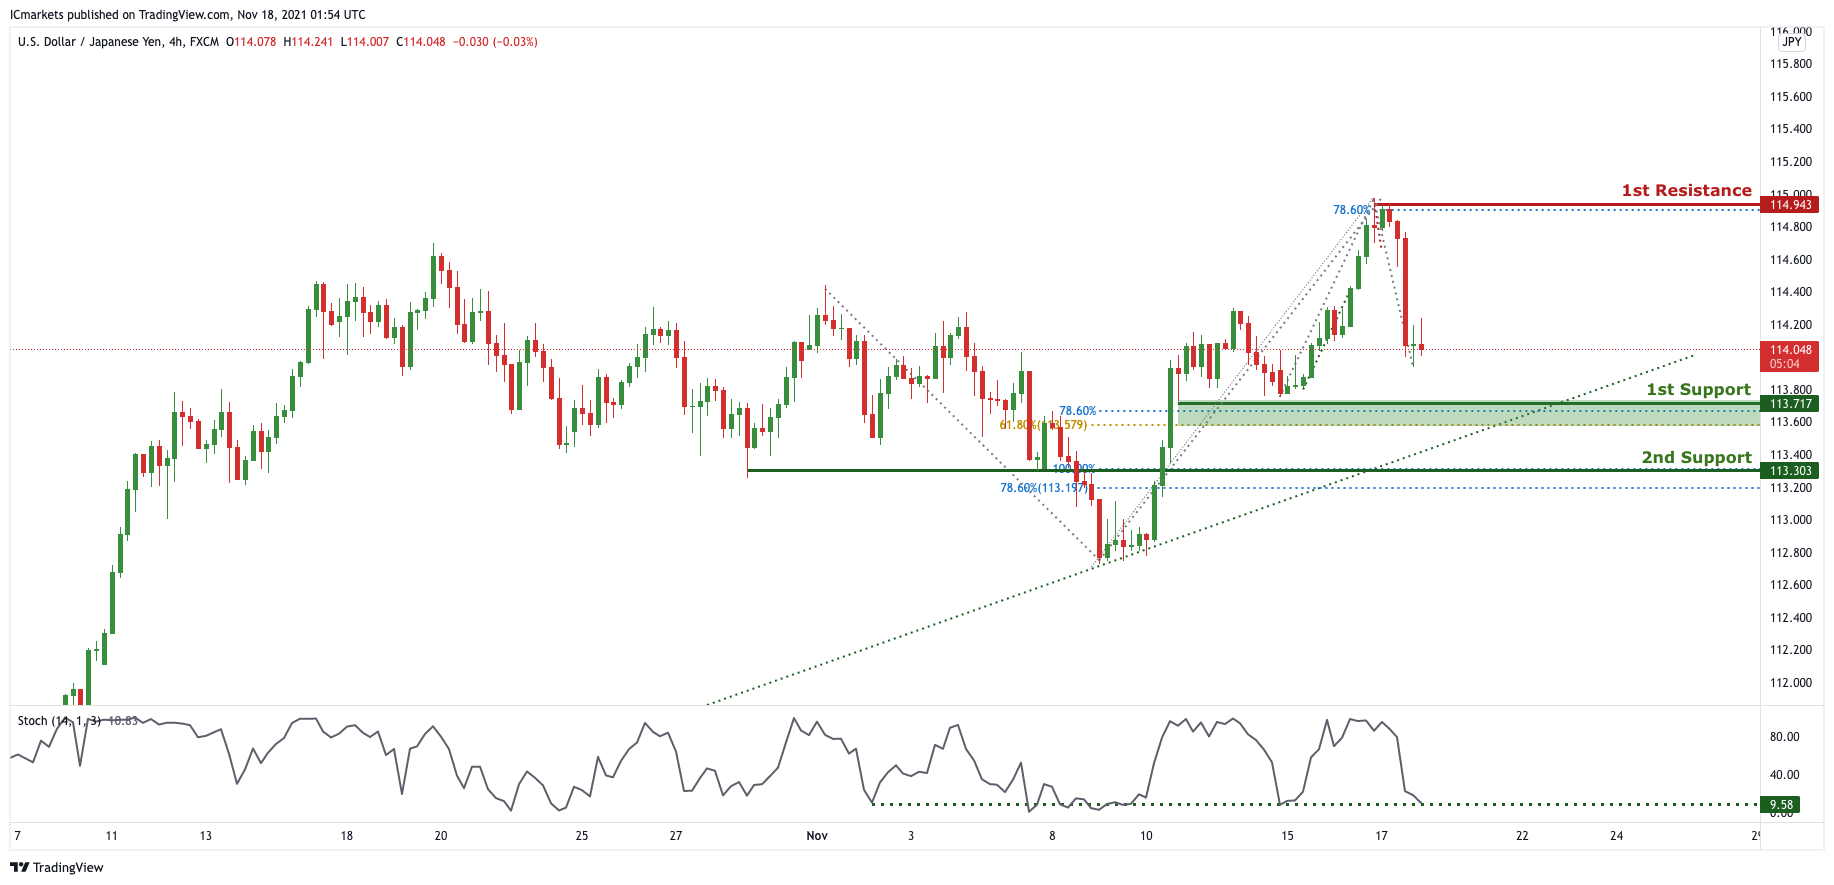
USD/JPY:
In reference to yesterday’s analysis, price indeed hit the support level at 114.292. On the H4 timeframe, we can now expect price to make a bounce from the 1st Support in line with 78.6% Fibonacci projection and 61.8% Fibonacci retracement towards 1st Resistance in line with 78.6% Fibonacci projection. Our bullish bias is further supported by the stochastic indicator where the%K line is approaching the support level.
Areas of consideration:
- H4 1st resistance level 114.943
- H4 1st support level 113.297
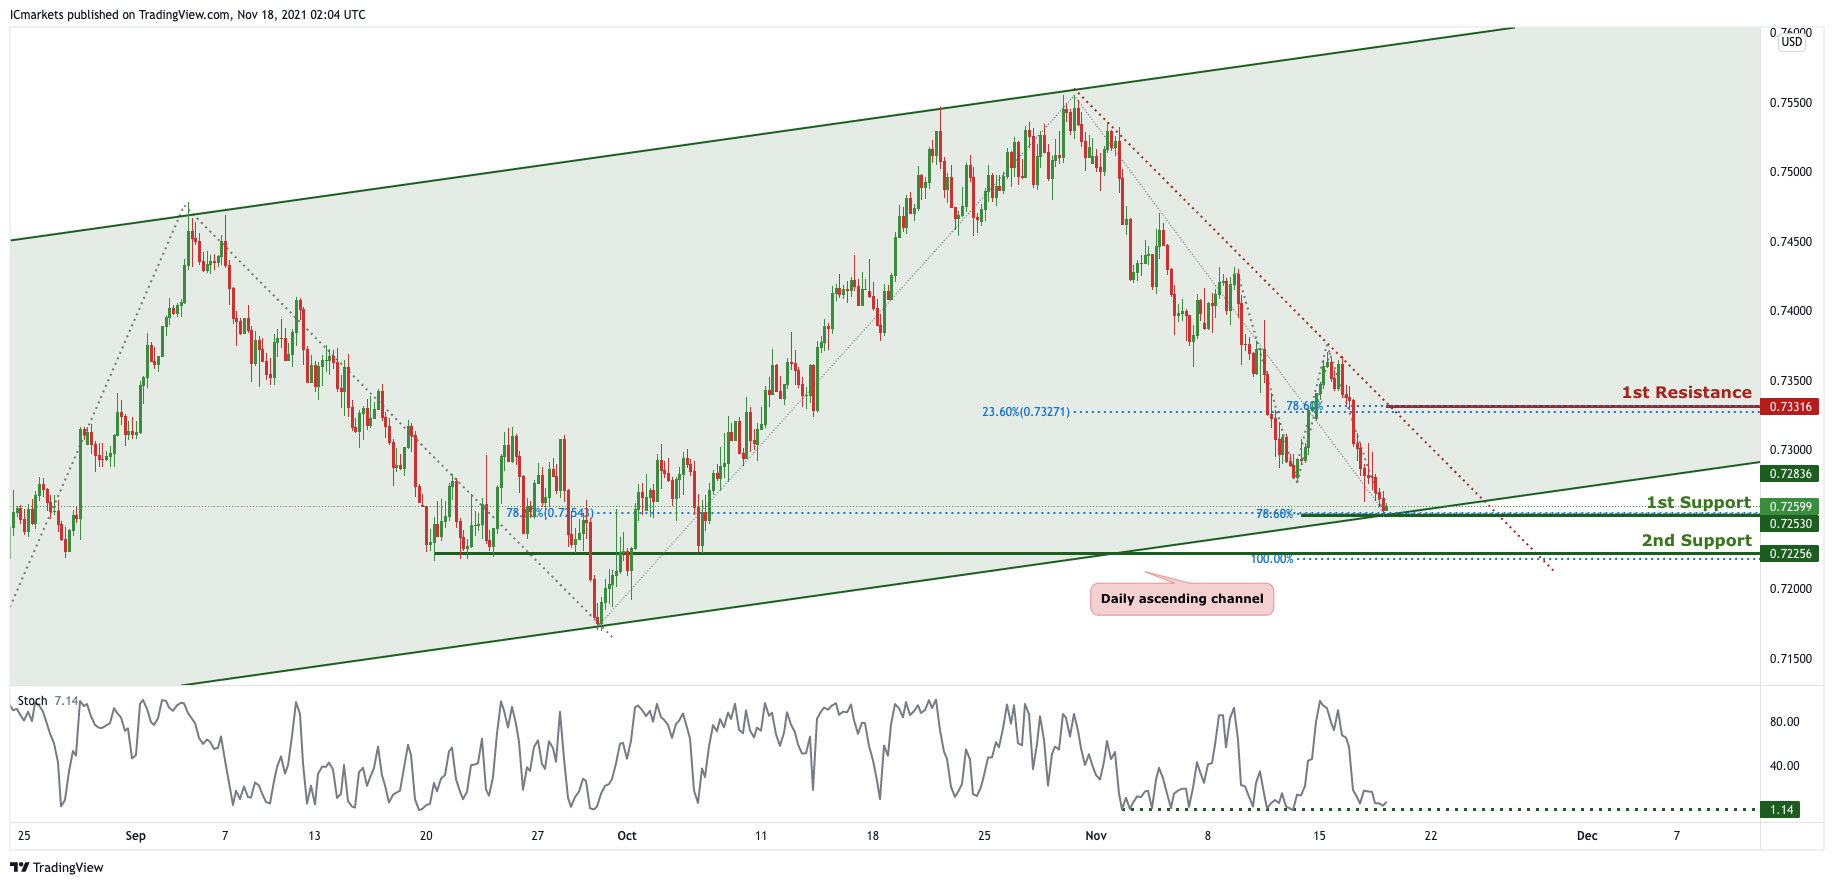
AUD/USD:
On the H4, we can see that price abiding to the ascending channel on the daily and descending trendline on the H4. We can expect price to make a bounce from 1st Support in line with 78.6% Fibonacci projection, 78.6% Fibonacci retracement and ascending channel support towards the 1st Resistance in line with 78.6% Fibonacci projection and 23.6% FIbonacci retracement.Our bullish bias is further supported by stochastic indicator where the %K line is at the support level awaiting for a bounce.
Areas of consideration:
- H4 1st resistance level 0.73316
- H4 1st support level 0.72530
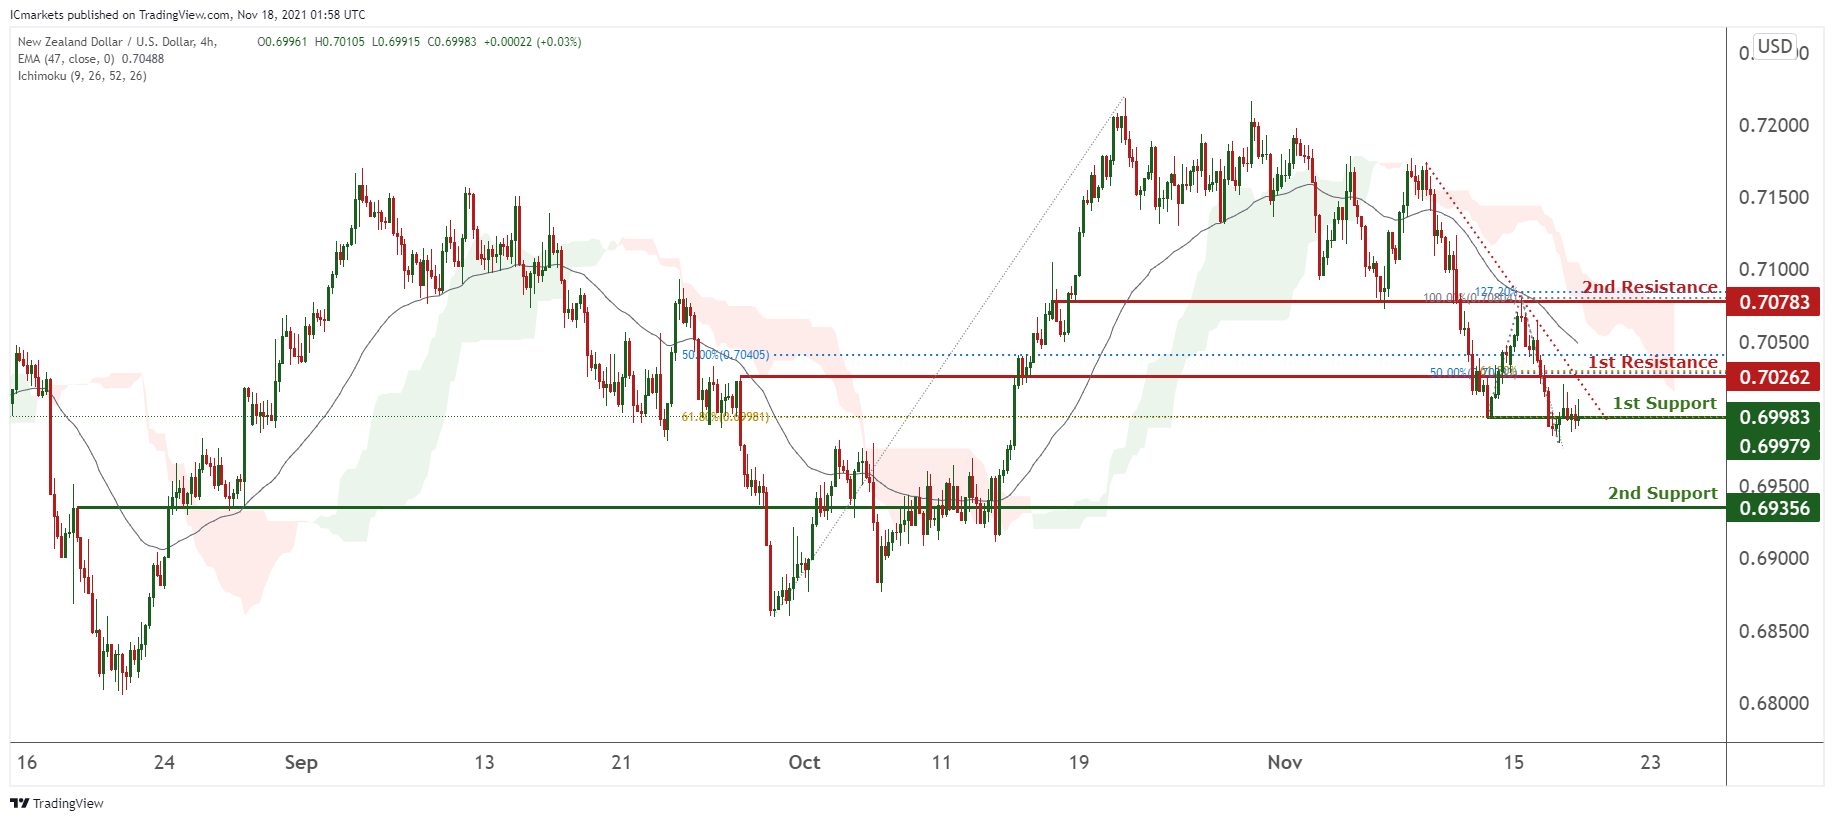
NZD/USD:
On the H4 timeframe, prices are on a bearish momentum. We see potential for a slight pullback towards testing our 1st resistance at 0.70262 in line with 50% Fibonacci retracement, 50% retracement retracement and 61.8% Fibonacci retracement towards our bearish trendline. Technical indicators are showing bearish momentum. If prices break our 1st support, prices can potentially dip further towards our 2nd support at 0.69356 in line which is a graphical overlap.
Areas of consideration:
- H4 time frame, 1st resistance at 0.70262
- H4 time frame, 1st support at 0.69979
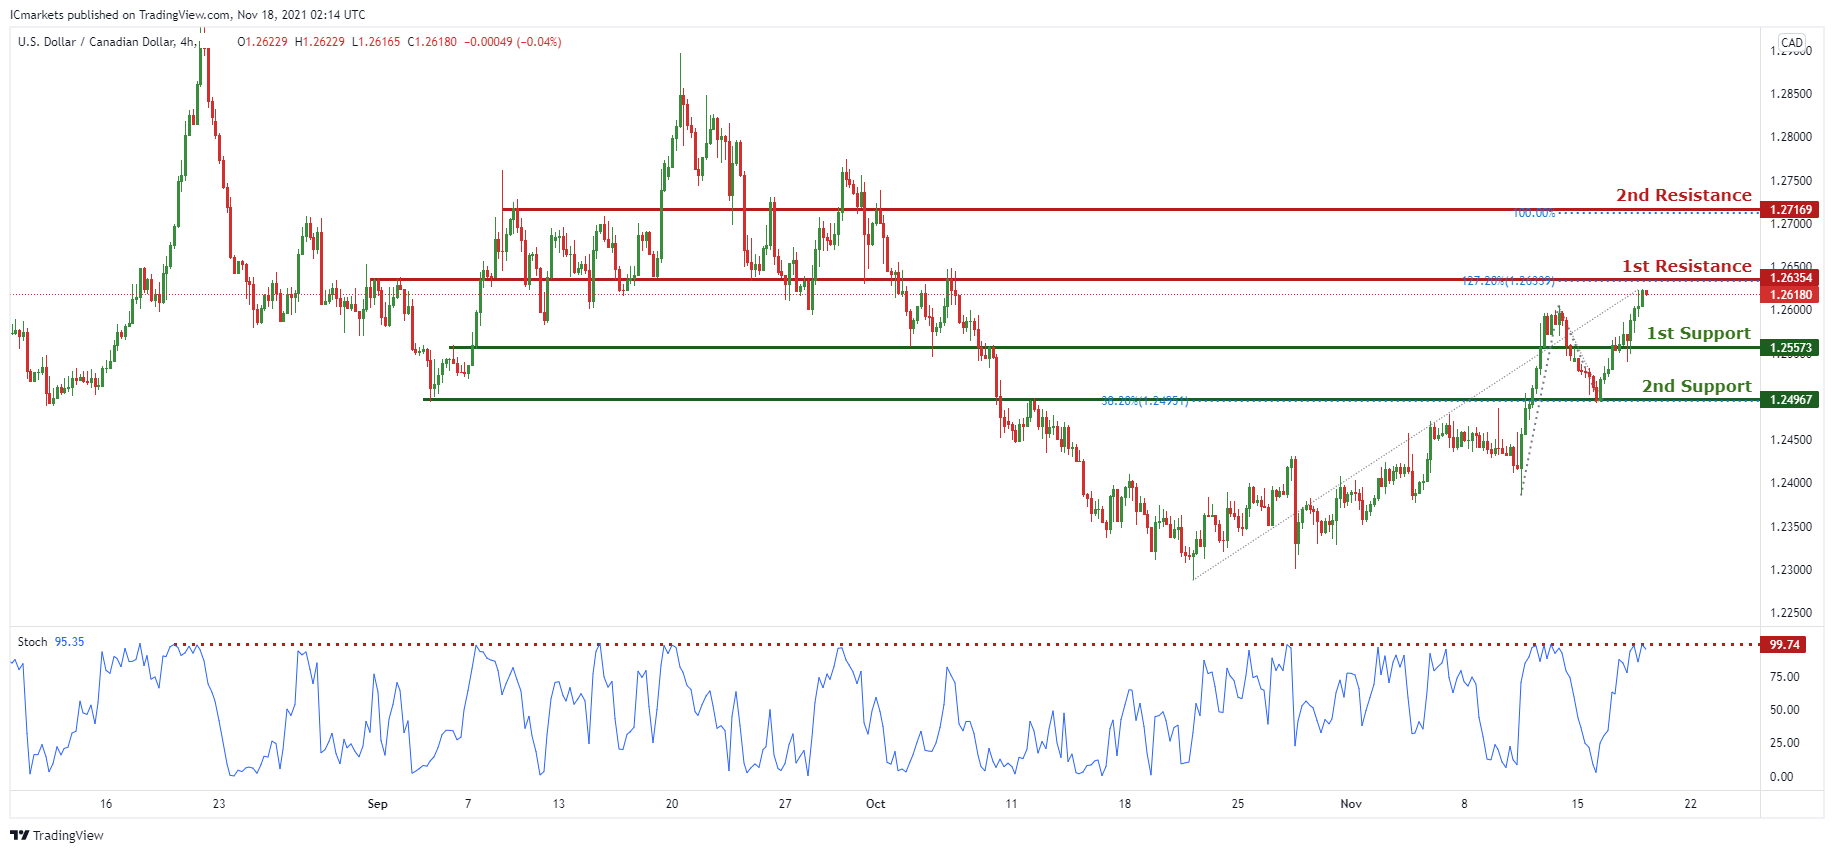
USD/CAD:
On the H4, with price approaching resistance on the stochastics indicator, we have a bearish bias that price will dip to 1st support at 1.24935 in line with the graphical swing low support from 1st resistance at 1.26028 in line with the horizontal overlap resistance and possibly to 2nd support at 1.24163 in line with our horizontal overlap resistance and 61.8% Fibonacci retracement level. Alternatively, we may see price break 1st resistance structure and head for 2nd resistance at 1.27083 in line with the100% Fibonacci projection level and horizontal swing high resistance.
Areas of consideration:
- H4 time frame, support at 24935
- H4 time frame, resistance at 26028
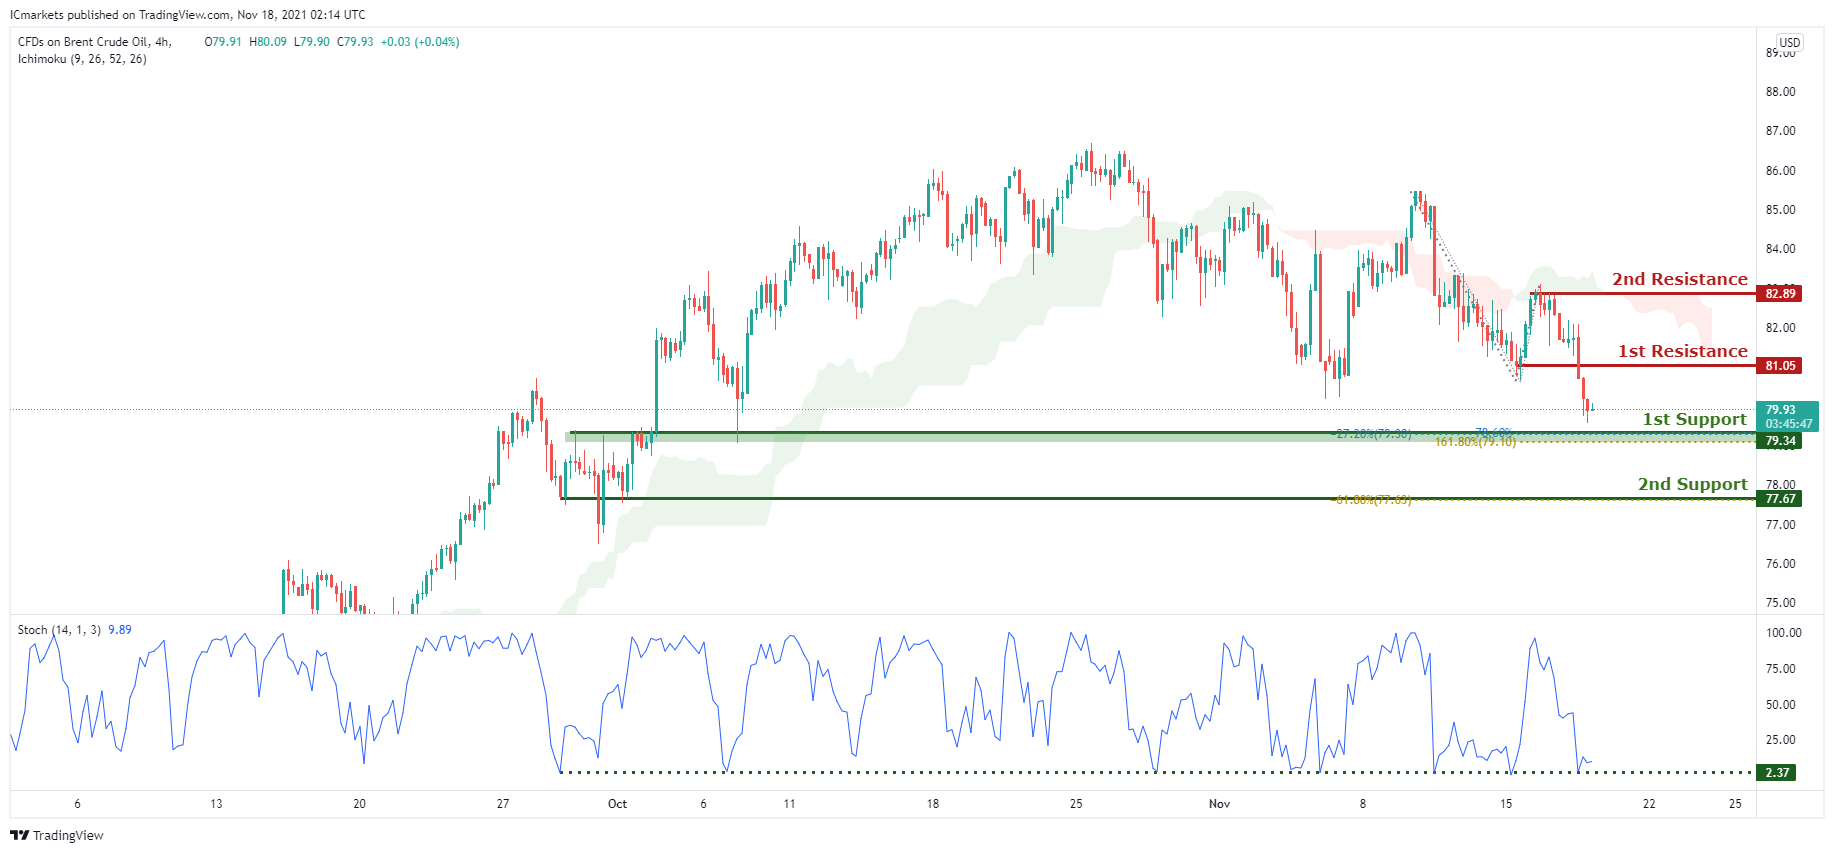
OIL:
On the H4 timeframe,with price approaching a strong support zone on a graphical level and the support of the stochastics indicator, we have a bullish bias that price will rise to our 1st resistance at 81.05 in line with the g 1st support at 80.68 in line with our horizontal swing low support. Alternatively, price may break 1st resistance and head for 2nd resistance at 84.47 in line with our 78.6% Fibonacci retracement levels.
Areas of consideration:
- H4 time frame, 1st resistance of10
- H4 time frame, 1st support of68
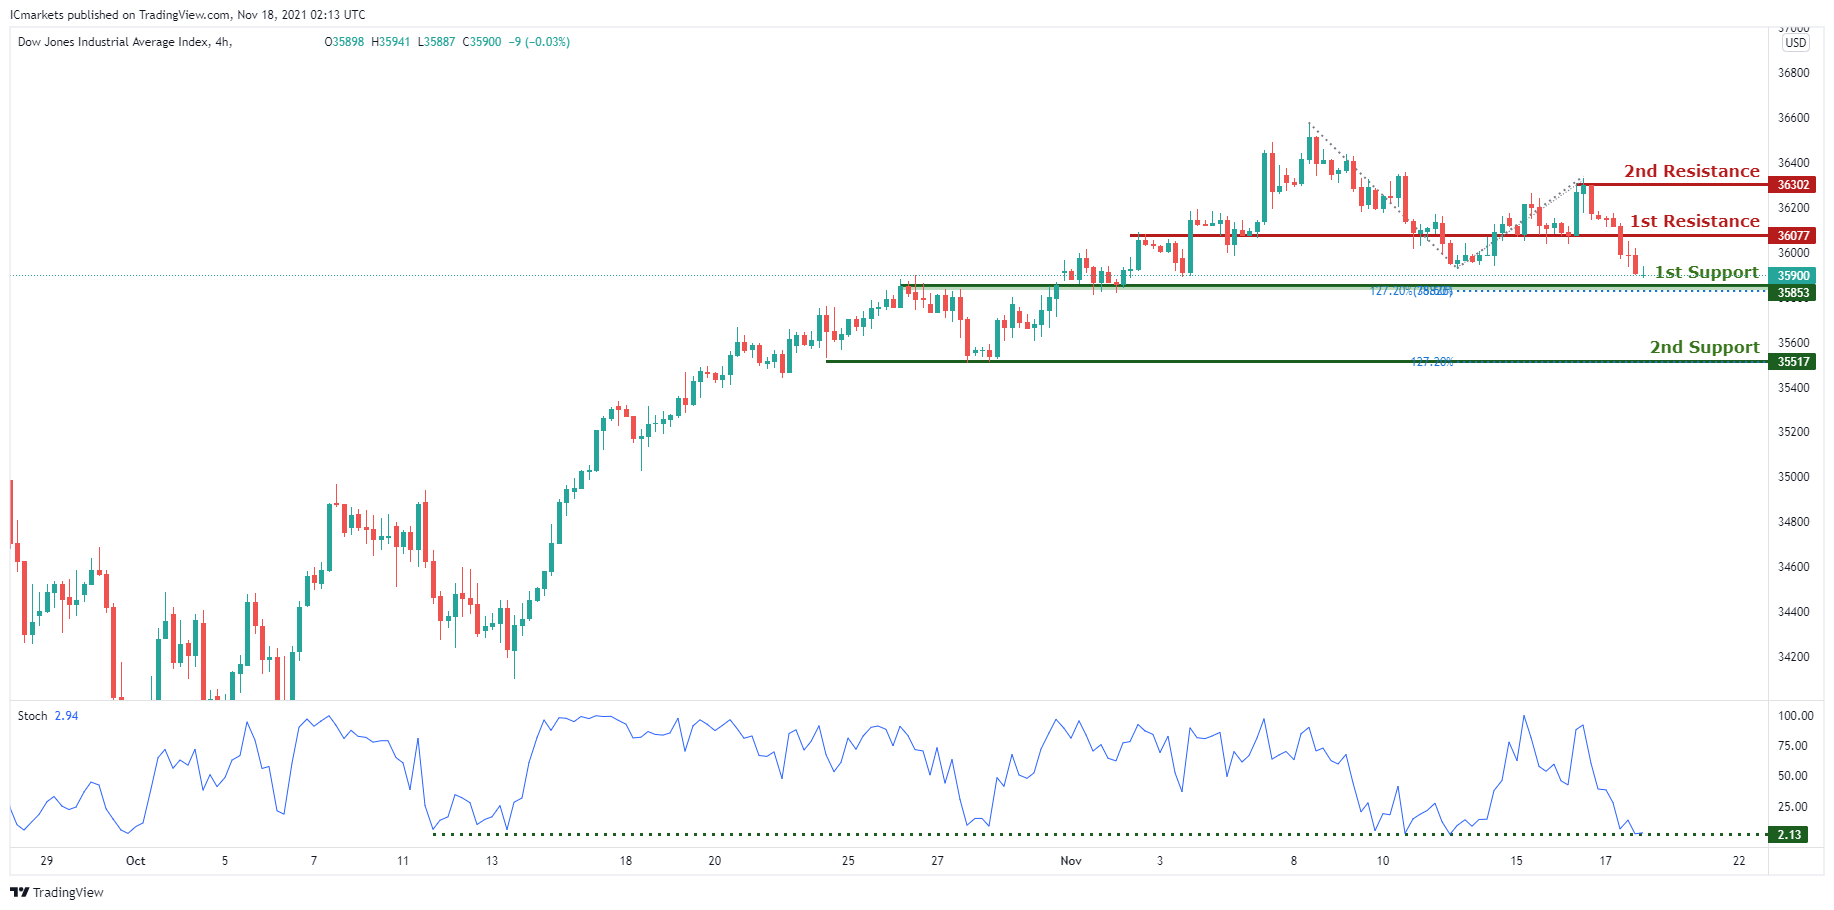
Dow Jones Industrial Average:
On the H4, with price testing the support on the ascending trendline, the support of the ichimoku cloud and the horizontal overlap support at 1st support in line with the 38.2% Fibonacci retracement at 36160, we are biased that price will rise from here to 1st resistance at 36568 in line with the horizontal swing high resistance. Alternatively, we may see price break 1st support and head for 2nd support at 35816 in line with graphical overlap support and 78.6% Fibonacci retracement.
Areas of consideration:
- 4H resistance at 36568
- 4H support at 36160
The accuracy, completeness and timeliness of the information contained on this site cannot be guaranteed. IC Markets does not warranty, guarantee or make any representations, or assume any liability regarding financial results based on the use of the information in the site.
News, views, opinions, recommendations and other information obtained from sources outside of www.icmarkets.com.au, used in this site are believed to be reliable, but we cannot guarantee their accuracy or completeness. All such information is subject to change at any time without notice. IC Markets assumes no responsibility for the content of any linked site.
The fact that such links may exist does not indicate approval or endorsement of any material contained on any linked site. IC Markets is not liable for any harm caused by the transmission, through accessing the services or information on this site, of a computer virus, or other computer code or programming device that might be used to access, delete, damage, disable, disrupt or otherwise impede in any manner, the operation of the site or of any user’s software, hardware, data or property.


