
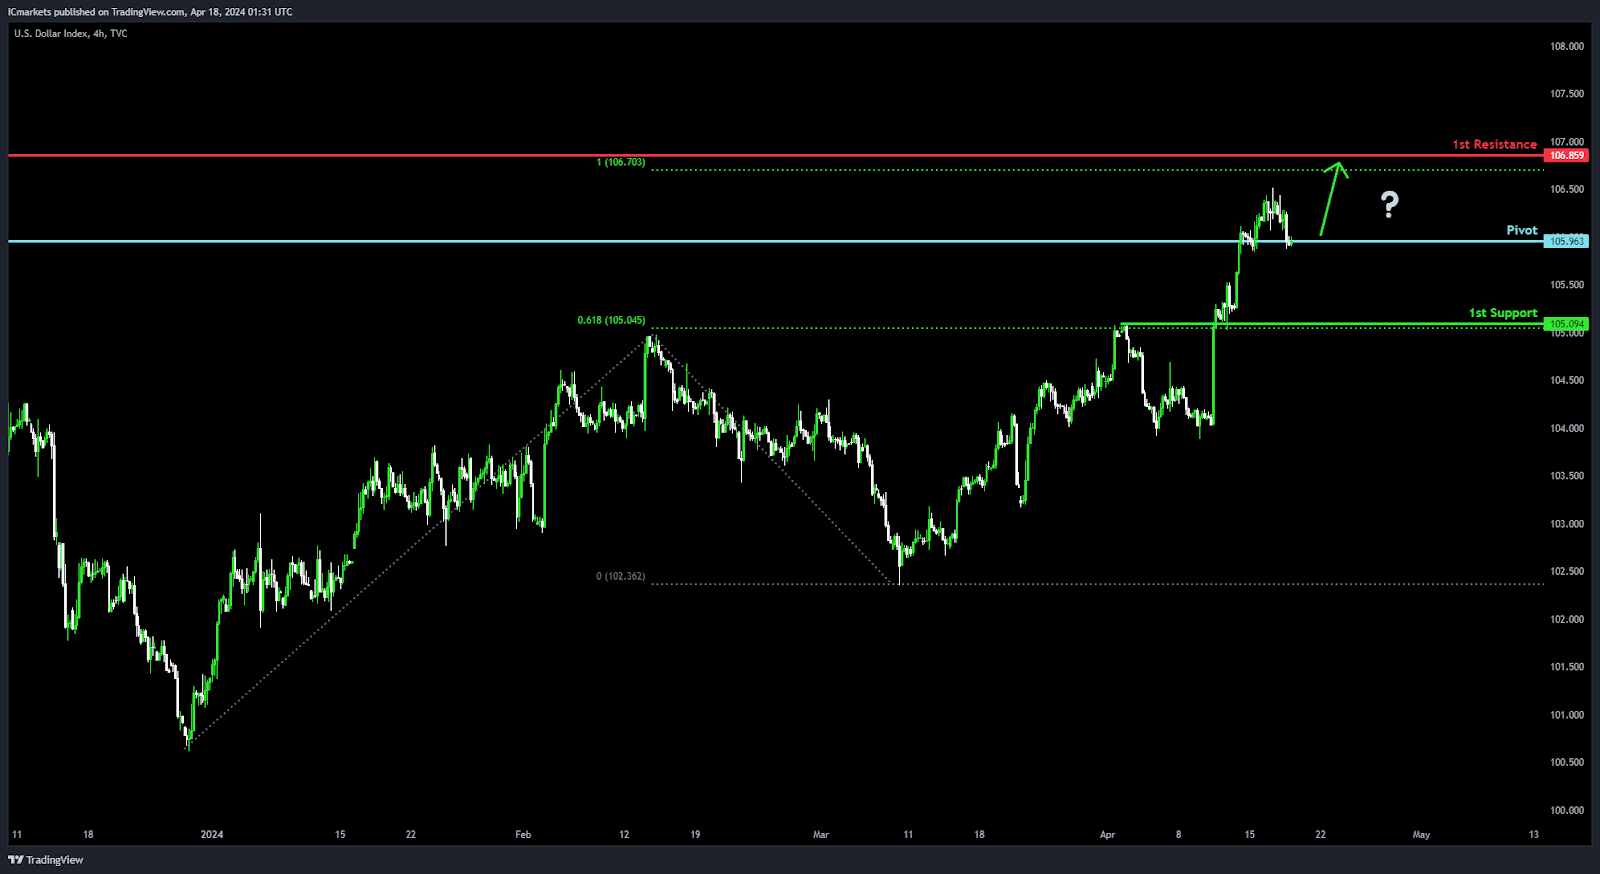
DXY (US Dollar Index):
Potential Direction: Bullish
Overall momentum of the chart: Bullish
Price could potentially make a: Bullish bounce off pivot and heads towards 1st resistance
Pivot: 105.96
Supporting reasons: An Overlap support, indicating a significant level where buyers might step in to support the price, potentially leading to a reversal or temporary halt in the bullish momentum.
1st support: 105.09
Supporting reasons: An Overlap support with a 61.80% Fibonacci Projection, suggesting a significant level where buyers might enter the market, potentially providing support for the price or a temporary reversal within the context of the overall bullish trend.
1st resistance: 106.85
Supporting reasons: An Overlap resistance with a 100% Fibonacci Projection, indicating a level where selling pressure might intensify, potentially acting as a barrier to further upside movement within the context of the overall bullish momentum.
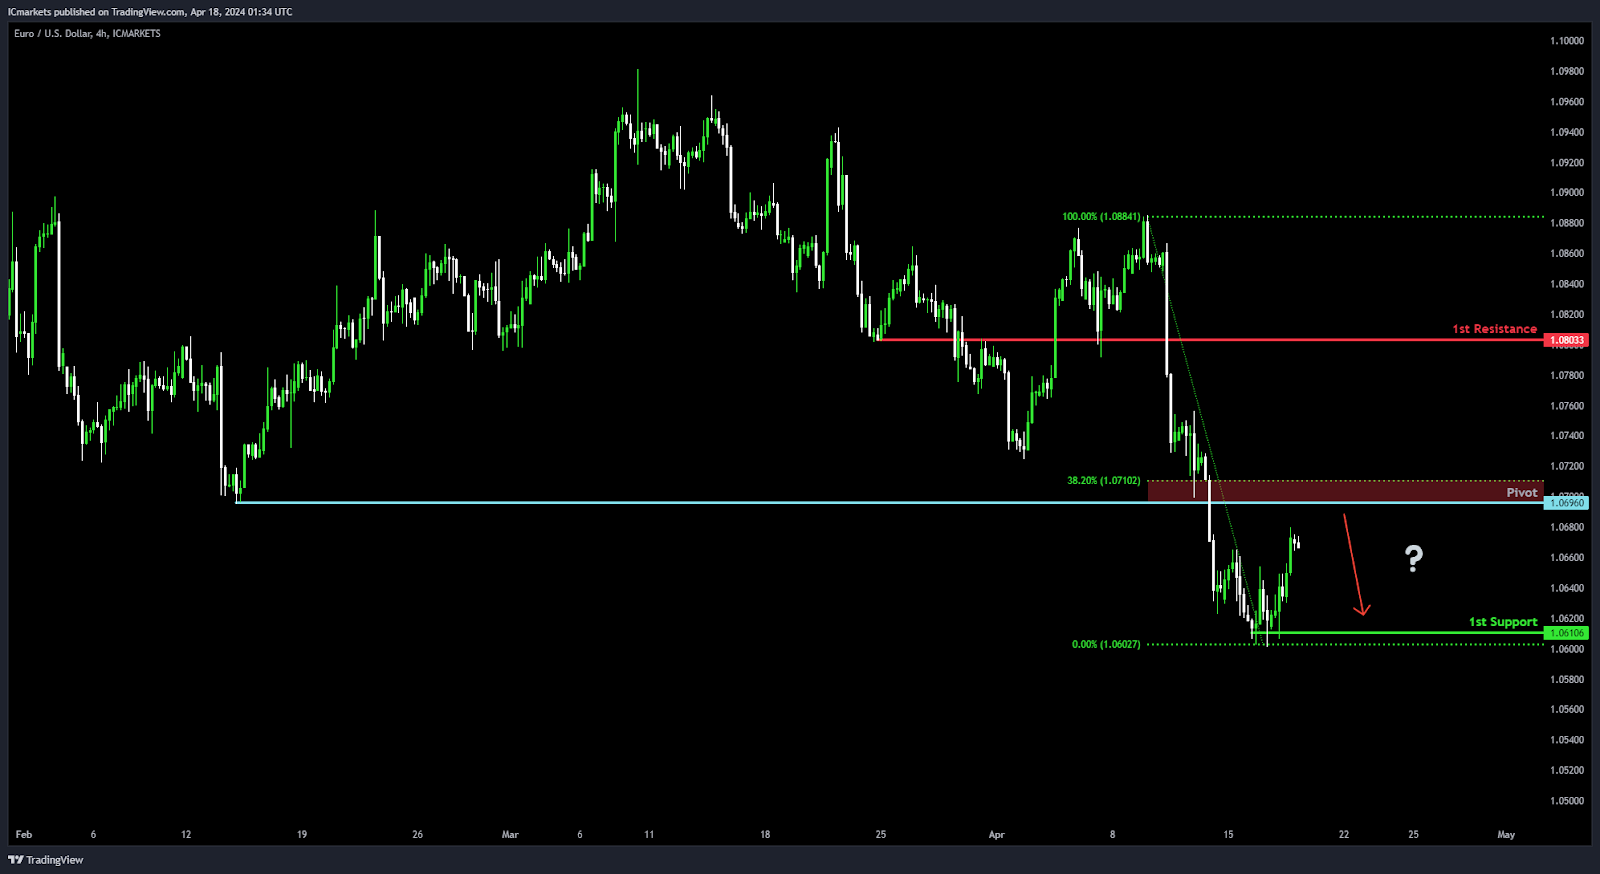
EUR/USD:
Potential Direction: Bearish
Overall momentum of the chart: Bearish
Price could potentially make a: Bearish reaction off pivot and drop to 1st support
Pivot: 1.0696
Supporting reasons: Pullback support with a 38.20% Fibonacci Retracement, indicating a significant level where buying pressure might intensify, potentially leading to a reversal or temporary halt in the bearish momentum.
1st support: 1.0610
Supporting reasons: Multi-swing low support, suggesting a level where buyers might step in to support the price, potentially providing a foundation for a minor rebound within the context of the overall bearish trend.
1st resistance: 1.0803
Supporting reasons: Pullback resistance, representing a level where selling pressure might intensify, potentially acting as a barrier to further upside movement within the context of the overall bearish trend.
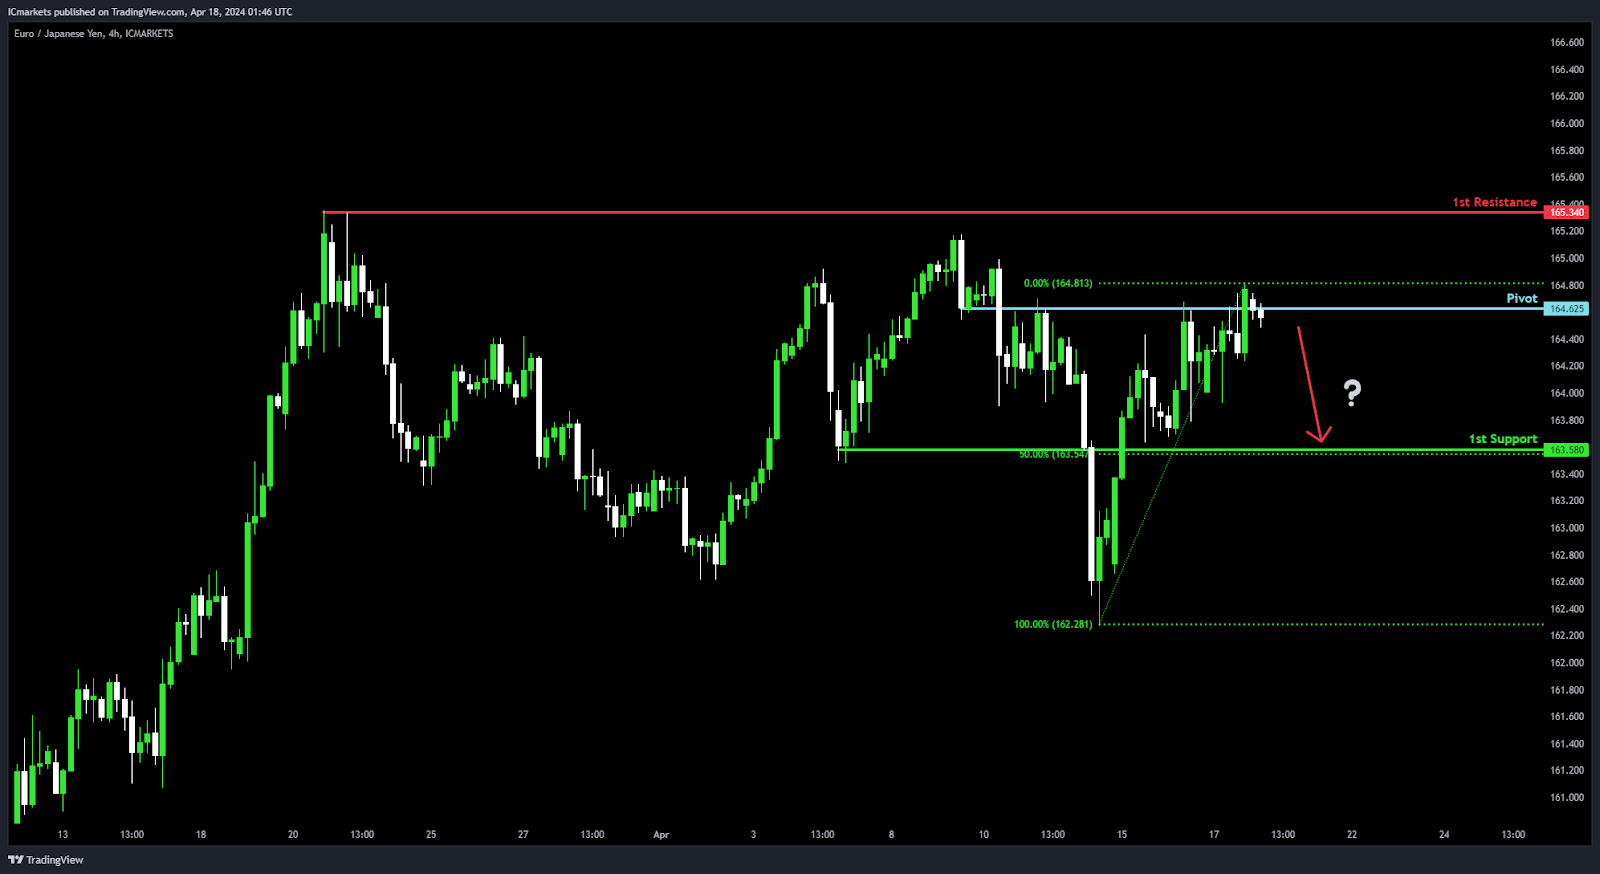
EUR/JPY:
Potential Direction: Bearish
Overall momentum of the chart: Bearish
Price could potentially make a: Bearish reaction off pivot and drop to 1st support
Pivot: 164.62
Supporting reasons: An Overlap resistance, indicating a significant level where selling pressure might intensify, potentially leading to a continuation of the bearish trend.
1st support: 163.58
Supporting reasons: Pullback support with a 50% Fibonacci Retracement, suggesting a level where buyers might step in to support the price, potentially providing a foundation for a minor rebound within the context of the overall bearish momentum.
1st resistance: 165.34
Supporting reasons: Swing high resistance, representing a level where selling pressure might increase, potentially acting as a barrier to further upside movement within the context of the overall bearish trend.
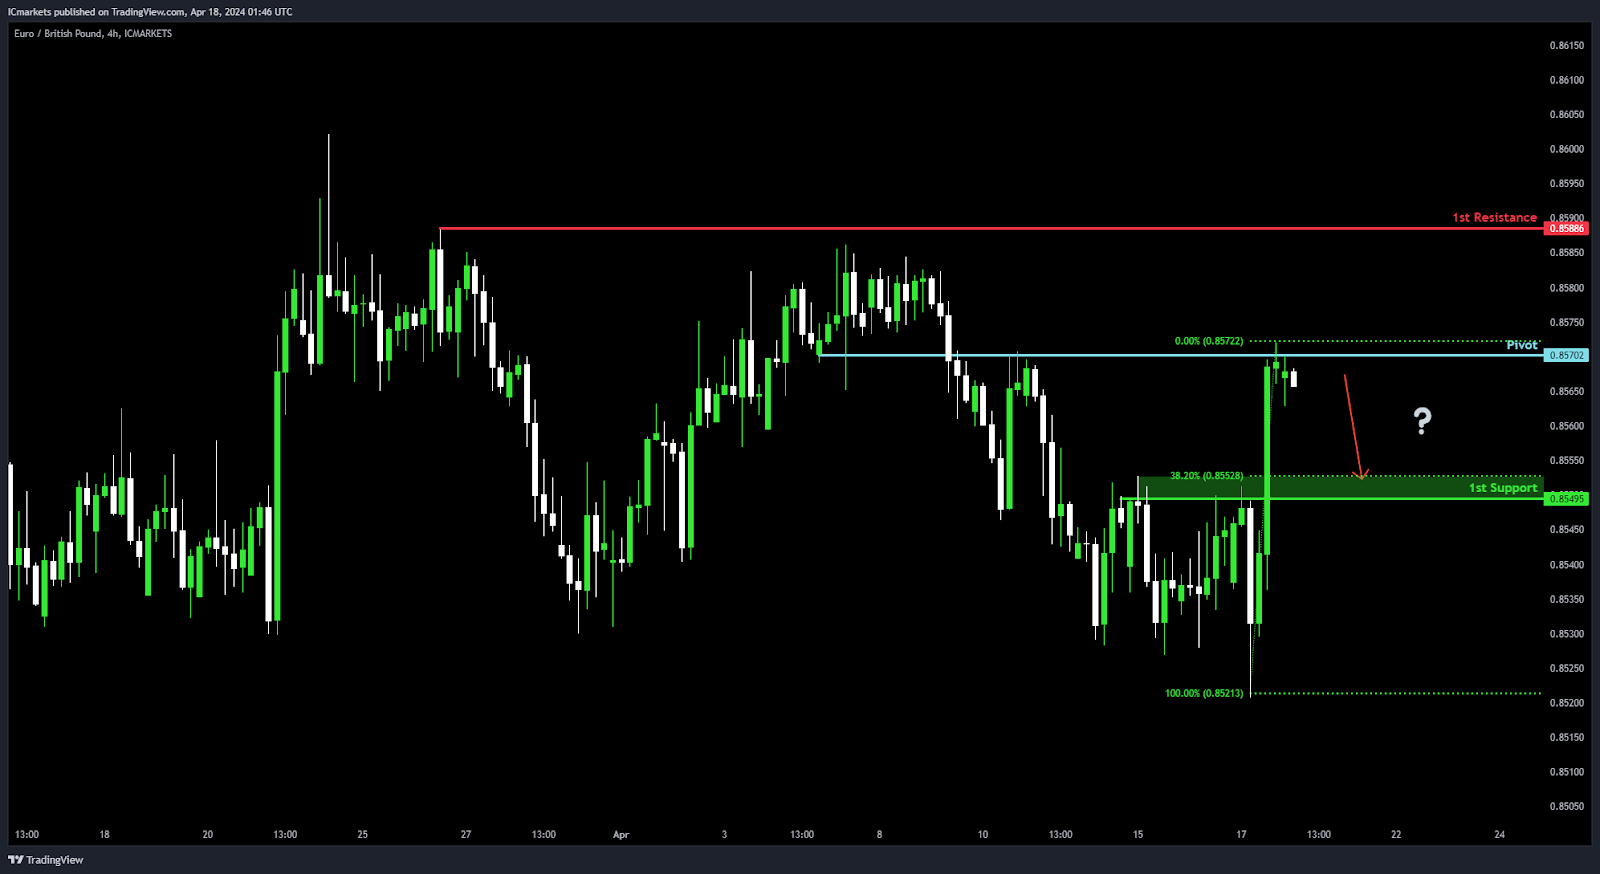
EUR/GBP:
Potential Direction: Bearish
Overall momentum of the chart: Bearish
Price could potentially make a: Bearish reaction off pivot and drop to 1st support
Pivot: 0.8570
Supporting reasons: An Overlap resistance, indicating a significant level where selling pressure might intensify, potentially leading to a continuation of the bearish trend.
1st support: 0.8549
Supporting reasons: Pullback support with a 38.20% Fibonacci Retracement, suggesting a level where buyers might step in to support the price, potentially providing a foundation for a minor rebound within the context of the overall bearish momentum.
1st resistance: 0.8588
Supporting reasons: Swing high resistance, representing a level where selling pressure might increase, potentially acting as a barrier to further upside movement within the context of the overall bearish trend.
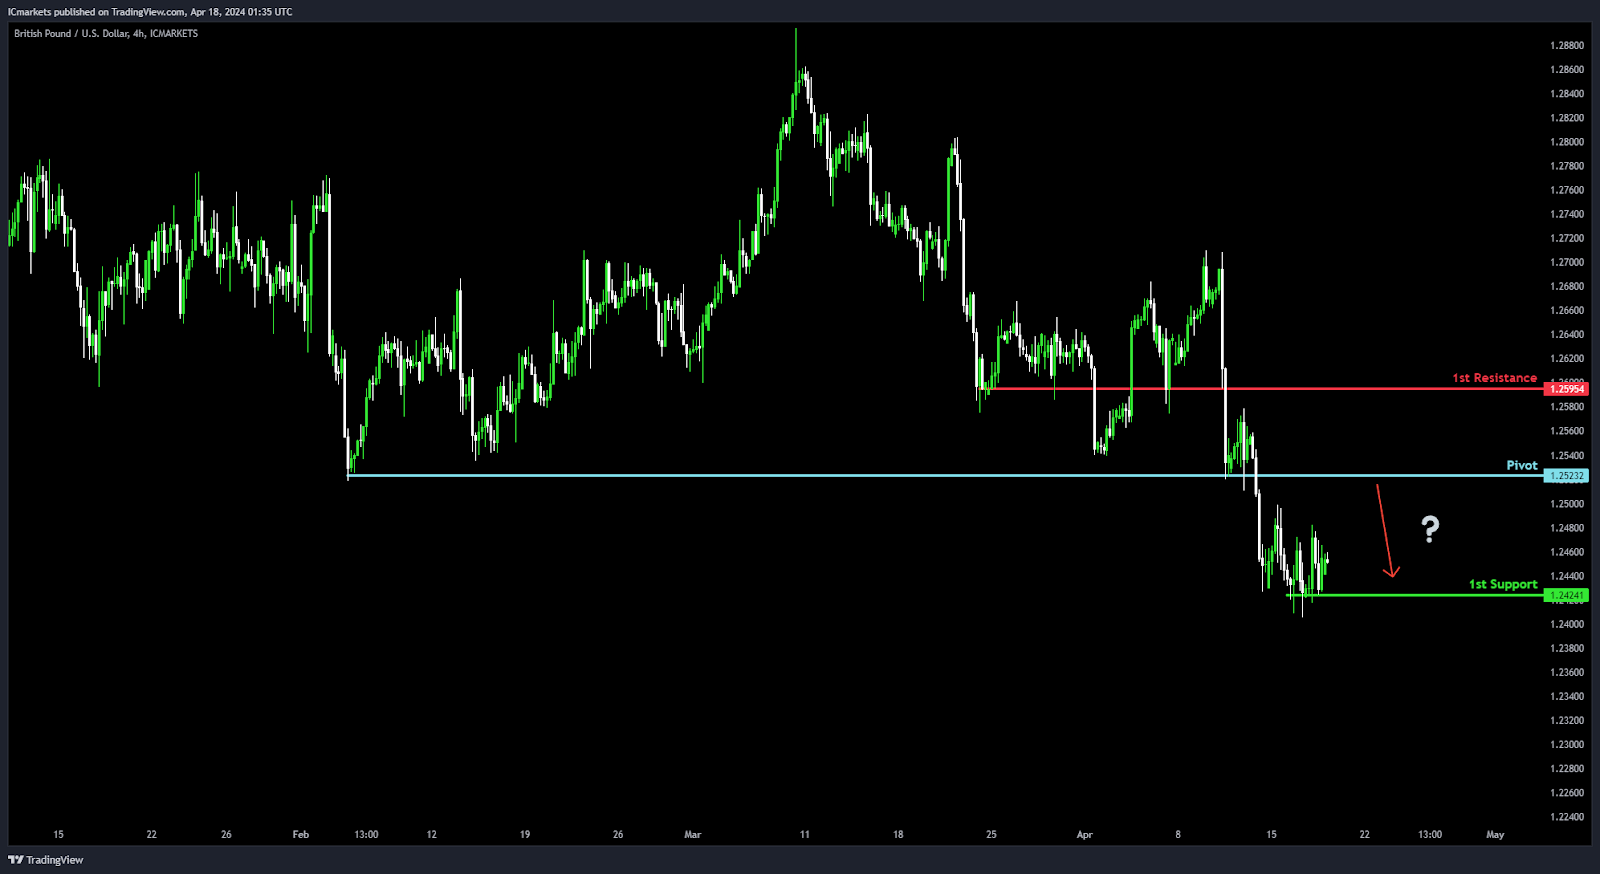
GBP/USD:
Potential Direction: Bearish
Overall momentum of the chart: Bearish
Price could potentially make a: Bearish reaction off pivot and drop to 1st support
Pivot: 1.2523
Supporting reasons: Pullback resistance, indicating a significant level where selling pressure might intensify, potentially leading to a continuation of the bearish trend.
1st support: 1.2424
Supporting reasons: Multi-swing low support, suggesting a level where buyers might step in to support the price, potentially providing a foundation for a minor rebound within the context of the overall bearish momentum.
1st resistance: 1.2595
Supporting reasons: Pullback resistance, representing a level where selling pressure might increase, potentially acting as a barrier to further upside movement within the context of the overall bearish trend.
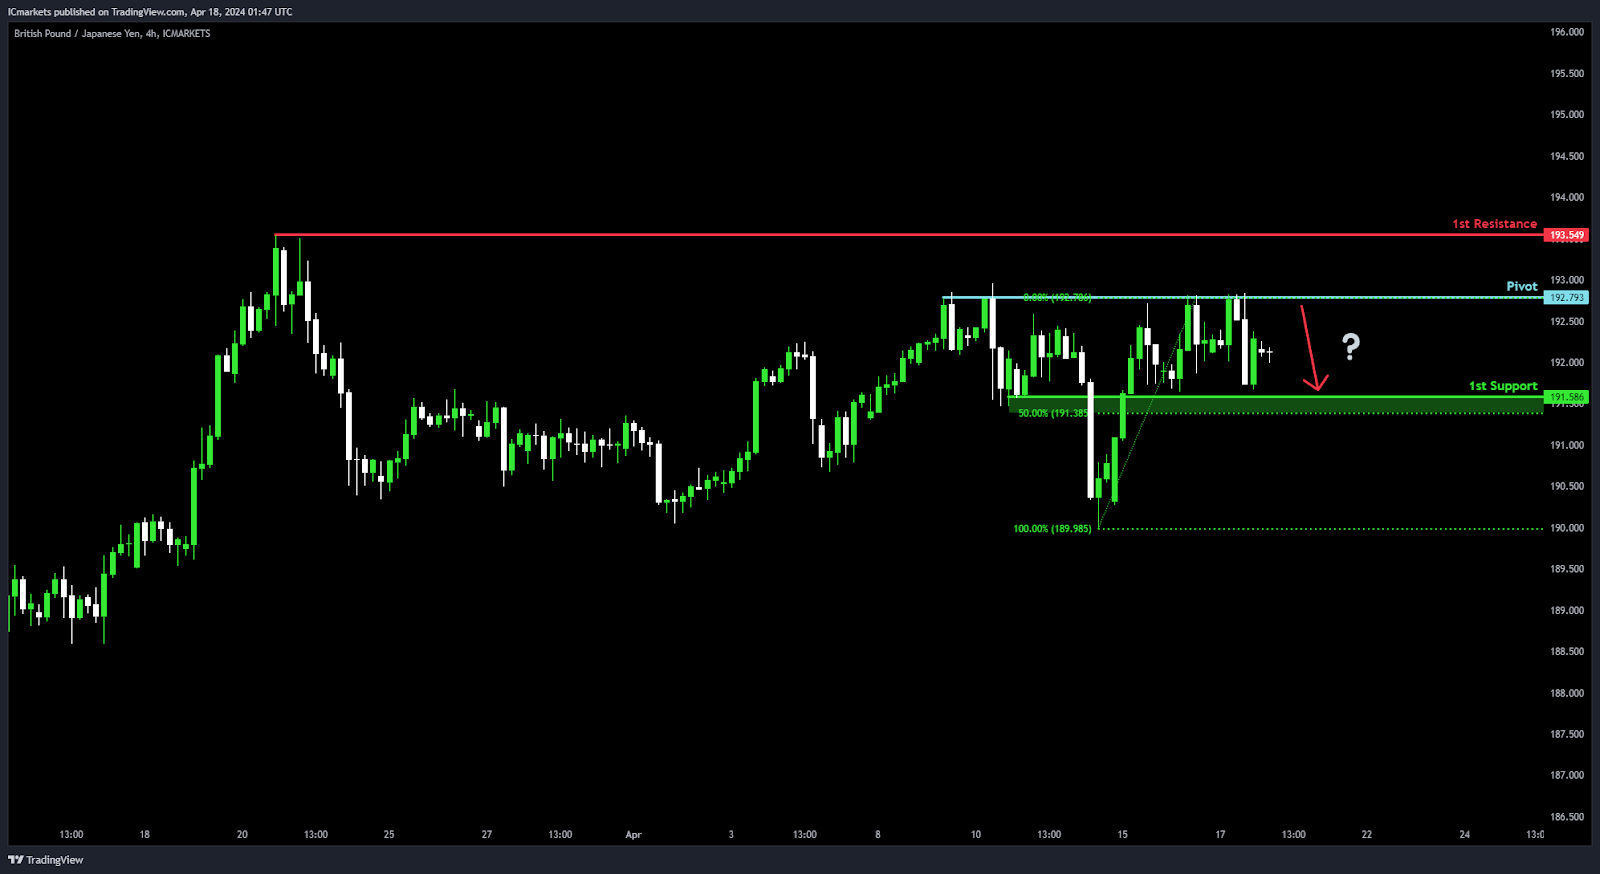
GBP/JPY:
Potential Direction: Bearish
Overall momentum of the chart: Bearish
Price could potentially make a: Bearish continuation towards 1st support
Pivot: 192.79
Supporting reasons: Multi-swing high resistance, indicating a significant level where selling pressure might intensify, potentially leading to a continuation of the bearish trend.
1st support: 191.58
Supporting reasons: An Overlap support, suggesting a level where buyers might step in to support the price, potentially providing a foundation for a minor rebound within the context of the overall bearish momentum.
1st resistance: 193.54
Supporting reasons: Swing high resistance, representing a level where selling pressure might increase, potentially acting as a barrier to further upside movement within the context of the overall bearish trend.
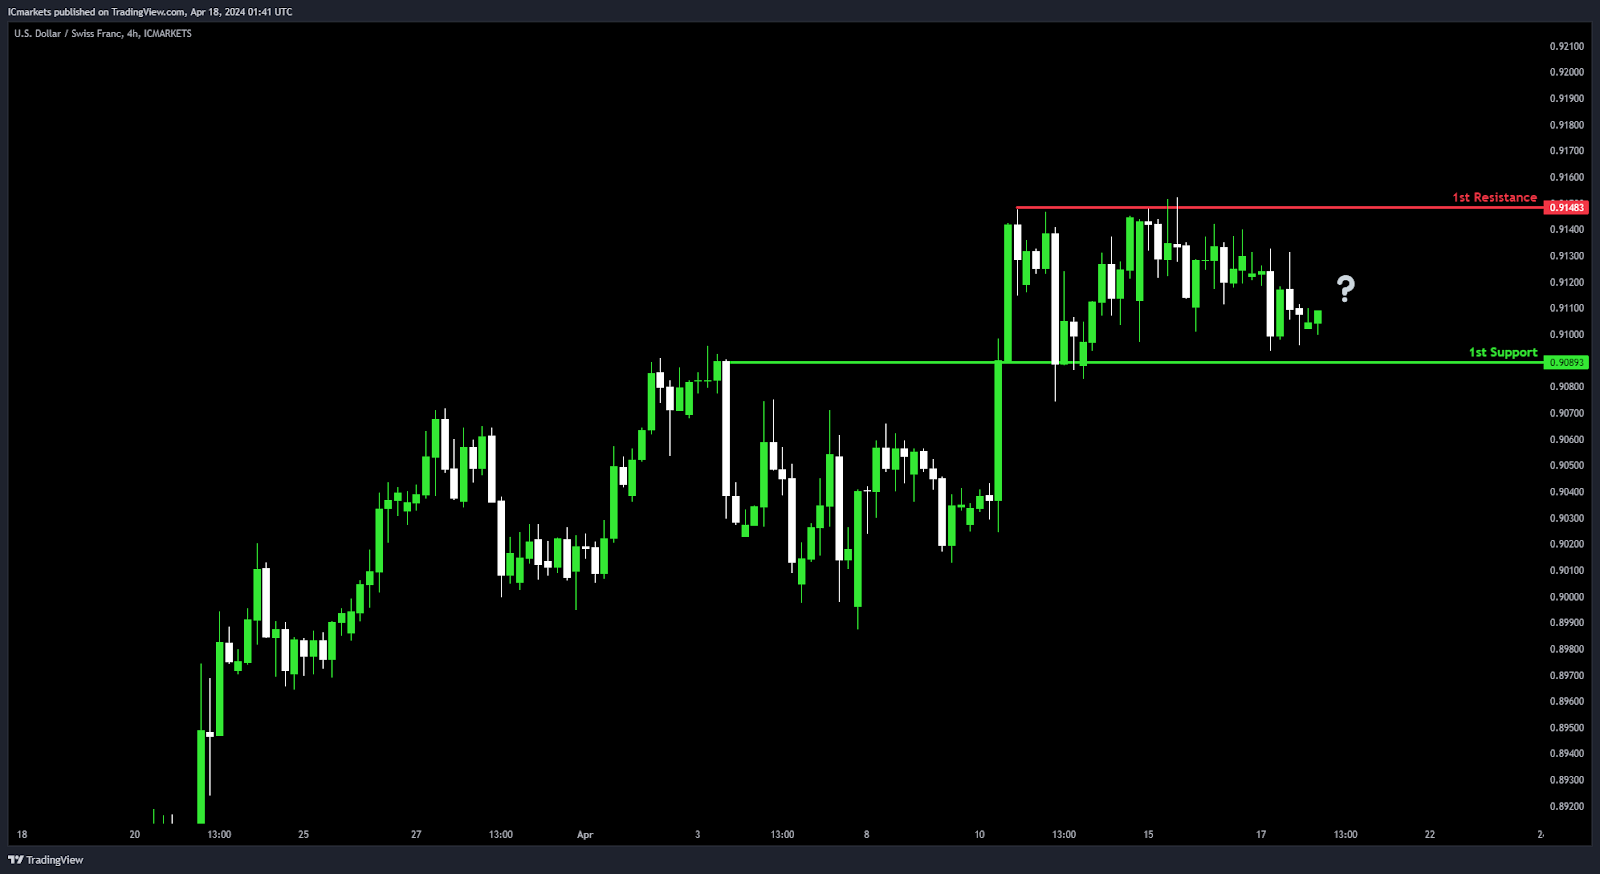
USD/CHF:
Potential Direction: Neutral
Overall momentum of the chart: Bullish
Price could potentially make a: Fluctuate between the 1st resistance and 1st support level.
1st support: 0.9089
Supporting reasons: An Overlap support, indicating a significant level where buyers might step in to support the price, potentially providing a foundation for a bounce or temporary halt in the bullish momentum.
1st resistance: 0.9148
Supporting reasons: Multi-swing high resistance, representing a level where selling pressure might intensify, potentially acting as a barrier to further upside movement within the context of the overall bullish trend.
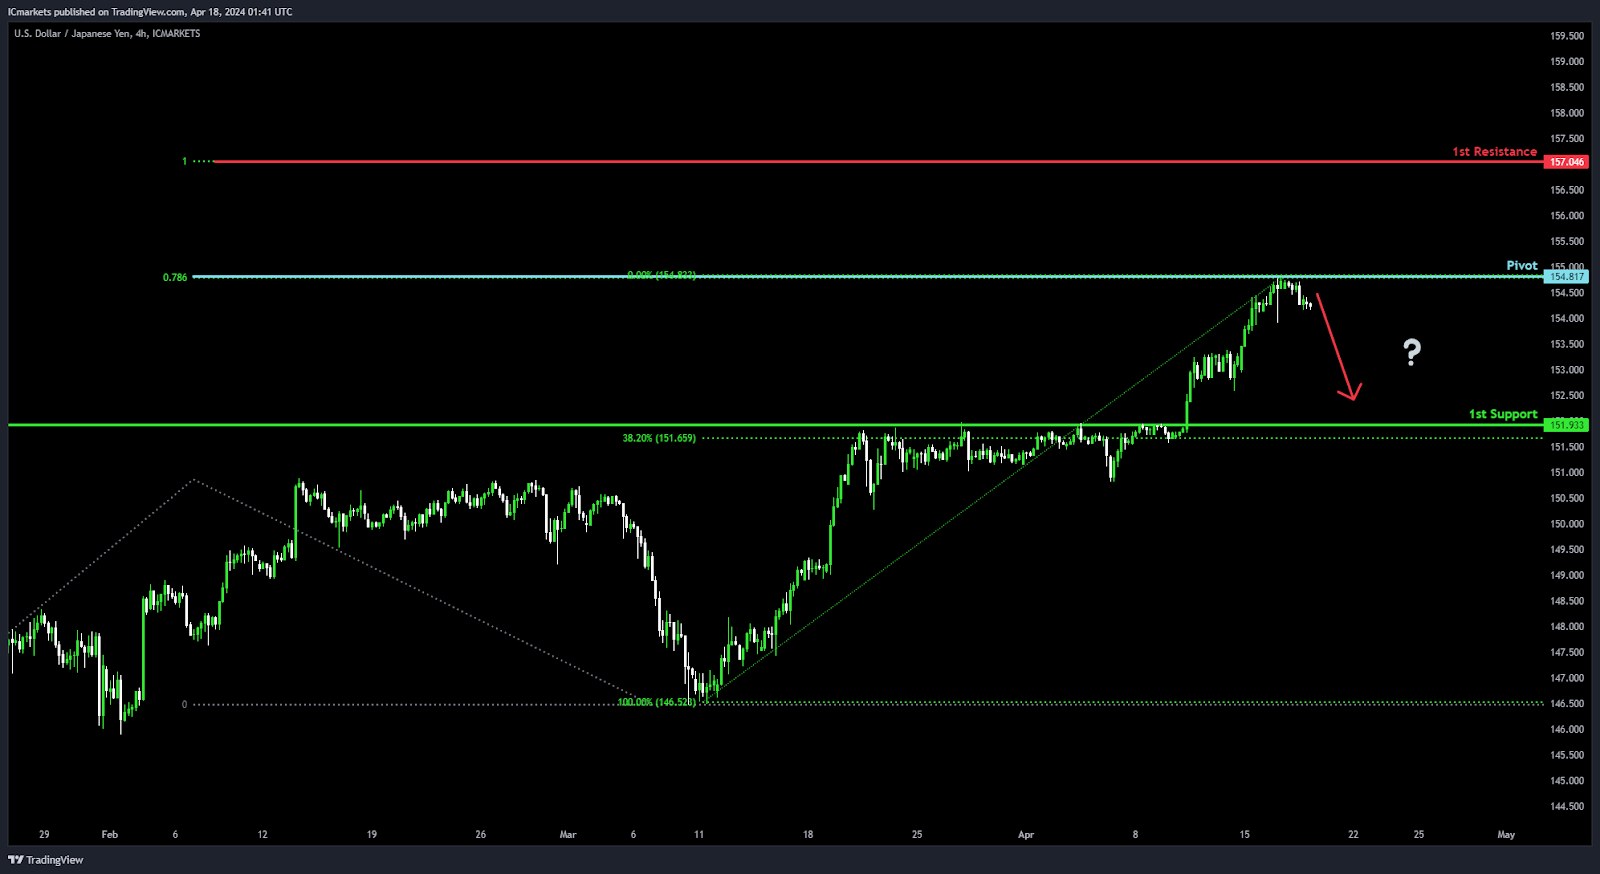
USD/JPY:
Potential Direction: Bearish
Overall momentum of the chart: Bullish
Price could potentially make a: Bearish continuation towards 1st support
PIvot: 154.81
Supporting reasons: 78.60% Fibonacci Projection, indicating a significant level where selling pressure might intensify, potentially leading to a continuation of the bearish trend.
1st support: 151.93
Supporting reasons: Pullback support, suggesting a level where buyers might step in to support the price, potentially providing a foundation for a minor rebound within the context of the overall bullish momentum.
1st resistance: 157.04
Supporting reasons: 100% Fibonacci Projection, representing a level where selling pressure might increase, potentially acting as a barrier to further upside movement within the context of the overall bullish trend.
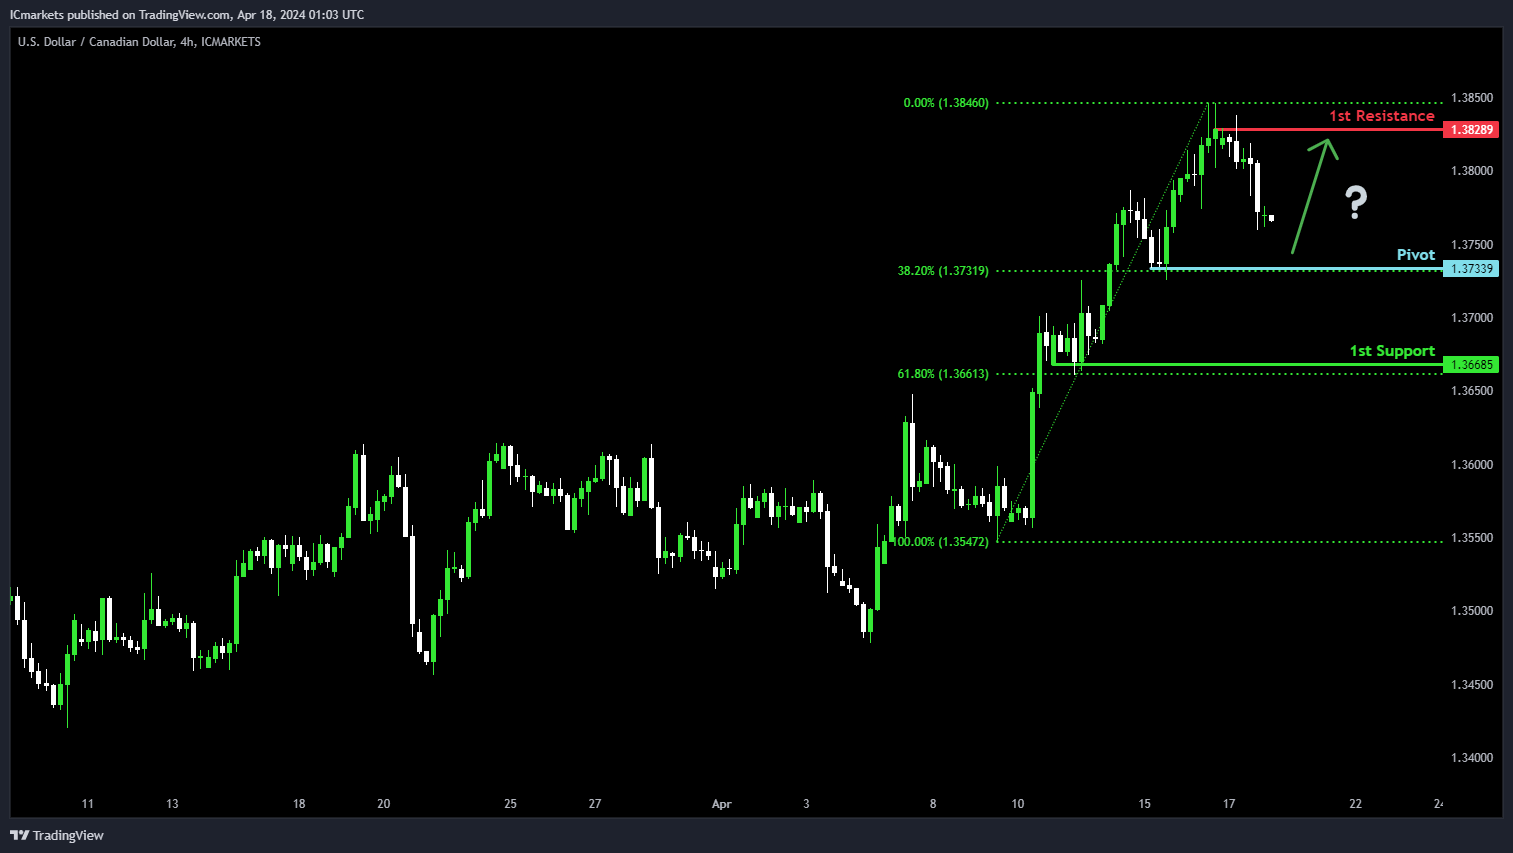
USD/CAD:
Potential Direction: Bearish
Overall momentum of the chart: Bullish
Price could fall towards the pivot and potentially make a bullish reaction off this level to rise toward the 1st resistance to resume the uptrend
Pivot: 1.3733
Supporting reasons: Acts as a pullback support that aligns with a 38.2% Fibonacci retracement level, where price has previously found strong support.
1st support: 1.3668
Supporting reasons: Identified as a pullback support that aligns with a 61.8% Fibonacci retracement level, suggesting an area where price could find strong buying interest to provide a foundation for potential price stabilization.
1st resistance: 1.3828
Supporting reasons: Identified as a pullback resistance, marking a significant barrier that could cap further upward movements.
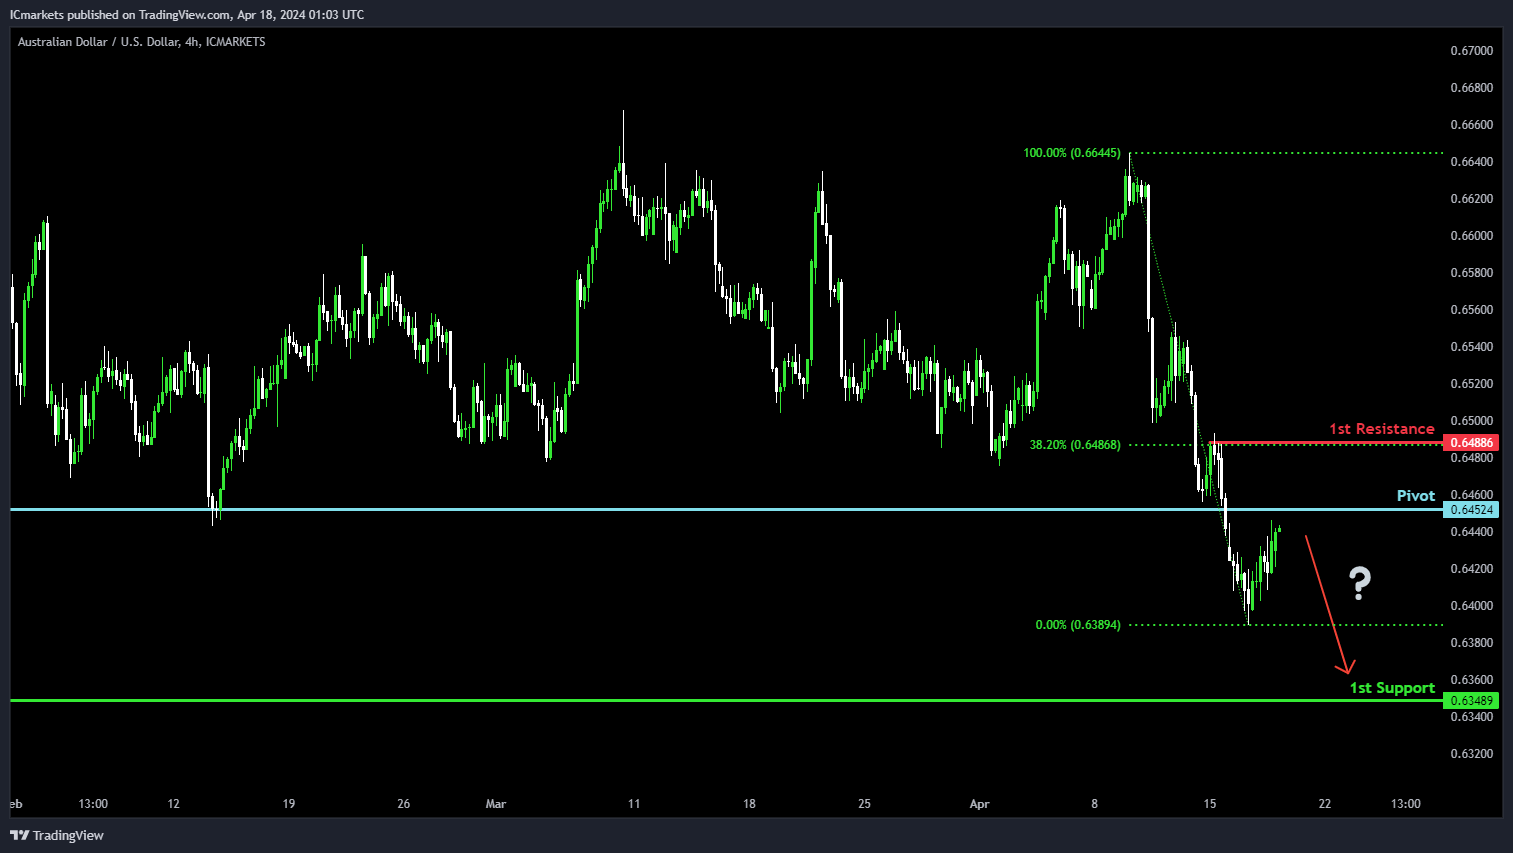
AUD/USD:
Potential Direction: Bearish
Overall momentum of the chart: Bearish
Price could rise towards the pivot and potentially make a bearish reaction off this level to drop towards the 1st support
Pivot: 0.6452
Supporting reasons: Acts as a pullback resistance where price could stall around this level before resuming the downtrend.
1st support: 0.6348
Supporting reasons: Acts as a swing-low support, suggesting a significant area where price has previously found strong support and could provide a basis to halt further downward movement.
1st resistance: 0.6488
Supporting reasons: Identified as a pullback resistance that aligns with a 38.2% Fibonacci retracement level, marking a barrier that has previously capped upward movements.
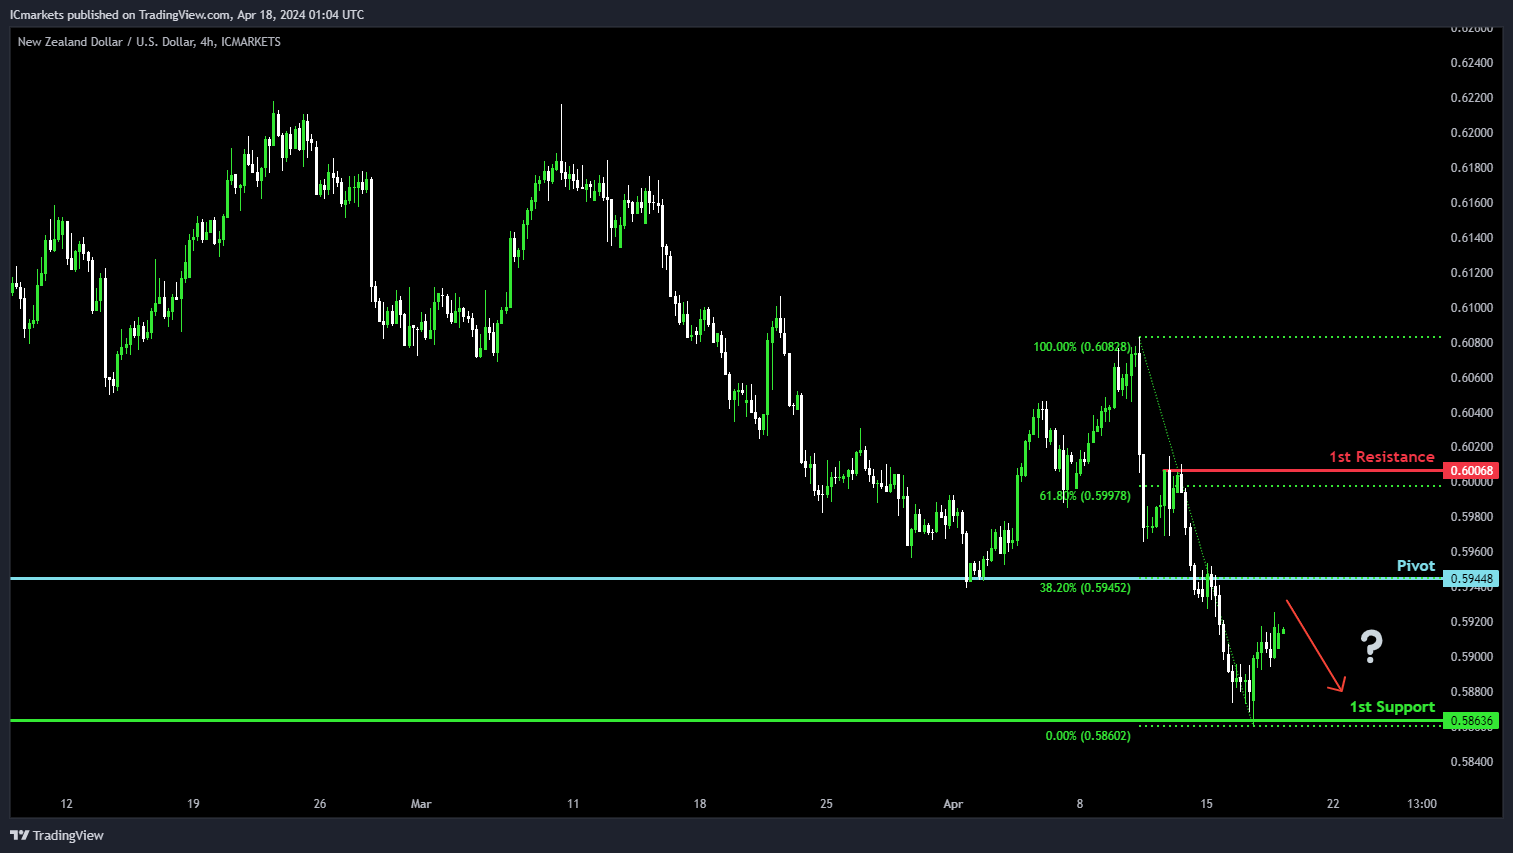
NZD/USD
Potential Direction: Bearish
Overall momentum of the chart: Bearish
Price could rise towards the pivot and potentially make a bearish reaction off this level to drop towards the 1st support
Pivot: 0.5944
Supporting reasons: Acts as an overlap resistance that aligns with a 38.2% Fibonacci retracement level, highlighting a significant area where price has previously ran out of steam around this zone.
1st support: 0.5863
Supporting reasons: Acts as a pullback support, suggesting a potential area for price stabilization or a minor rebound within the bearish context.
1st resistance: 0.6006
Supporting reasons: Identified as a pullback resistance that aligns close to a 61.8% Fibonacci retracement level, marking a barrier that has previously capped upward movements.
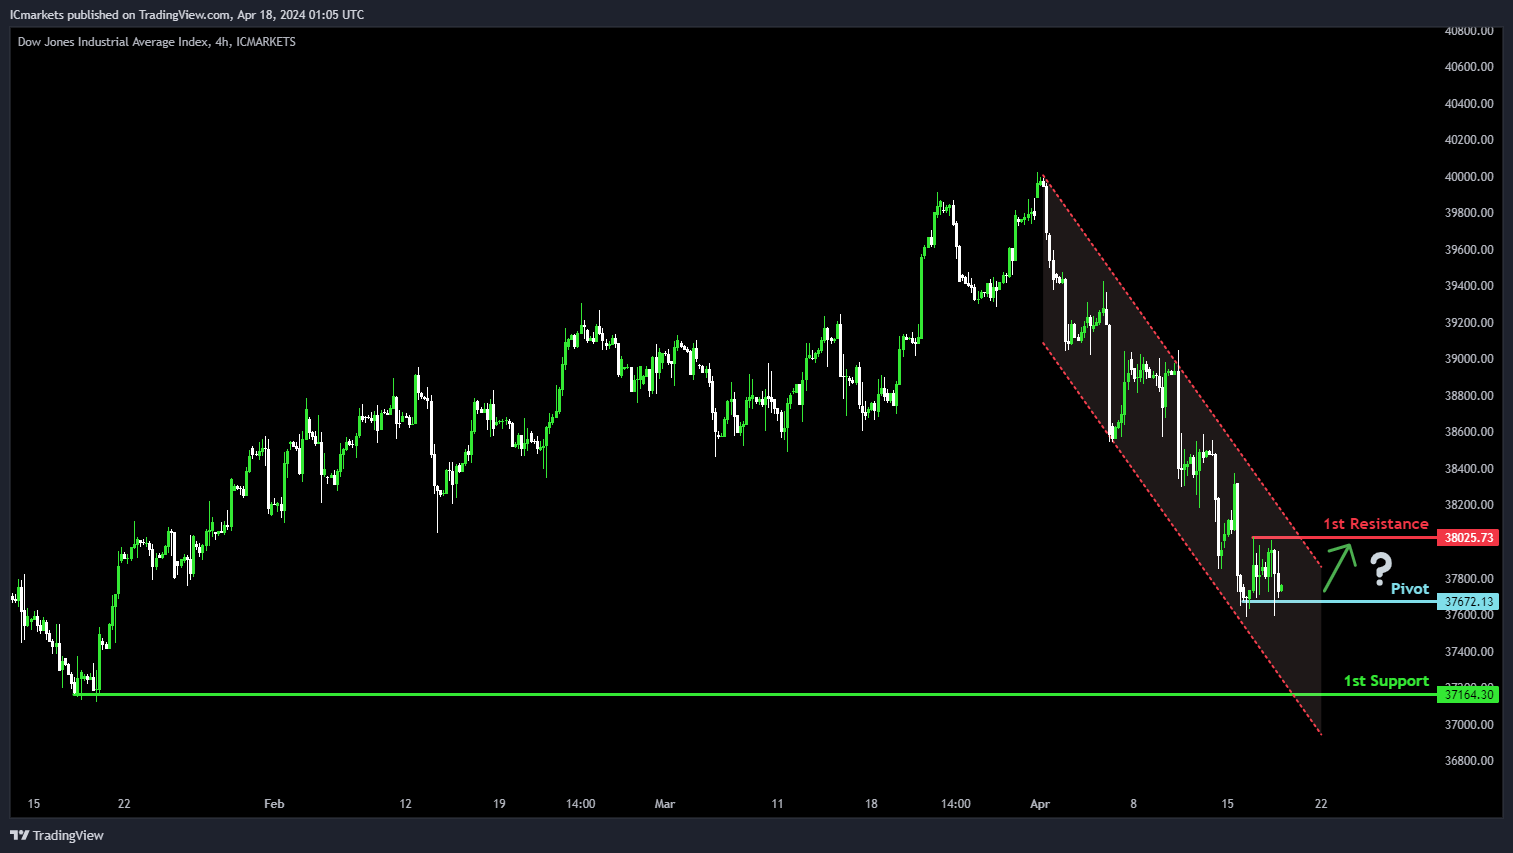
US30 (DJIA):
Potential Direction: Bullish
Overall momentum of the chart: Bearish
Price has made a bullish reaction off the pivot and could potentially rise towards the 1st resistance
Pivot: 37,672.13
Supporting reasons: Acts as a pullback support where buying interest has increased recently.
1st support: 37,164.30
Supporting reasons: Identified as a pullback support, suggesting a significant area where price has previously found strong buying interest and could provide a solid foundation to halt further downward movement.
1st resistance: 38,025.73
Supporting reasons: Identified as a pullback resistance, indicating a potential barrier that could cap any upward movements.
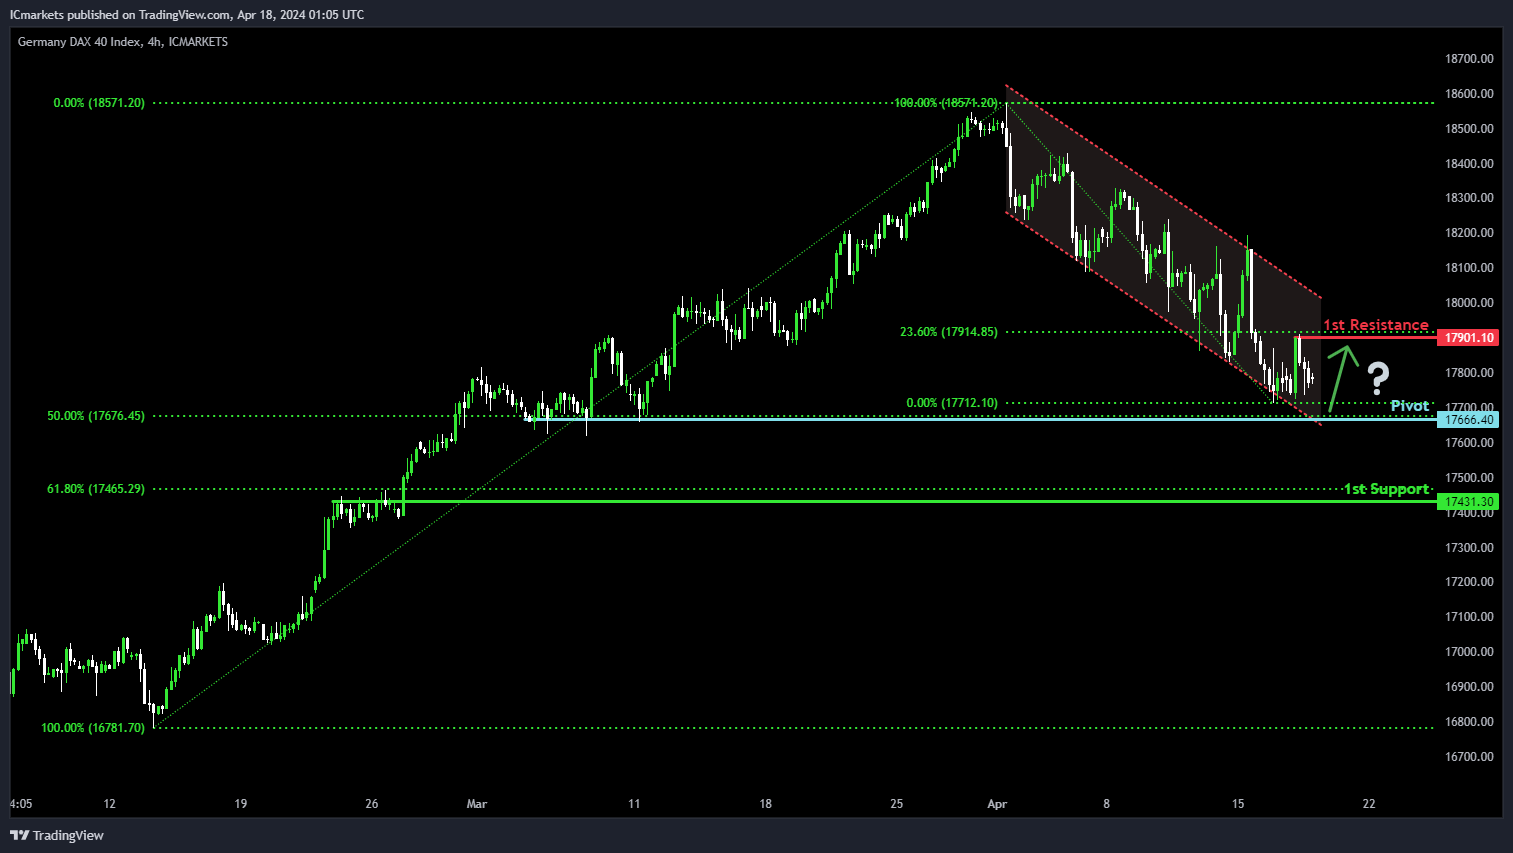
DE40 (DAX):
Potential Direction: Bullish
Overall momentum of the chart: Bearish
Price could make a weak bullish reaction off the pivot and potentially rise towards the 1st resistance before resuming the longer-term downtrend
Pivot: 17,666.40
Supporting reasons: Acts as a pullback support that aligns with a 50% Fibonacci retracement level, suggesting a level where buying interest has increased in recent weeks.
1st support: 17,431.30
Supporting reasons: Acts as a pullback support that aligns with a 61.8% Fibonacci retracement level, suggesting a significant area where price has previously found strong buying interest and could provide a solid foundation to halt further downward movement.
1st resistance: 17,901.10
Supporting reasons: Identified as a pullback resistance that aligns with 23.6% Fibonacci retracement level, potentially functioning as a barrier that could cap any upward movements.
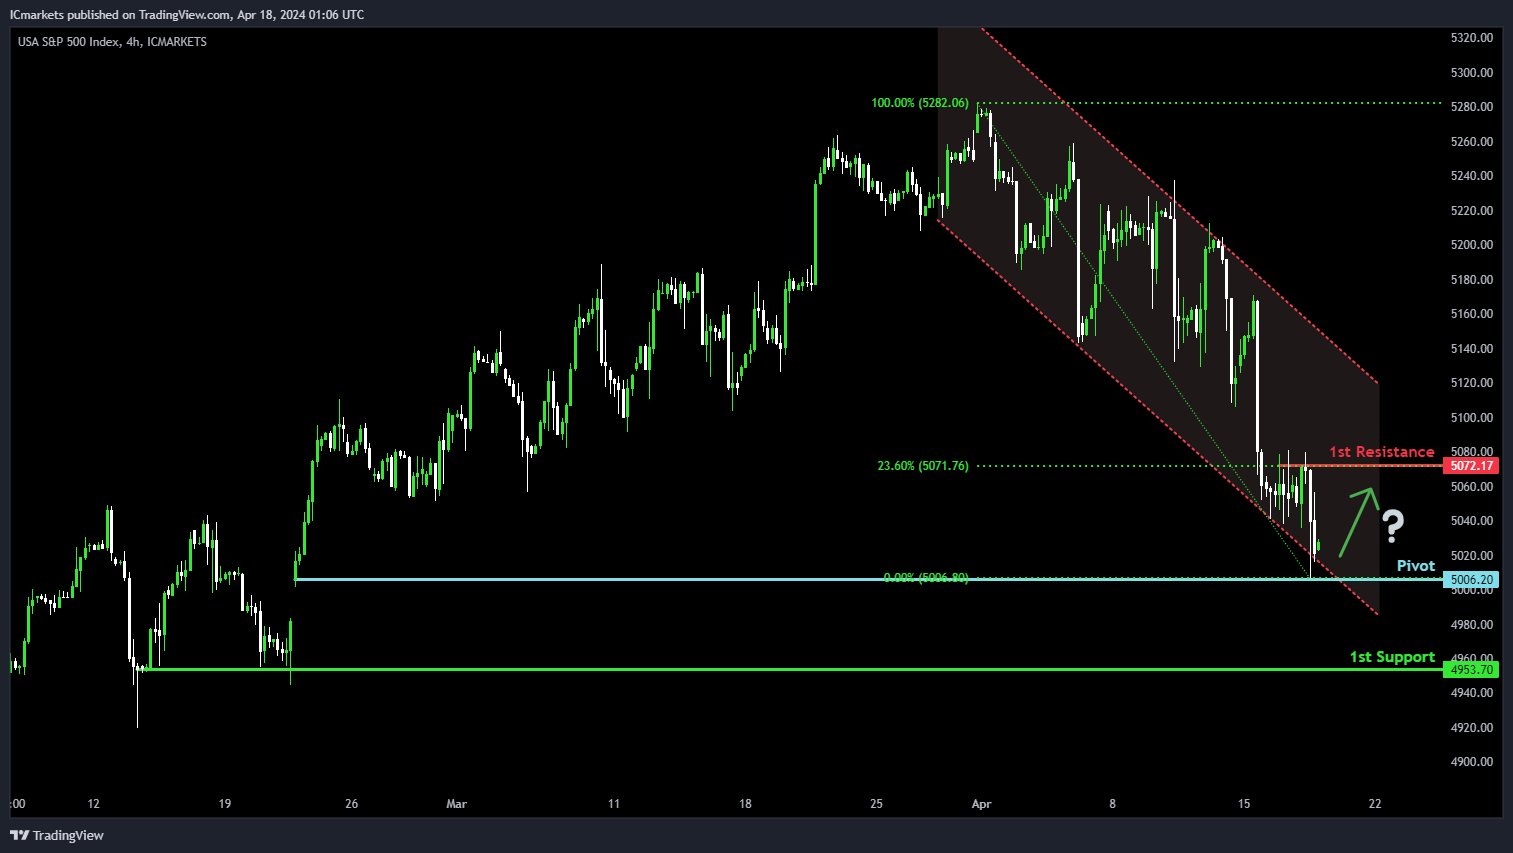
US500 (S&P 500):
Potential Direction: Bullish
Overall momentum of the chart: Bearish
Price could make a weak bullish reaction off the pivot and potentially rise towards the 1st resistance before resuming the longer-term downtrend
Pivot: 5,006.20
Supporting reasons: Acts as a pullback support where buying interest has increased in recent weeks.
1st support: 4,953.70
Supporting reasons: Acts as a pullback support suggesting a significant area where price has previously found strong buying interest, providing a solid foundation to halt further downward movement.
1st resistance: 5,072.17
Supporting reasons: Marked by a pullback resistance that aligns with 23.6% Fibonacci retracement level, which could function as a potential barrier and cap any upward movements.
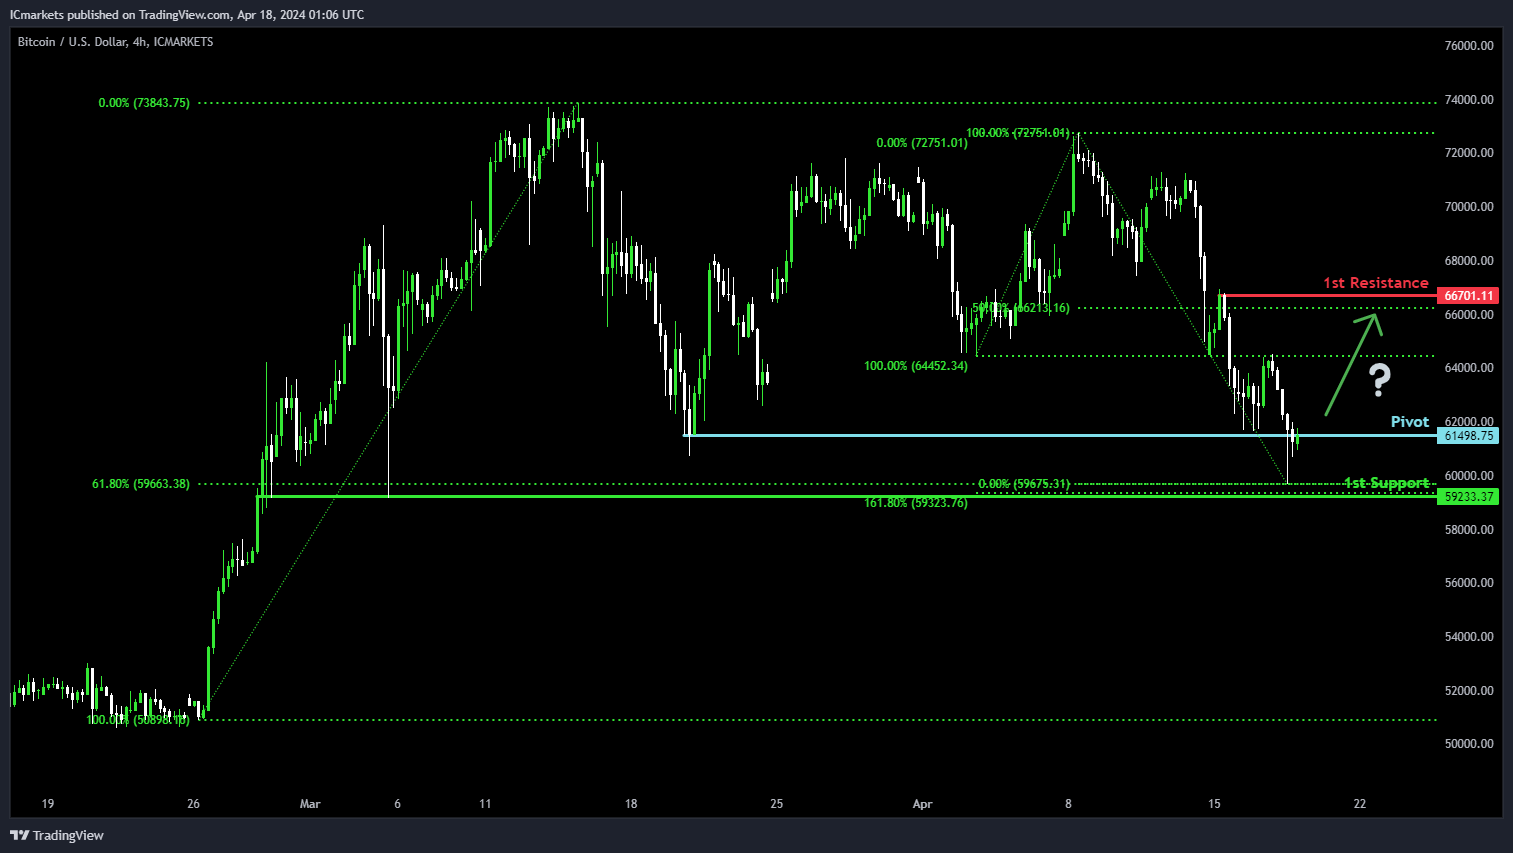
BTC/USD (Bitcoin):
Potential Direction: Bullish
Overall momentum of the chart: Neutral
Price has made a bullish reaction off the pivot and could potentially rise towards the 1st resistance
Pivot: 61,498.75
Supporting reasons: Acts as a pullback support where price has reversed strongly in the past to rise higher.
1st support: 59,233.37
Supporting reasons: Acts as a pullback support that aligns close to the 61.8% Fibonacci retracement and the 161.8% Fibonacci extension levels, suggesting a significant area where price has previously found strong buying interest and could provide a solid foundation for potential price stabilization or a rebound.
1st resistance: 66,701.11
Supporting reasons: Marked by a pullback resistance that aligns close to a 50% Fibonacci retracement, indicating a significant barrier that could cap further upward movements.
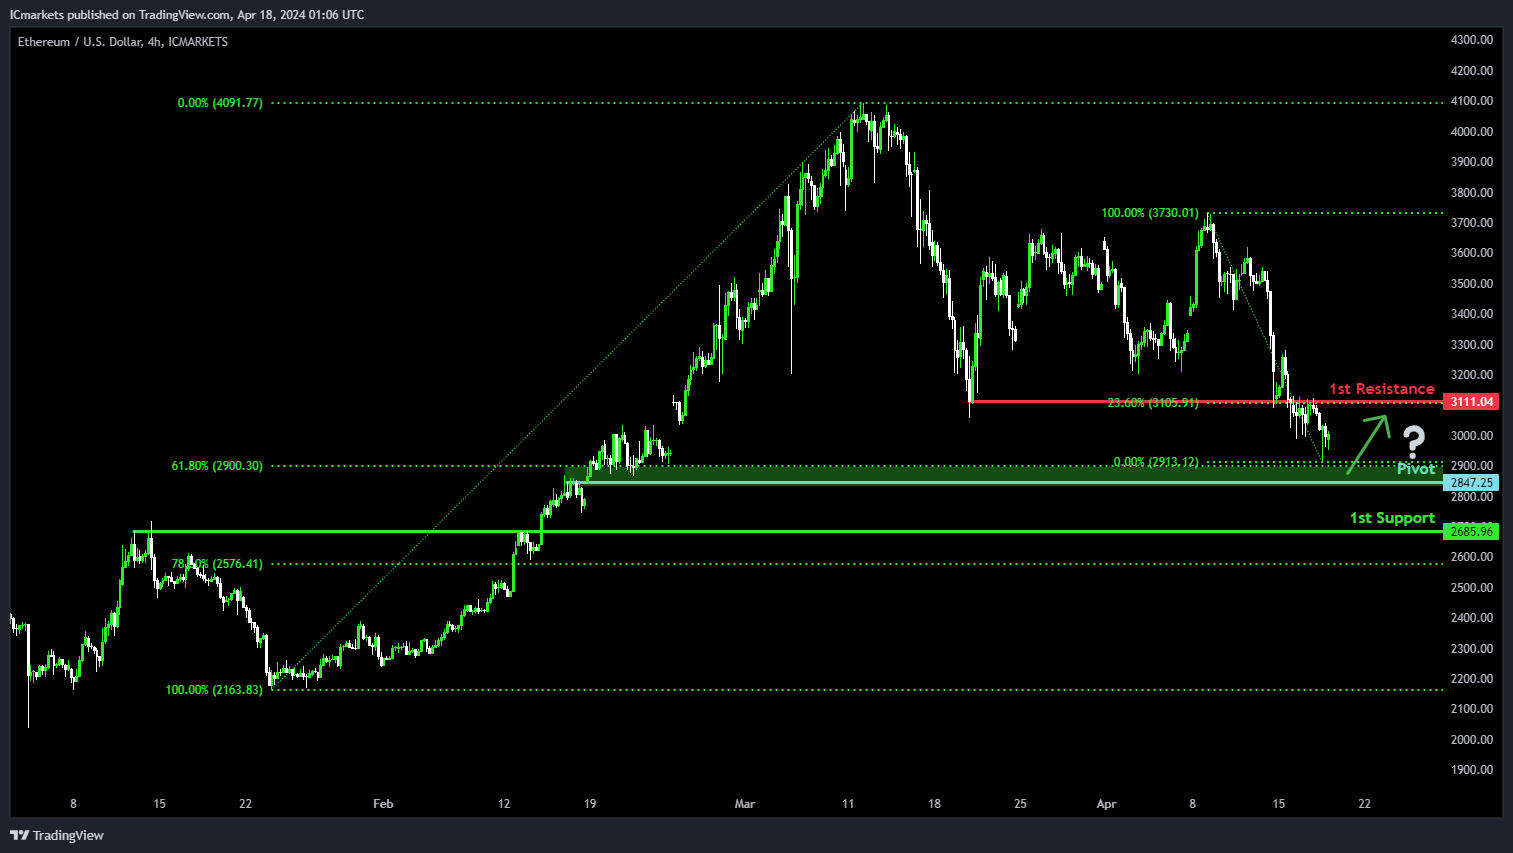
ETH/USD (Ethereum):
Potential Direction: Bullish
Overall momentum of the chart: Neutral
Price has made a weak bullish reaction off the pivot and could potentially rise towards the 1st resistance
Pivot: 2,847.25
Supporting reasons: Identified as an overlap support that aligns close to a 61.8% Fibonacci retracement level suggesting a significant area where price has previously found support, providing a strong foundation for a potential rebound.
1st support: 2,685.96
Supporting reasons: Identified as an overlap support that aligns close to a 78.6% Fibonacci retracement level suggesting a significant area where price has previously found support, providing a strong foundation to halt further downward movements.
1st resistance: 3,111.04
Supporting reasons: Identified as an overlap resistance that aligns with a 23.6% Fibonacci retracement level, marking a significant barrier that could cap further upward movements.
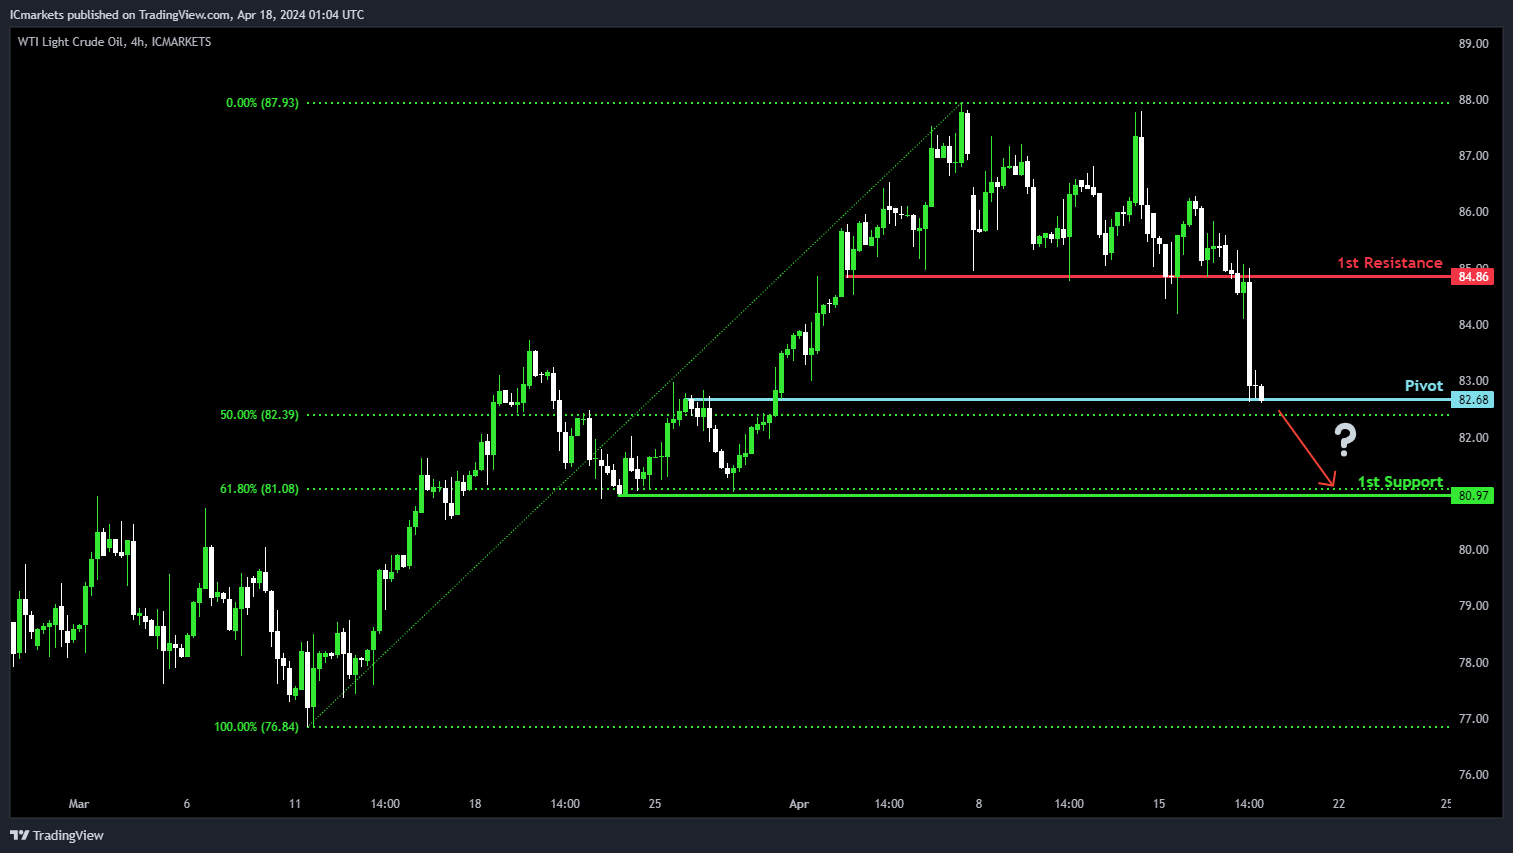
WTI/USD (Oil):
Potential Direction: Bearish
Overall momentum of the chart: Bearish
Price could make a bearish reaction off the pivot and potentially fall towards the 1st support
Pivot: 82.68
Supporting reasons: Marked by a pullback support that aligns close to a 50% Fibonacci retracement level, where price could break under due to the strong bearish momentum.
1st support: 80.97
Supporting reasons: Identified as a pullback support that aligns with a 61.8% Fibonacci retracement level, suggesting a significant area where price has previously found strong buying interest and could provide a solid foundation to halt further downward movements.
1st resistance: 84.86
Supporting reasons: Identified as an overlap resistance, marking a significant barrier that could cap further upward movements.
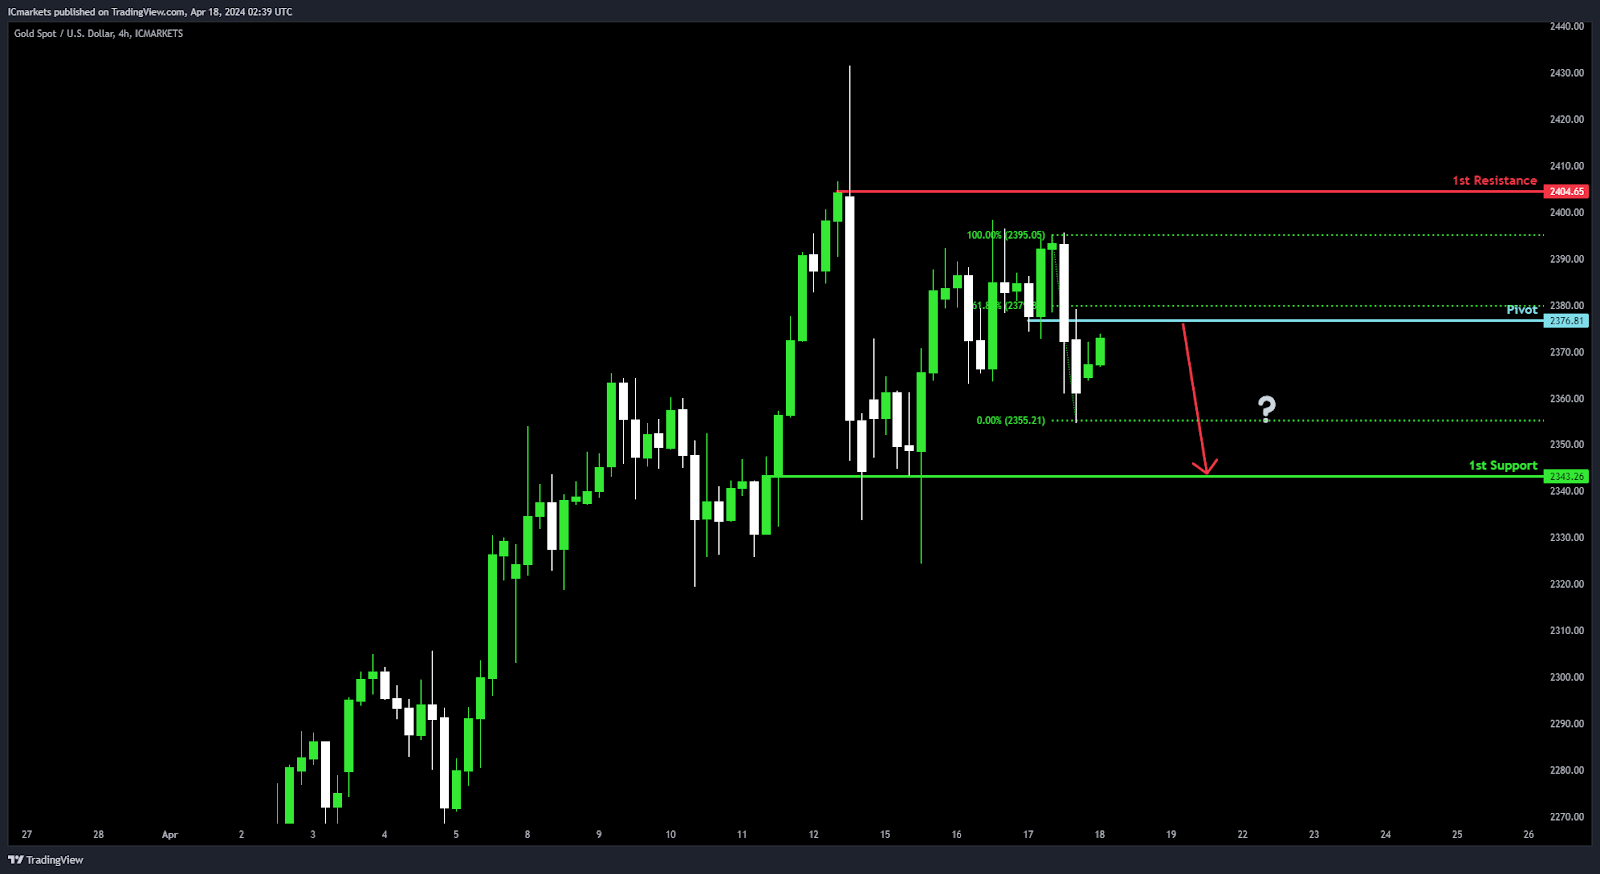
XAU/USD (GOLD):
Potential Direction: Bearish
Overall momentum of the chart: Bullish
Price could potentially make a: Bearish reaction off pivot and drop to 1st support
Pivot: 2376.00
Supporting reasons: An Overlap resistance combined with a 61.80% Fibonacci Retracement, indicating a significant level where selling pressure might intensify, potentially leading to a reversal or temporary halt in the bullish momentum.
1st support: 2343.26
Supporting reasons: An Overlap support, suggesting a level where buyers might step in to support the price, potentially providing a foundation for a bounce or temporary halt in the bearish momentum.
1st resistance: 2404.00
Supporting reasons: Swing high resistance, representing a level where selling pressure might increase, potentially acting as a barrier to further upside movement within the context of the overall bullish trend.
The accuracy, completeness and timeliness of the information contained on this site cannot be guaranteed. IC Markets does not warranty, guarantee or make any representations, or assume any liability regarding financial results based on the use of the information in the site.
News, views, opinions, recommendations and other information obtained from sources outside of www.icmarkets.com, used in this site are believed to be reliable, but we cannot guarantee their accuracy or completeness. All such information is subject to change at any time without notice. IC Markets assumes no responsibility for the content of any linked site.
The fact that such links may exist does not indicate approval or endorsement of any material contained on any linked site. IC Markets is not liable for any harm caused by the transmission, through accessing the services or information on this site, of a computer virus, or other computer code or programming device that might be used to access, delete, damage, disable, disrupt or otherwise impede in any manner, the operation of the site or of any user’s software, hardware, data or property.


