
Key risk events today:
Australia Employment Change and Unemployment Rate; UK Retail Sales m/m; BoE Credit Conditions Survey; Canada Manufacturing Sales m/m; Philly Fed Manufacturing Index; US Building Permits; US Industrial Production m/m; Crude Oil Inventories; FOMC Members Bowman, Evans and Williams Speak.
EUR/USD:
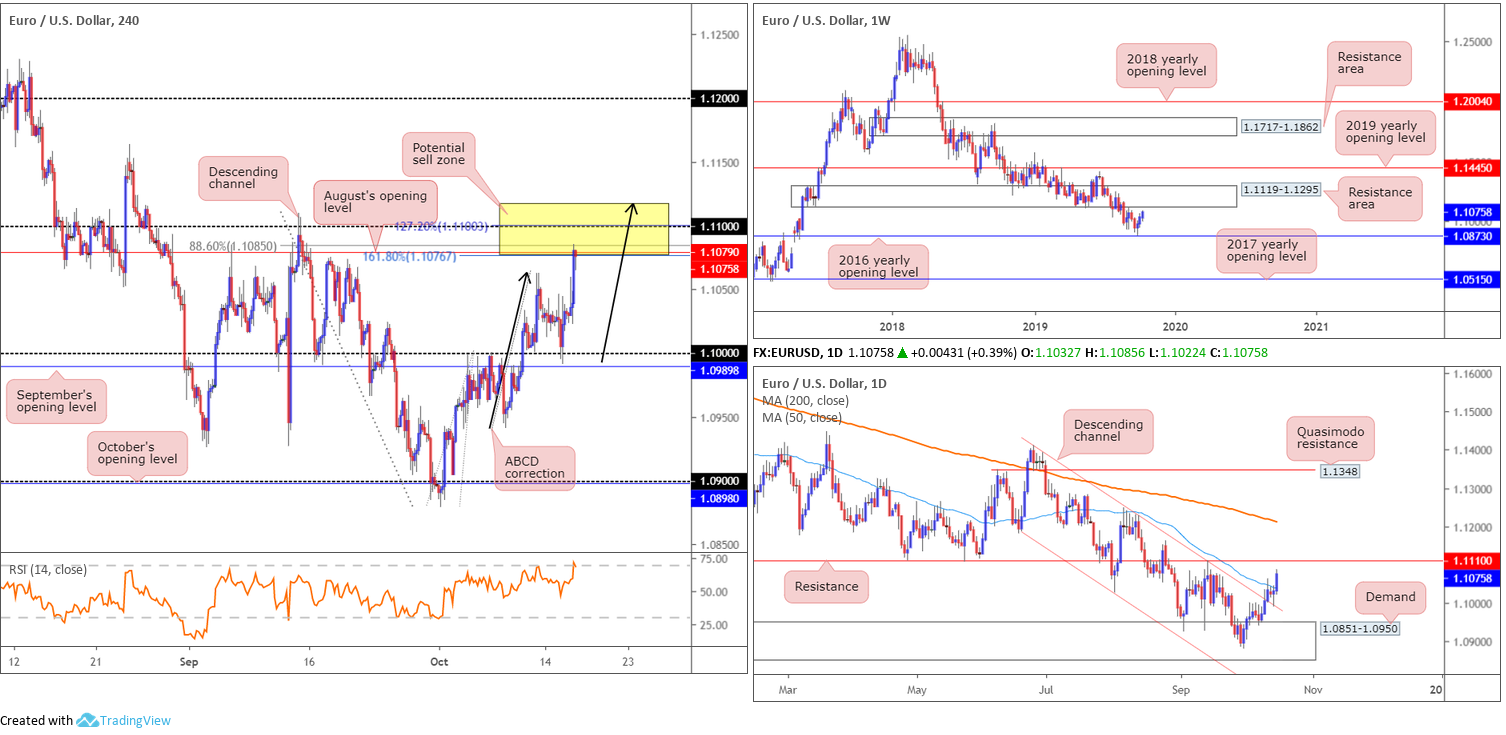
Thanks to sub-standard US retail sales and ongoing Brexit-related optimism, EUR/USD bulls continued to strengthen their grip Wednesday, adding more than 40 points and recording a second successive gain.
Brushing aside a 50-day SMA (blue – 1.1038) and last Friday’s high at 1.1062, the H4 candles recently crossed swords with a particularly interesting area of resistance (yellow) between 1.1119/1.1076 (comprised of August’s opening level at 1.1079 [aligns with a 161.8% Fibonacci extension at 1.1076], a 88.6% Fibonacci retracement ratio at 1.1085 [derived by taking the Golden Ratio, 0.618, square rooting it and square rooting it again to get 0.886], the 1.11 handle, a 127.2% Fibonacci extension point at 1.11, daily resistance at 1.1110 and the underside of a weekly resistance area at 1.1119-1.1295).
In addition to the above, the yellow zone contains a H4 ABCD correction point (black arrows) which terminates at the top edge of the area, and the relative strength index (RSI) is seen entering overbought territory.
Areas of consideration:
Outlook unchanged.
The H4 resistance area made up between 1.1119/1.1076, as underscored above, brings together several resistance points and, therefore, is central to today’s outlook. A H4 bearish candlestick rotation formed within the confines of the said resistance zone will likely be viewed as a strong sell signal by most price-action traders. Entry can be found at the close of the bearish candle formation, with a logical position for protective stop-loss orders falling in above 1.1119. In terms of downside targets, either the 50-day SMA or the 1.10 figure appear logical starting blocks.
GBP/USD:
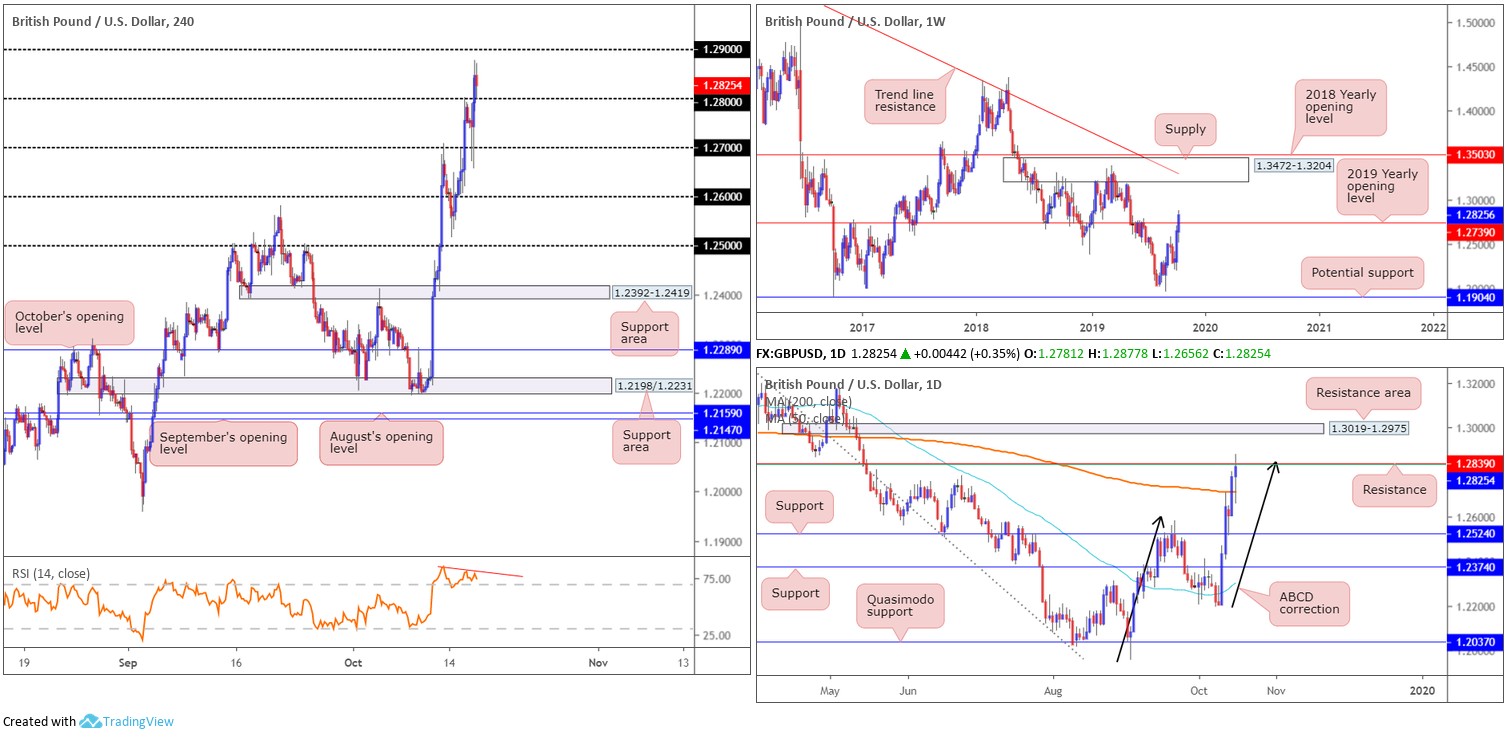
Brexit talks failed to reach a breakthrough amid a day of volatility on Wednesday, though concluded with the British pound eking out gains vs. its US counterpart.
Latest shows a break of 1.28 occurred, reaching highs at 1.2877, levels not seen since May this year. H4 movement has 1.29 highlighted as the next feasible resistance, and the relative strength index (RSI) is currently seen challenging overbought ground and pencilling in bearish divergence (red line).
Meanwhile, on the weekly timeframe, buyers continue to reinforce their position above the 2019 yearly opening level at 1.2739. Continued bidding could set the long-term stage for a push to supply at 1.3472-1.3204. Daily flow, driven by recent upside, shook hands with notable resistance at 1.2839. Note this level also brings with it an AB=CD correction point (black arrows) at 1.2850 and a 61.8% Fibonacci retracement ratio at 1.2835. A violation of this level, nonetheless, could lead to a test of a resistance area priced in at 1.3019-1.2975.
Areas of consideration:
In order to confirm seller intent off daily resistance mentioned above at 1.2839, an idea might be to wait for the H4 candles to reclaim 1.28 to the downside. Closing beneath this figure likely unbolts the door towards the 200-day SMA (orange – 1.2710), closely followed by 1.27. However, before reaching this far south, be aware that 1.2739 on the weekly timeframe might also form support. A short could be considered on the close of the H4 breakout candle, with a protective stop-loss order plotted above its upper shadow.
Longs in this market appear valid beyond the 1.29 handle, unveiling a reasonably clear run to the daily resistance area at 1.3019-1.2975.
AUD/USD:
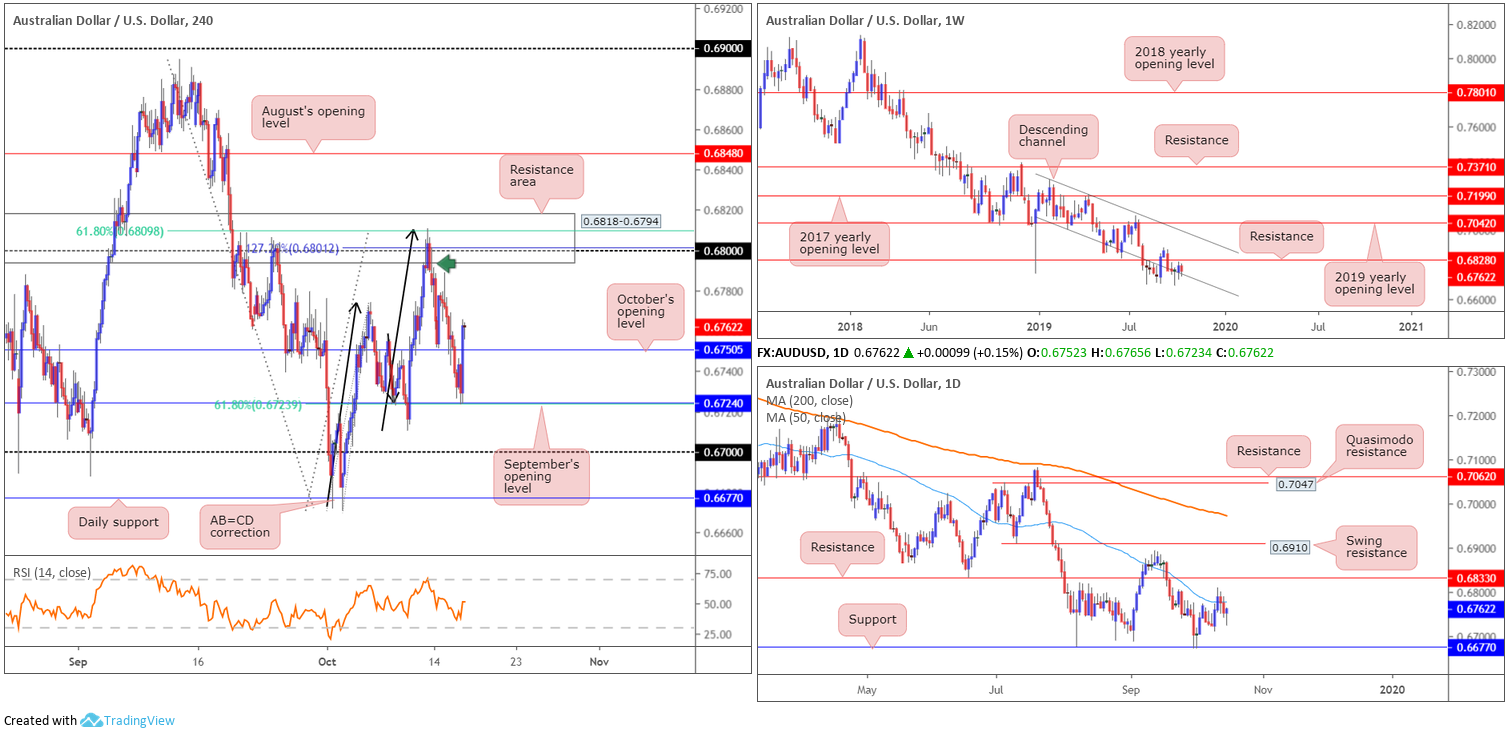
In recent movement, the Australian dollar eked out marginal gains against its US counterpart, decisively pushing back through October’s opening level at 0.6750.
For traders who read Wednesday’s report you may recall the following piece:
As evident from the H4 timeframe, traders who sold the H4 bearish rotation candle (green arrow) out of the H4 resistance area at 0.6818-0.6794 had price strike the initial take-profit target at 0.6750. This was a solid cue to think about reducing some of the risk and maybe banking a portion of the position. In the event we continue to explore lower ground, the second take-profit target resides at September’s opening level at 0.6724/61.8% Fibonacci ratio.
As can be seen from the H4 chart this morning, the candles struck the 0.6724/61.8% Fibonacci ratio level amid the early hours of US trading yesterday. Well done to any readers who managed to take advantage of this near-70-point move.
Moving forward, and noting the H4 candles trade north of 0.6750, higher-timeframe structure has the weekly candle attempting to take hold of channel support extended from the low 0.7003. However, by and of itself, this descending line has a spotty history, likely due to the overall primary trend facing a southerly bearing. The 50-day SMA (blue – 0.6777) stands as possible resistance on the daily timeframe, with a violation of this line exposing resistance coming in at 0.6833. To the downside, nevertheless, familiar support at 0.6677 remains in sight.
Areas of consideration:
Following the push back above October’s opening level at 0.6750, a retest of this level is a real possibility today. Unless the trader can take on a position with an incredibly tight stop, though, entering long from here faces almost immediate resistance in the shape of the 50-day SMA (0.6777).
Alternatively, traders interested in shooting for another short off the H4 resistance area mentioned above at 0.6818-0.6794 may experience a whipsaw to daily resistance at 0.6833/weekly resistance at 0.6828. In fact, an attractive shorting opportunity may be on a test of the said higher-timeframe resistances and close back within the said H4 resistance base (on a H4 closing basis). Traders then have the option of securing entry and risk levels on the back of the H4 rejection candle.
USD/JPY:
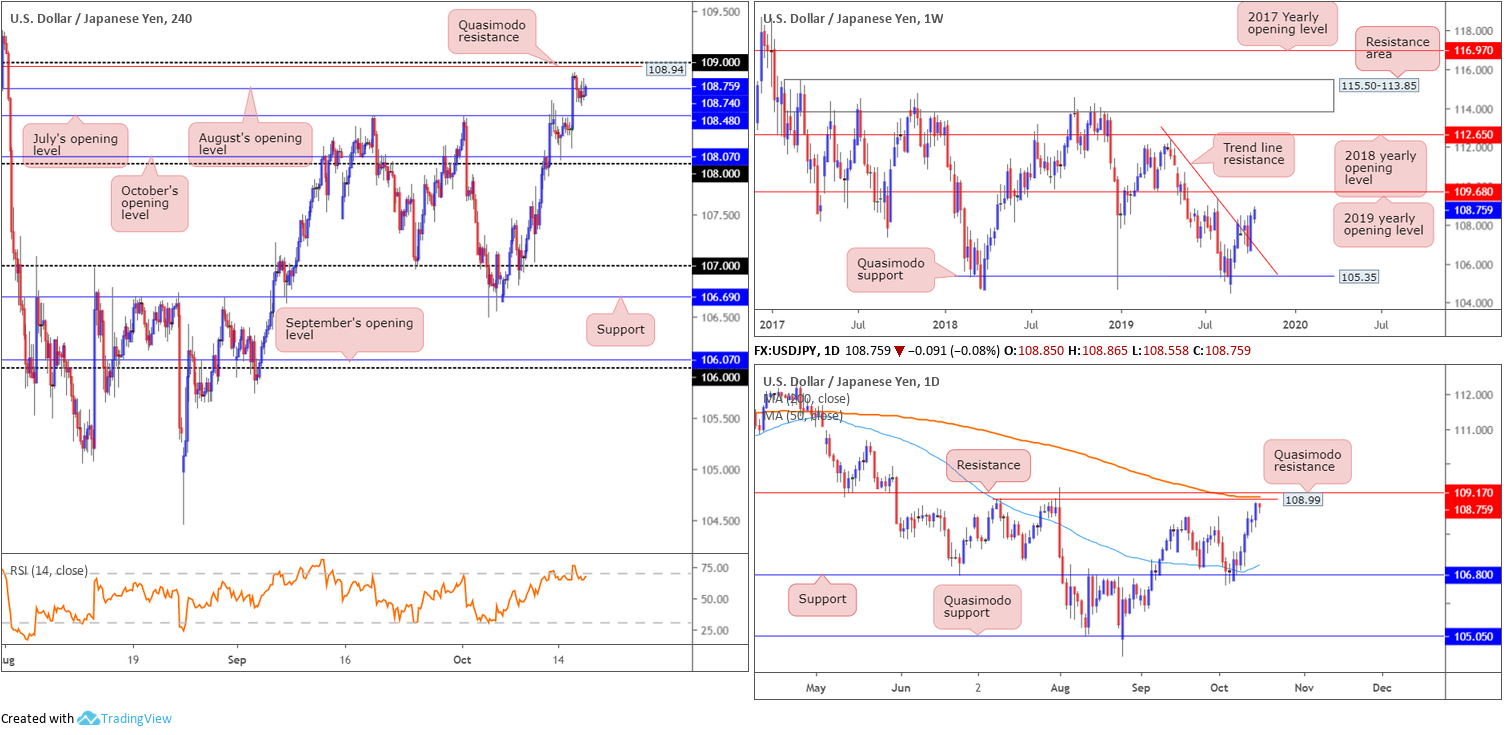
USD/JPY action employed a softer stance Wednesday, though did manage to mildly recapture August’s opening level on the H4 timeframe at 108.74.
In view of yesterday’s lacklustre performance, the H4 candles, although treading water under 108.74, are positioned within touching distance of 109, which happens to align with Quasimodo resistance at 108.94. What’s also interesting from a technical standpoint is the relative strength index (RSI) displaying overbought conditions.
As for higher-timeframe levels, the following piece, in light of Wednesday’s movement, is taken from yesterday’s technical briefing (italics):
Latest from the weekly timeframe has the current candle extending gains following the break of trend line resistance (etched from the high 112.40) last week. The next upside target from this point is seen at the 2019 yearly opening level drawn from 109.68. Although weekly price appears to be gearing up for additional upside, daily price is closing in on Quasimodo resistance at 108.99, the 200-day SMA (orange – 109.06) and resistance coming in at 109.17.
Areas of consideration:
Outlook unchanged.
The 109 handle, given it holds notable confluence from the H4 and daily timeframes, is a barrier worthy of attention this morning. The only grumble, of course, is weekly price demonstrates scope to run beyond 109 to 109.68. To help overcome this and attempt to avoid an unnecessary loss, interested sellers from 109 are urged to consider waiting for additional H4 candlestick confirmation to form before pulling the trigger – think bearish engulfing or shooting star patterns, or even a full-bodied bearish candle. By doing so, not only does this identify seller intent, it also provides entry and risk levels to work with.
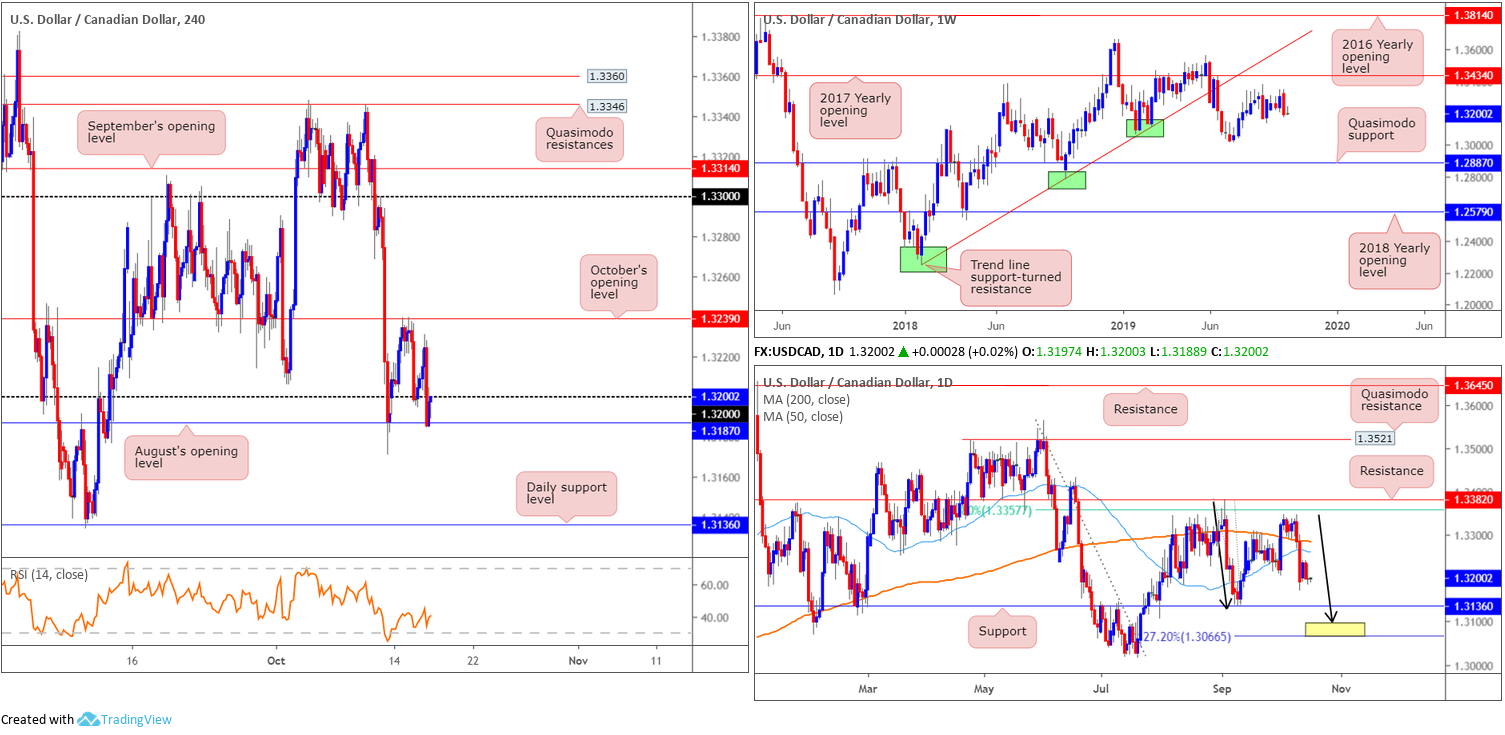
USD/CAD:
USD/CAD action advanced to a fresh session high of 1.3230 in early US trade Wednesday, largely in response to US retail sales and Canadian inflation figures. The move, nonetheless, was short lived as rising WTI prices reinforced the Canadian dollar, guiding the pair sub 1.32 to August’s opening level at 1.3187 into the close.
As underscored in Wednesday’s analysis (italics), traders will note limited movement has been seen on the weekly timeframe, following last week’s somewhat imposing bearish engulfing candle. Support is visible in the form of the 1.3015 July 15 low, followed by Quasimodo support stationed at 1.2887. The primary trend in this market has remained north since bottoming in September 2017. Currently, though, we appear to be in a secondary downtrend, with the peak set at 1.3661.
Daily flow, on the other hand, remains languishing south of the 200-day SMA (orange – 1.3285) and the 50-day SMA (blue – 1.3261). Note these lines have been closing in on each other since mid-September (converging) for a possible crossover scenario (also known as the Golden Cross). Outside of these lines, support on the daily timeframe can be seen at 1.3136 – holding reasonably significant history – as well as resistance drawn from 1.3382, sited just north of a 61.8% Fibonacci ratio at 1.3357. In addition, beneath 1.3136, we also have a potential ABCD (black arrows) reversal zone (yellow) between a 127.2% Fibonacci extension point at 1.3066 and the tip of the ABCD correction at 1.3096.
Areas of consideration:
Outlook unchanged.
With August’s opening level at 1.3187 under siege, a break of this barrier unlocks the door to a possible move towards daily support mentioned above at 1.3136. This offers sufficient room to secure reasonable risk/reward in a short scenario. For conservative traders, waiting for a retest of 1.32/1.3187 to form before committing funds might be an idea. This may permit better entry (entry and risk can be calculated based on the rejecting candlestick’s open and high price), though runs the risk of missing the trade in the event a retest is not seen.
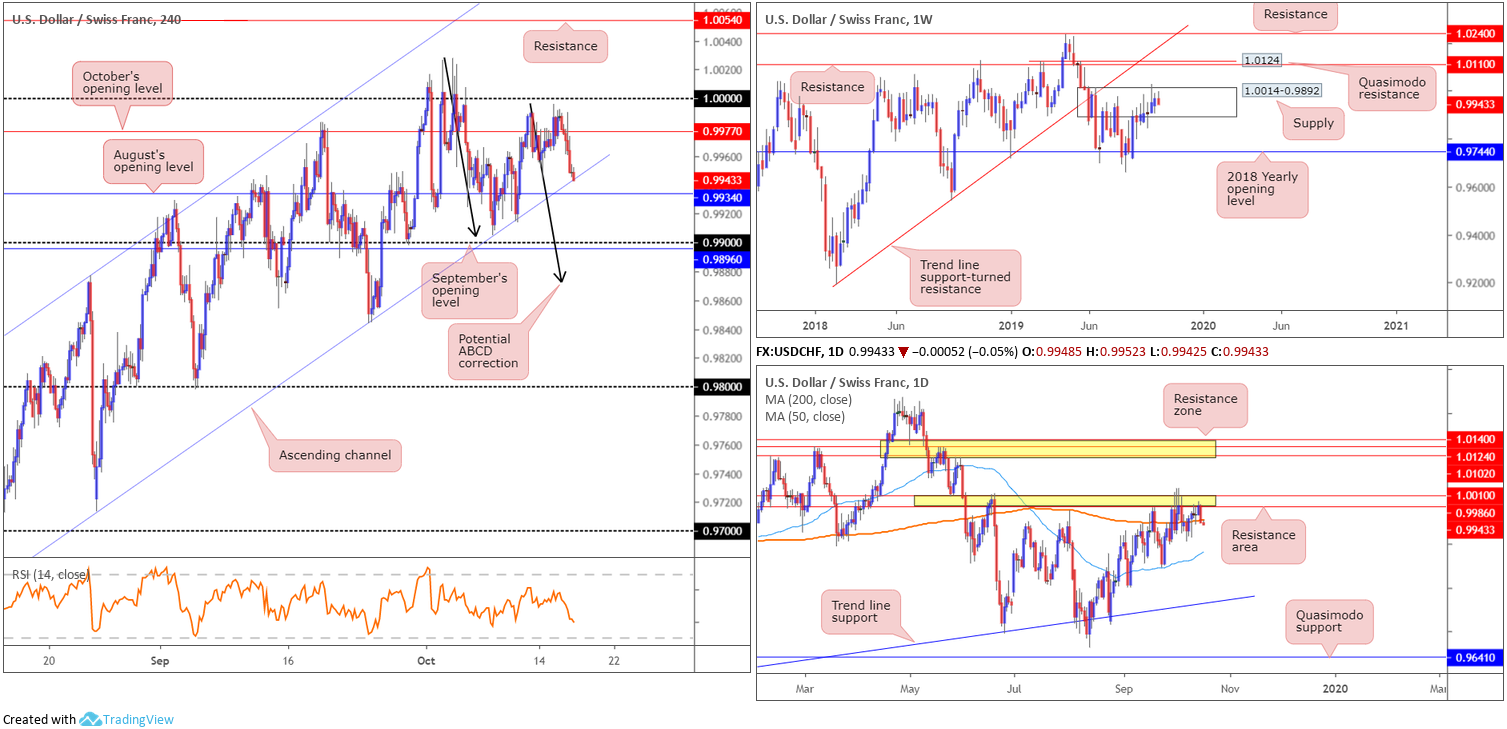
USD/CHF:
Broad-based USD selling weighed on the USD/CHF Wednesday, consequently pulling the H4 candles beneath October’s opening level at 0.9977 (sited just south of 1.0000 [parity]) to a few points north of channel support formed from the low 0.9659. Directly beneath we have August’s opening level residing at 0.9934, with a break of this base likely clearing the path to 0.99, closely shadowed by September’s opening level at 0.9896.
Elsewhere, (italics – resembles unchanged from previous report) weekly price remains confined within the walls of supply priced in at 1.0014-0.9892, with sellers struggling to make a stance. Recent moves struck multi-month peaks at 1.0027, possibly tripping some buy stops and weakening sellers. Consequently, resistance coming in at 1.0110, which happens to merge closely with Quasimodo resistance at 1.0124, may enter the mix over the coming weeks. According to the primary trend, price reflects a somewhat bullish tone. However, do remain aware we have been rangebound since the later part of 2015 (0.9444/1.0240).
The resistance area (yellow) stationed on the daily timeframe at 1.0010/0.9986 is a prominent structure, which held price action lower yesterday, forcing a close beneath the 200-day SMA (orange – 0.9955).
Areas of consideration:
Having noted weekly price remains confined within supply at 1.0014-0.9892, as well as daily movement recently tunnelling below its noted 200-day SMA, a long from the current H4 channel support is chancy. In addition to this, the previous reactions formed off the said channel have proved uninspiring, with the most recent failing to test 1.0000. Therefore, bearish themes below August’s opening level could be an option today, with the expectation of a break beneath 0.99 to the 50-day SMA highlighted above. A move lower is also suggested based on the D-leg of the ABCD (black arrows) bullish correction on the H4 timeframe, terminating around 0.9874.
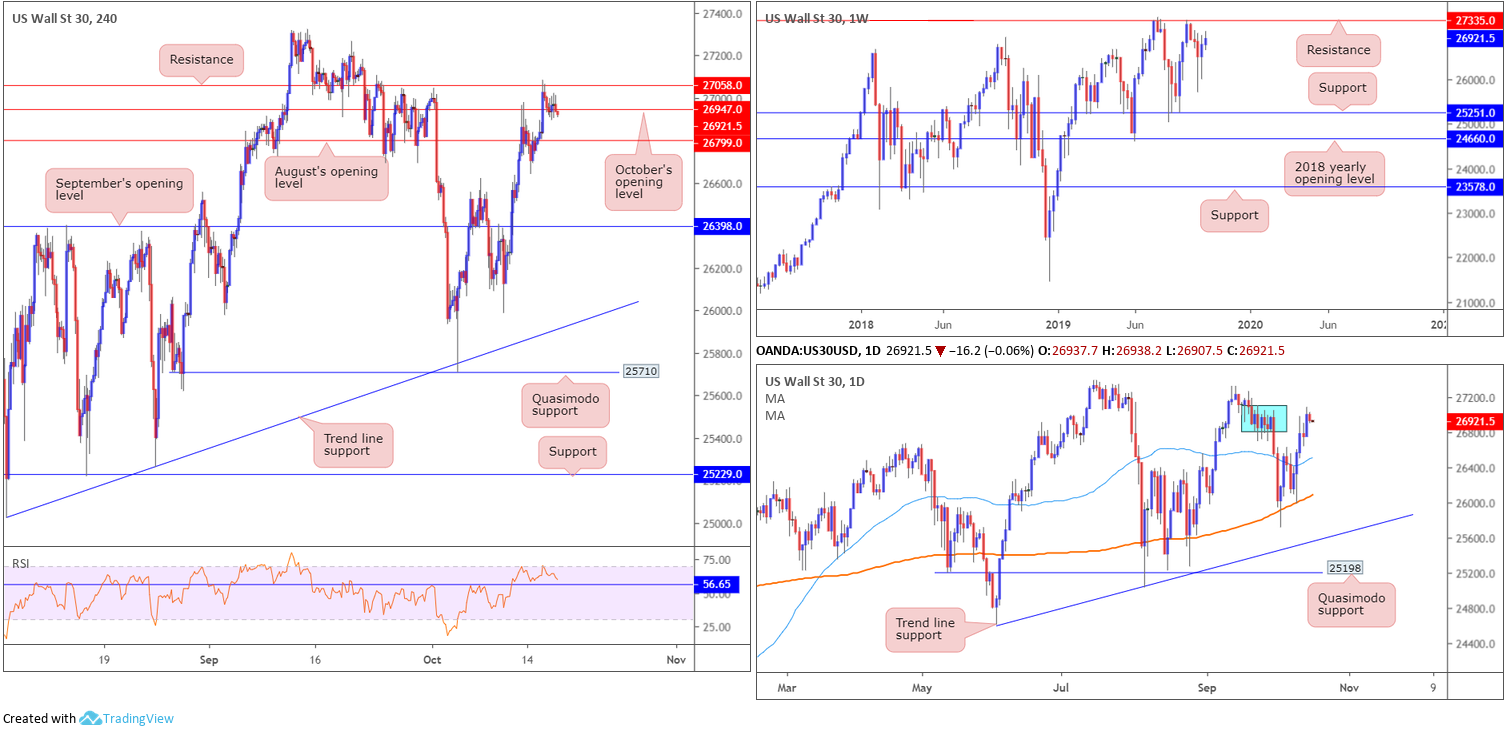
Dow Jones Industrial Average:
(Italics represents parts of previous analysis).
US equities curved mildly lower Wednesday, following US retail sales data dipping for the first time in seven months in September. The Dow Jones Industrial Average shed 22.82 points, or 0.08%; the S&P 500 also lost 5.99 points, or 0.20%, and the tech-heavy Nasdaq 100 declined 22.64 points, or 0.29%.
Technically, the ducks are being lined up for a possible approach towards weekly resistance at 27335, sited only a few points south of the all-time high 27388. Despite a minor setback to 21452, the primary trend in this market remains facing northbound.
Research on the daily timeframe places a bold question mark on supply between 27110-26813 (blue – positioned just south of weekly resistance at 27335), having seen limited downside attempts since the unit tested the area late last week. It may also interest some traders to note the 200/50-day SMAs both face north.
Across the page on the H4 timeframe, resistance at 27058 recently entered the mix, with yesterday’s action probing beneath October’s opening level at 26947. Above 27058, limited supply is evident; therefore, a break of this level could signify a violation of daily supply at 27110-26813 may be on the cards along with a run towards weekly resistance at 27335.
Areas of consideration:
Outlook unchanged.
A H4 close above 27058 will highlight potential bullish scenarios to weekly resistance at 27335. Conservative traders will likely require at least a retest of 27058 to play out before pulling the trigger (entry and risk can then be measured off the rejection candle’s structure).
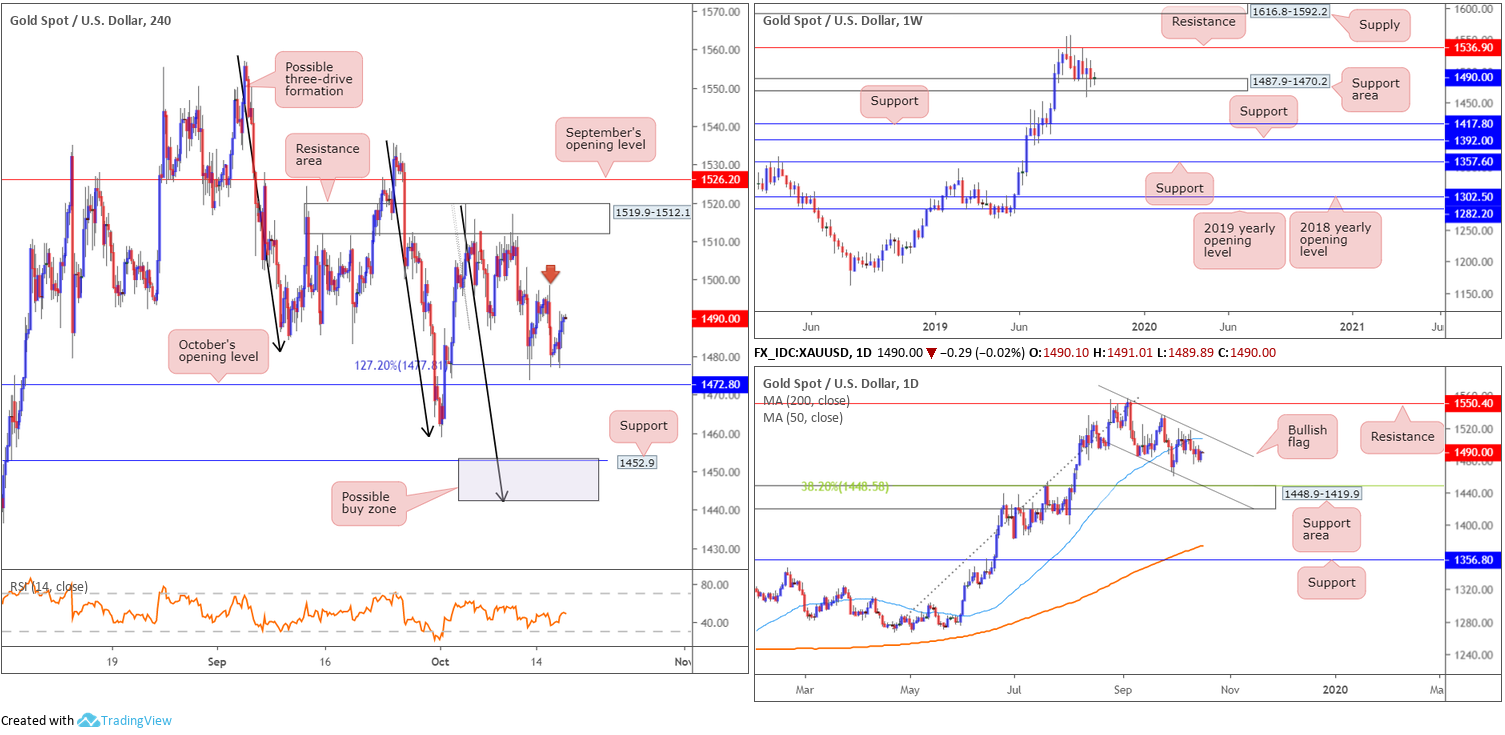
XAU/USD (GOLD):
(Italics resemble previous analysis).
Against the backdrop of US/China trade pressures, the cautious mood in equity markets was considered a key driver behind demand for traditional safe-haven assets Wednesday. The yellow metal, as evident from the H4 timeframe, established support off the 127.2% Fibonacci extension point at 1477.8, which happens to be closely shadowed by October’s opening level at 1472.8. Beyond here, the October 1st low 1458.9 is in sight, followed by support coming in at 1452.9 as well as a possible three-drive formation (black arrows) at 1442.1 (grey zone).
In terms of the overall technical picture, weekly price trades mildly higher on the week, engaging with a support area at 1487.9-1470.2. To the upside, resistance is seen at 1536.9, whereas two layers of support are visible at 1392.0 and 1417.8 in the event we push for lower ground. In terms of the longer-term primary trend, gold has been trading northbound since the later part of 2015.
Daily flow shows a bullish flag has been in motion since early September (1557.1/1485.3). Last week saw the unit cross beneath its 50-day SMA (blue – 1506.7), consequently opening downside to a possible test of a support area coming in at 1448.9-1419.9 (which happens to have its upper edge bolstered by a 38.2% Fibonacci ratio 1448.5 and a channel support [taken from the low 1485.3]).
Areas of consideration:
In essence, the unit remains entrenched within a long-term uptrend, though shows signs of weakness at the current weekly support area, particularly following the breach of its lower edge two weeks ago. Daily price demonstrates the market has room to press lower until reaching a support area at 1448.9-1419.9. H4 price is testing Fibonacci (ext.) support at 1477.8, with October’s opening level at 1472.8 sited as the next point of interest. The grey zone between 1442.1/1452.9 is considered a potential buy zone, given it is formed by reasonable H4 support and a possible three-drive formation (black arrows), as well as being located within the said daily support area.
Should H4 price remain defensive north of 1477.8, however, and we break through 1498.4 (red arrow), further upside towards 1519.9-1512.1, and possibly September’s opening level at 1526.2, could be in store.
The accuracy, completeness and timeliness of the information contained on this site cannot be guaranteed. IC Markets does not warranty, guarantee or make any representations, or assume any liability regarding financial results based on the use of the information in the site.
News, views, opinions, recommendations and other information obtained from sources outside of www.icmarkets.com.au, used in this site are believed to be reliable, but we cannot guarantee their accuracy or completeness. All such information is subject to change at any time without notice. IC Markets assumes no responsibility for the content of any linked site.
The fact that such links may exist does not indicate approval or endorsement of any material contained on any linked site. IC Markets is not liable for any harm caused by the transmission, through accessing the services or information on this site, of a computer virus, or other computer code or programming device that might be used to access, delete, damage, disable, disrupt or otherwise impede in any manner, the operation of the site or of any user’s software, hardware, data or property.


