
Thursday 17th March: Keep a close eye on the GBP midday today – volatility expected!
A note on lower timeframe confirming price action…
Waiting for lower timeframe confirmation is our main tool to confirm strength within higher timeframe zones, and has really been the key to our trading success. It takes a little time to understand the subtle nuances, however, as each trade is never the same, but once you master the rhythm so to speak, you will be saved from countless unnecessary losing trades. The following is a list of what we look for:
- A break/retest of supply or demand dependent on which way you’re trading.
- A trendline break/retest.
- Buying/selling tails – essentially we look for a cluster of very obvious spikes off of lower timeframe support and resistance levels within the higher timeframe zone.
- Candlestick patterns. We tend to only stick with pin bars and engulfing bars as these have proven to be the most effective.
For us, lower timeframe confirmation starts on the M15 and finishes up on the H1, since most of our higher timeframe areas begin with the H4. Stops usually placed 5-10 pips beyond your confirming structures.
EUR/USD:
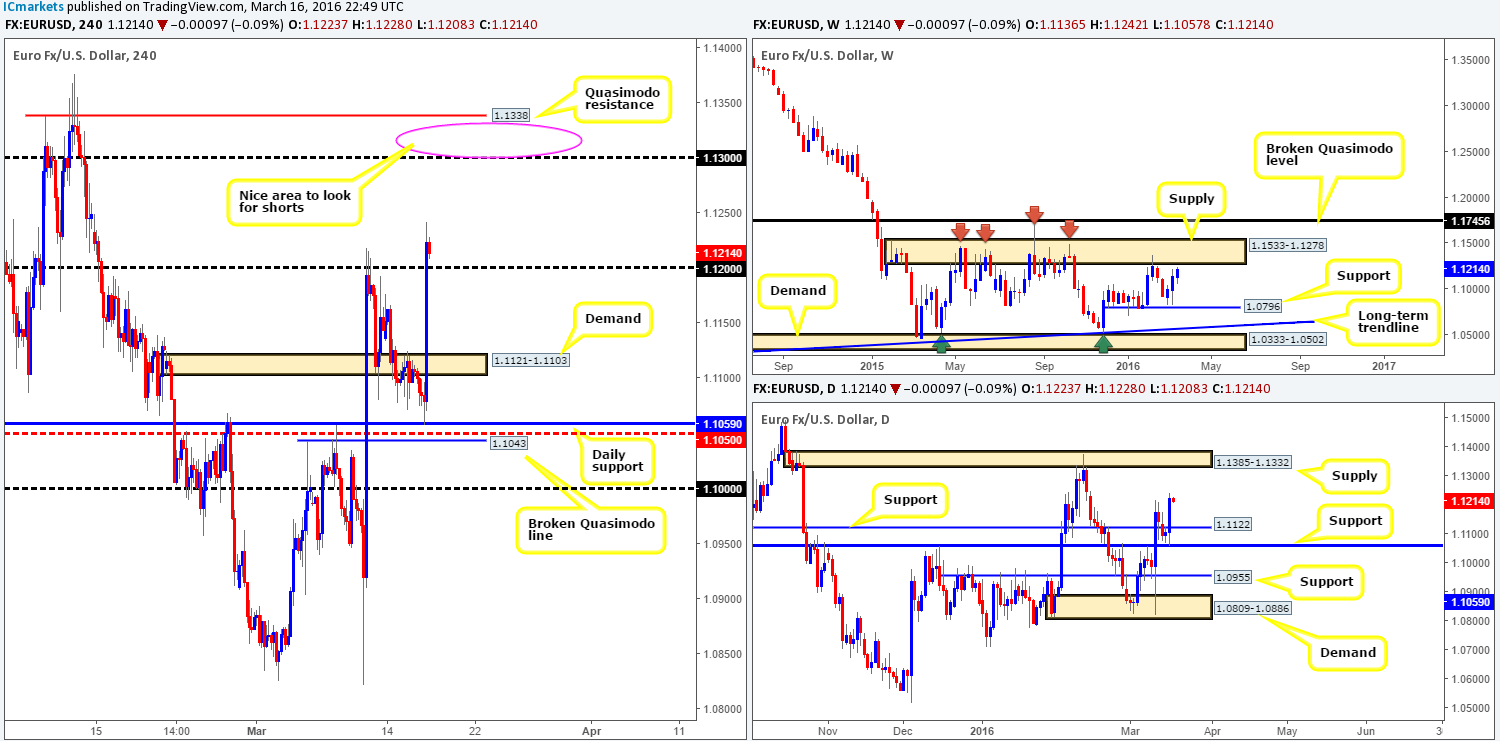
Following the Fed’s decision to leave rates on hold yesterday, the single currency responded by screaming to new highs of 1.1242 on the day. For those who read our previous report (http://www.icmarkets.com/blog/wednesday-16th-march-volatility-expected-today-with-several-high-impacting-news-events-set-to-take-the-stage/), you may recall us mentioning to watch for a bullish response from the 1.1065/1.1043 H4 area, which, as you can see, bounced almost to-the-pip. Well done to any of our readers who managed to board this rocket before it took off!
In view of price now trading above the 1.1200 figure, we would consider a long on a retest of this number today (with lower timeframe confirmation), targeting the 1.1300 region. Why 1.1300 and not 1.1250? Well, 1.1250 has not shown much feedback in the past especially during the month of February, hence why we’re looking higher. In support of this trade, we see room for price to move higher on both the weekly and daily charts. Weekly supply does not kick in until 1.1533-1.1278, whilst daily supply comes in a little higher at 1.1385-1.1332.
In addition to this long trade, we would also be very interested in shorting between the 1.1300 number and the H4 Quasimodo resistance level at 1.1338, as this area is bolstered by the higher-timeframe supplies mentioned above. We would still advise waiting for some sort of lower timeframe setup to form before selling here, since price could just as easily fake higher into the larger supplies which support our sell zone.
Levels to watch/live orders:
- Buys: 1.1200 region [Tentative – confirmation required] (Stop loss: dependent on where one confirms this area).
- Sells: 1.1300/1.1338 zone [Tentative – confirmation required] (Stop loss: dependent on where one confirms this area).
GBP/USD:
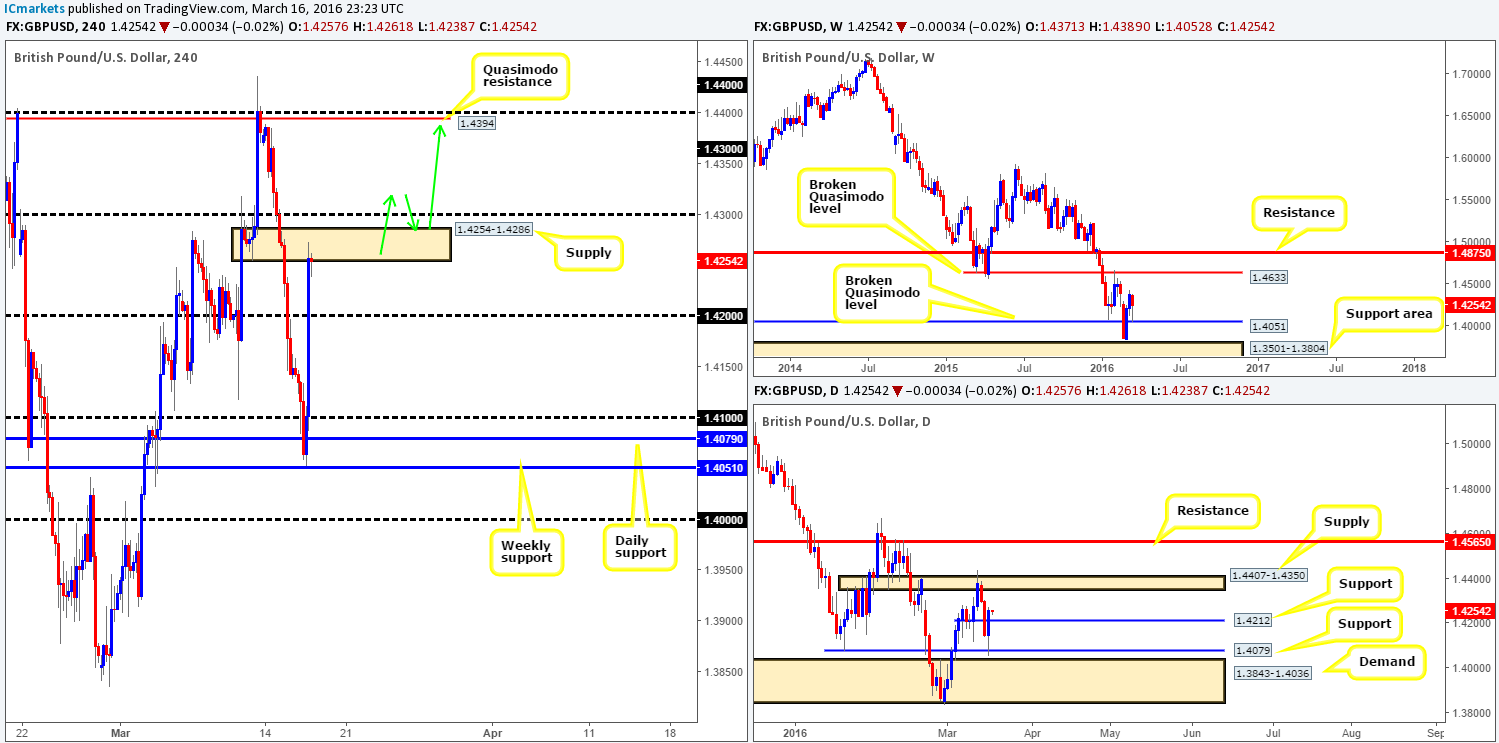
The GBP/USD clawed back some of its recent losses yesterday as the Fed left interest rates unchanged. The pair bounced to-the-pip from a broken weekly Quasimodo line at 1.4051, squeezing sellers out of the market around both the 1.4100 and 1.4200 numbers before colliding with H4 supply at 1.4254-1.4286 by the day’s end. Well done to any of our readers who managed to lock in a trade before Cable took off yesterday as the 1.4050/1.4000 area was a noted buy zone in our previous report!
Looking across to the weekly and daily charts, we see little evidence backing a short from the current H4 supply zone as weekly resistance does not come into the picture until 1.4633 and daily supply is not seen until 1.4407-1.4350. Technically, the most we’d expect from this H4 supply is a bounce down to retest 1.4200 due to it being supported by a daily support level chalked up at 1.4212, which is not really something we’re looking to get involved in.
The only other alternative we see here would be to wait for price to close above both this H4 supply and the 1.4300 figure. This would effectively clear the path north for prices to challenge the H4 Quasimodo resistance level at 1.4394 (positioned within the aforementioned daily supply) and give one a chance to buy this market either on the breakout or on a retest as per the green arrows.
Levels to watch/live orders:
- Buys: Watch for price to consume the 1.4300 level and look to trade any retest seen thereafter (Lower timeframe confirmation required).
- Sells: Flat (Stop loss: N/A).
AUD/USD:
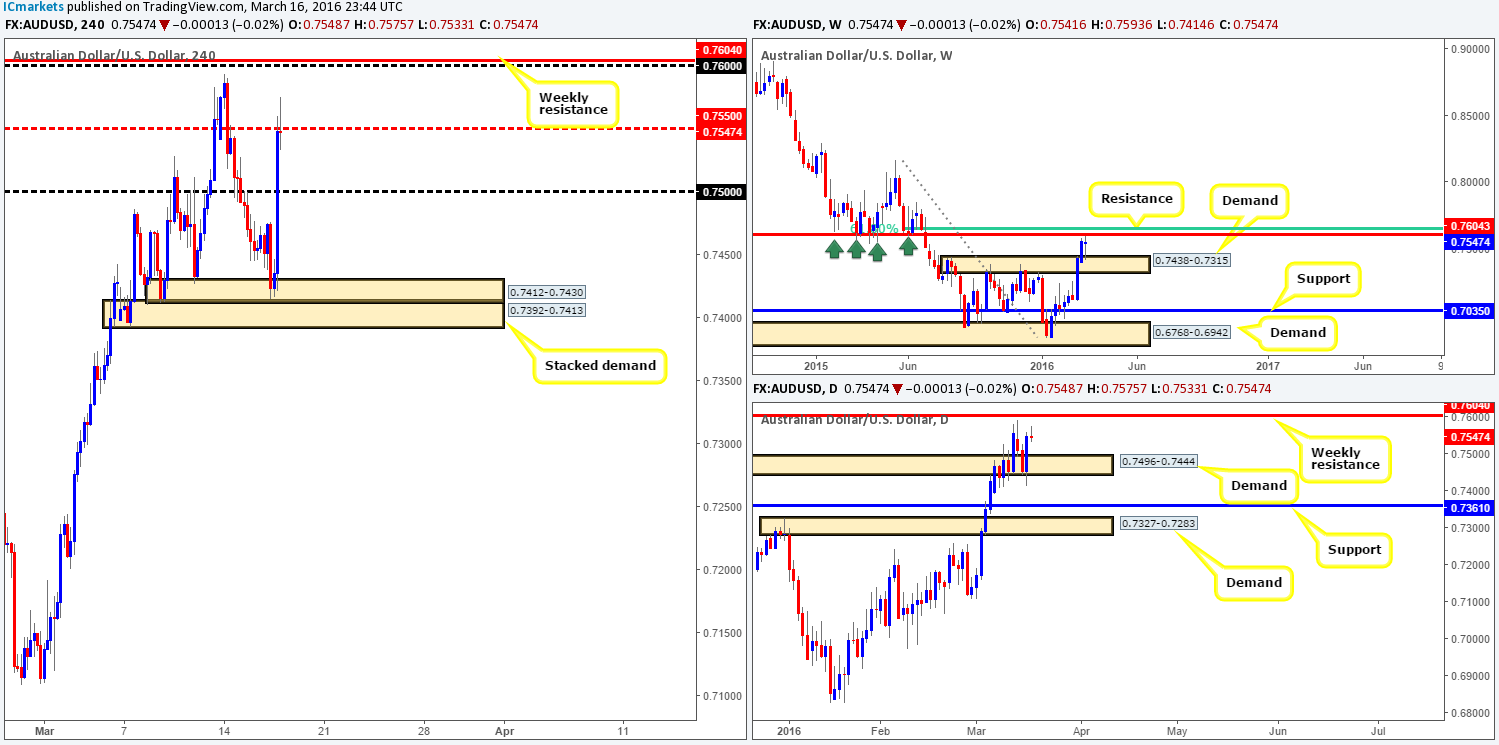
Across the board the U.S. dollar took an absolute beating due to the Fed leaving interest rates unchanged. The commodity currency bounced beautifully from H4 demand at 0.7412-0.7430, rallying to highs of 0.7560 on the day. As can be seen from the H4 chart, price is currently printing a selling wick, also known as a bearish pin bar. Given that this candle pattern is forming around mid-level resistance at 0.7550, a lot of traders will likely be looking to trade this. However, it is very difficult for us to get excited here since just above sits a major weekly resistance hurdle drawn from 0.7604, which also boasts the 0.7600 figure. Therefore, to our way of seeing things, it might be best to wait for this weekly level to come into play before considering selling today. On the other side of the coin, however, although the weekly resistance is a far safer area to be looking to short (in our opinion), let’s not forget where price came from! It recently bounced from weekly demand chalked up at 0.7438-0.7315 which could pressure this pair to push above the aforementioned weekly resistance. In light of this, we would HIGHLY recommend only shorting the weekly resistance alongside a decent lower timeframe selling setup.
Levels to watch/live orders:
- Buys: Flat (Stop loss: N/A).
- Sells: 0.7600 region [Tentative – confirmation required] (Stop loss: dependent on where one confirms this area).
USD/JPY:
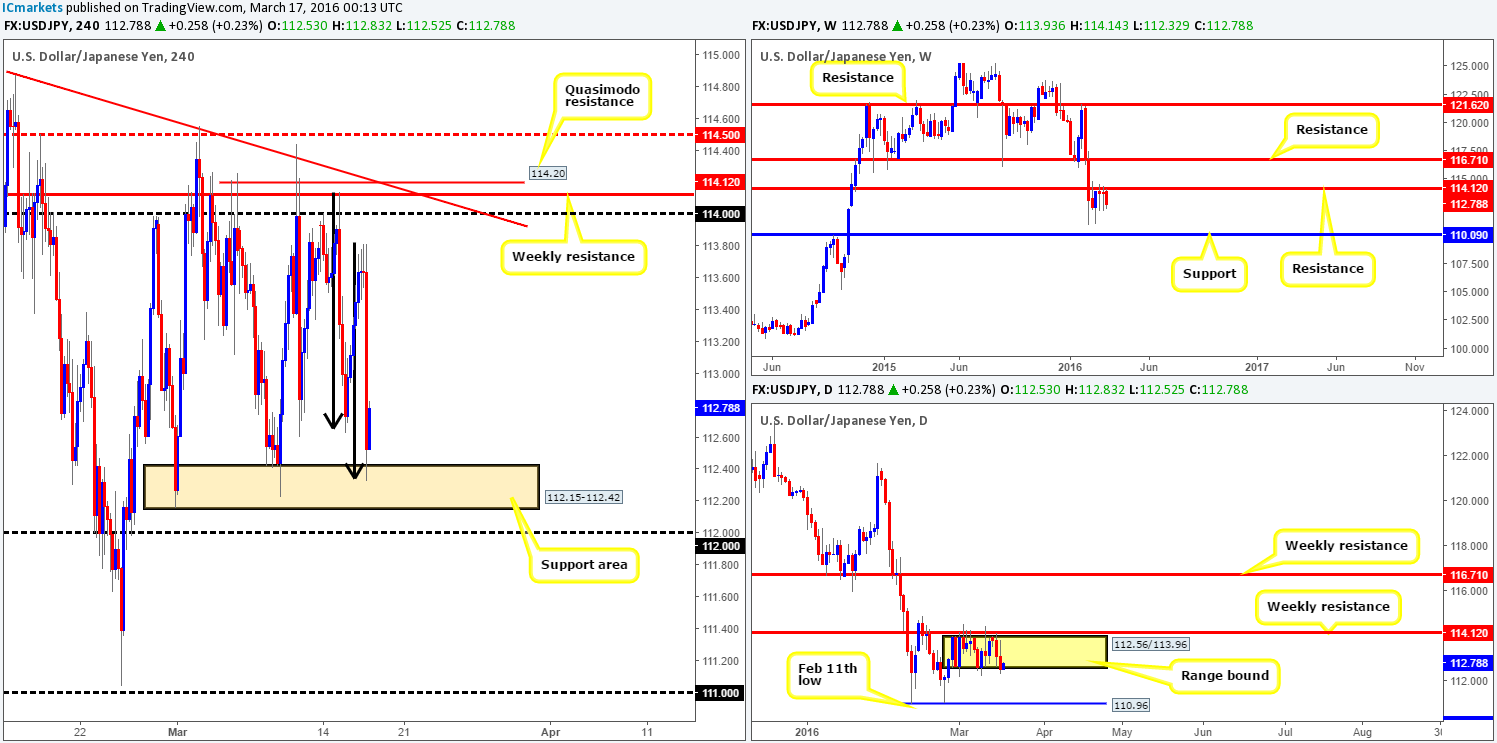
In light of the Fed’s recent actions, the USD/JPY continues to react bearishly from the underside of weekly resistance painted at 114.12. As we’ve pointed out in recent reports, if the sellers continue to dominate here the support level at 110.09 would be the next target to achieve.
Daily action on the other hand has been confined within a range since the beginning of March between 112.56/113.96. A subtle close beyond the lower limits of this consolidation was seen yesterday suggesting the doors may now be open for a potential move down to the 110.96 region (the Feb 11th low), which is all that stands in the way of a move down to the weekly support mentioned above at 110.09.
Moving across to the H4 chart, we can see that since price sold off from weekly resistance, a 1:1 harmonic move (see black arrows) formed on approach to an area of support at 112.15-112.42, which is so far holding firm. Although we are seeing buying from here right now, we remain uncertain. With the weekly showing strength from resistance and daily price breaking below its range (see above), we feel this pair may be heading lower from here! Therefore, we’d be far more comfortable shorting this market on a break below and retest of the 112.00 figure today, since below here the path appears free down to 111.00 – effectively the daily support we mentioned above at 110.96.
Levels to watch/live orders:
- Buys: Flat (Stop loss: N/A).
- Sells: Watch for price to consume the 112.00 level and look to trade any retest seen thereafter (Lower timeframe confirmation required).
USD/CAD:
The USD/CAD is seen trading markedly lower this morning. A heavy round of selling came into the market shortly after a dovish Fed report. The 260-pip down move took out several technical barriers along the way before eventually finding support around the 1.3100 handle.
Following this rather dramatic move, where do we go from here? Well, up on the weekly chart price looks to be headed in one direction – south! And, as far as we can see on this timeframe, there is space to the downside until we reach support penciled in at 1.2833. Meanwhile, over on the daily chart demand at 1.3038-1.3165 is now in play. Ignoring the weekly chart for a moment, the hottest level to buy from currently is seen at 1.3055 – a H4 Quasimodo support which is located within the daily demand area just mentioned above. Nevertheless, with the weekly train steaming south, one would need to be cautious buying here! That does not mean it is not a valid level, all it means is we would wait for the lower timeframes to prove buying strength existed here before placing money on the line (see top of page regarding lower timeframe confirmation).
If, on the other hand, the Loonie pushed below the above said daily demand, shorts, as far as we see, will be possible down to the daily Quasimodo support barrier coming in at 1.2900.
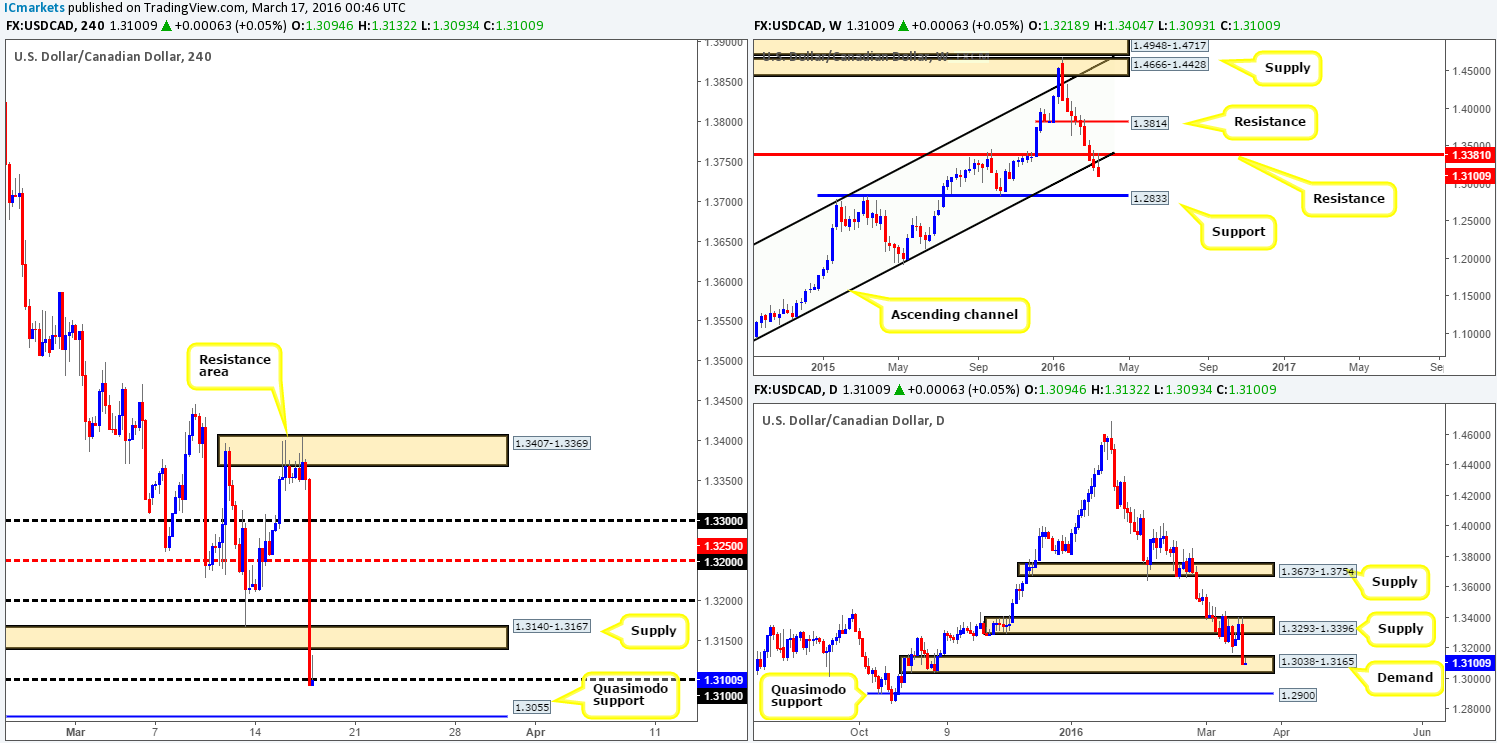
Levels to watch/live orders:
- Buys: 1.3055 [Tentative – confirmation required] (Stop loss: dependent on where one confirms this level).
- Sells: Flat (Stop loss: N/A).
USD/CHF:
Consequent to the recent Fed-induced sell-off, there is a clear buying opportunity presenting itself on the USD/CHF at present. The H4 demand zone chalked up at 0.9749-0.9781 not only fuses with a 78.6% Fibonacci level at 0.9754, but it’s also bolstered by the weekly trendline extended from the low 0.9071. However, as highlighted in Monday’s report, even though trendlines are effective at predicting turning points, they are unfortunately prone to some very nasty fakeouts. With that, today’s objective is relatively simple. Look for a lower timeframe buy opportunity within the aforementioned H4 demand base, targeting 0.9800 first and foremost. This could be in the form of a lower timeframe supply area breaking, a lower timeframe trendline resistance being consumed or our favorite, a collection lower timeframe buying tails around a lower timeframe support.
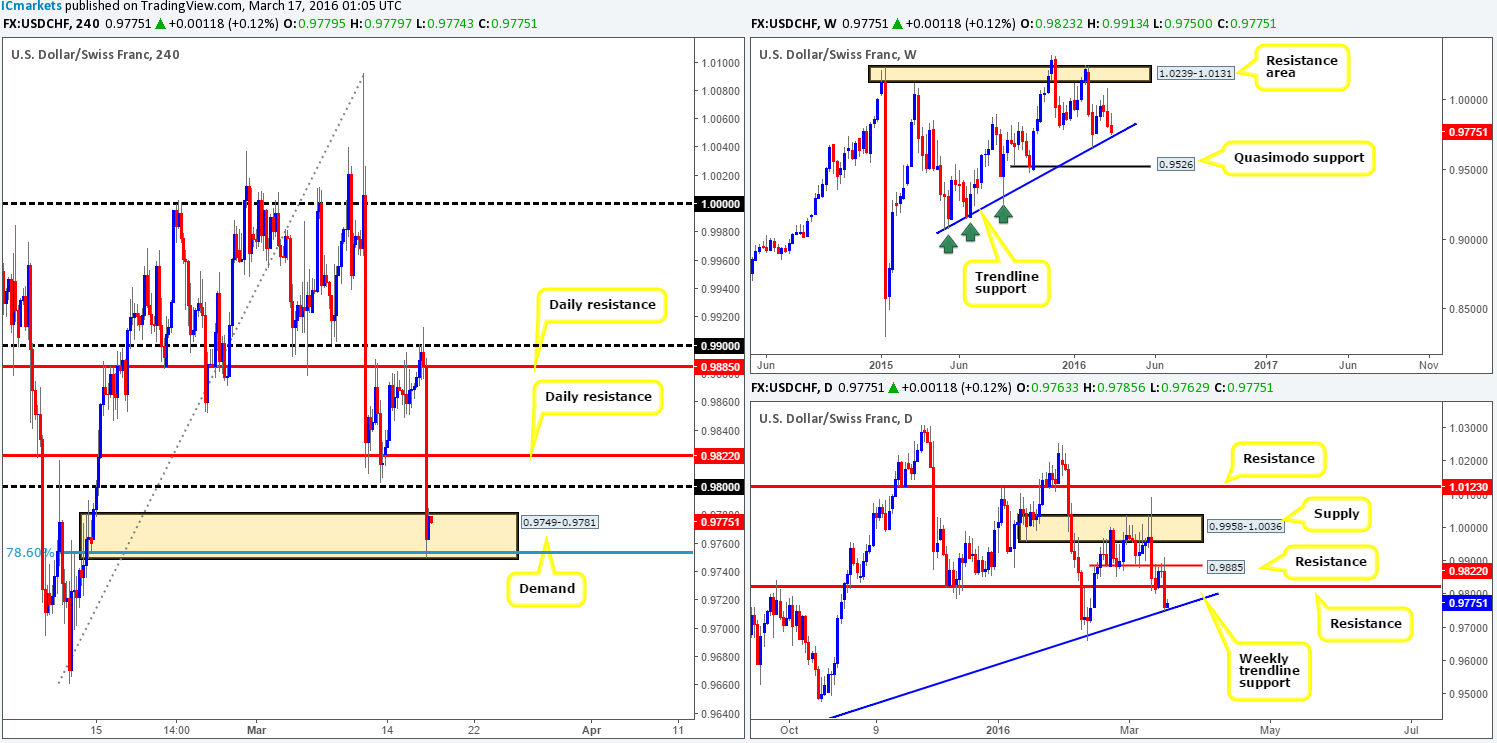
Levels to watch/live orders:
- Buys: 0.9749-0.9781 [Tentative – confirmation required] (Stop loss: dependent on where one confirms this area).
- Sells: Flat (Stop loss: N/A).
DOW 30:
U.S. stocks rallied for a fourth consecutive day yesterday, clocking new highs of 17379 by the close. As far as we’re concerned, this is clearly a buyer’s market we’re seeing right now at least until price reaches the H4 supply area fixed at 17606-17538. Therefore, we’re going to be looking to ‘buy the dips’ in this market today. H4 support at 17275, followed closely by H4 demand at 17186-17226 would be ideal places to join in this buying frenzy.
The reason we’re confident this is a buyer’s market up to the above said H4 supply is simply because both the weekly and daily timeframes show room to move north towards weekly supply coming in at 17752-17552. In fact, the H4 supply area is lodged neatly within the lower limits of this weekly barrier! To that end, not only does this make for a fantastic target zone for any longs, but it’s also a sturdy-looking sell zone too!
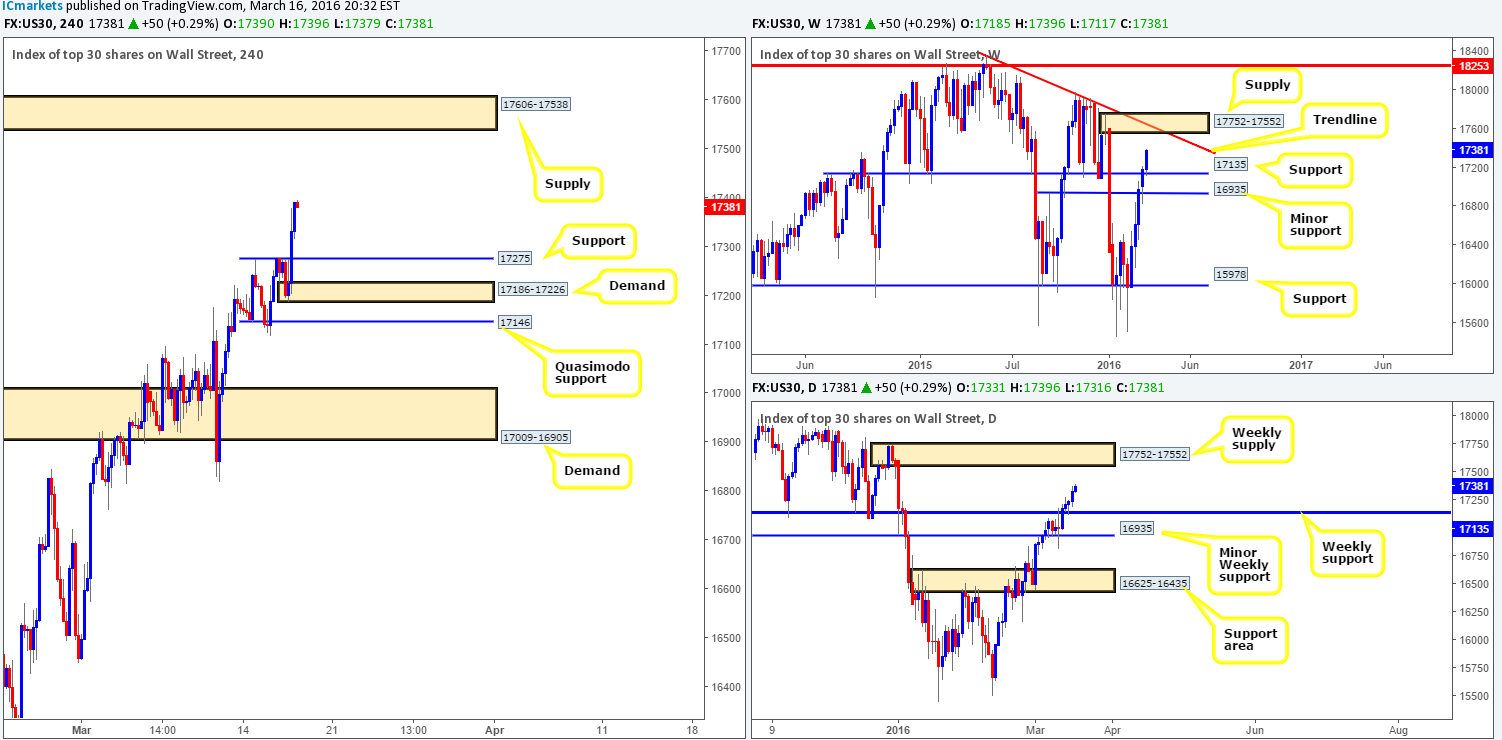
Levels to watch/live orders:
- Buys: 17275 region [Tentative – confirmation required] (Stop loss: dependent on where one confirms this area). 17186-17226 [Tentative – confirmation required] (Stop loss: dependent on where one confirms this area).
- Sells: 17606-17538 [Tentative – confirmation required] (Stop loss: dependent on where one confirms this area).
XAU/USD: (Gold)
Like most of yesterday’s instruments, Gold saw its fair share of volatility. With the USDX falling lower and Gold jumping to highs of 1263.8 off the back of the Fed’s decision to leave rates unchanged, what’s likely in store for this market today? Looking at the weekly chart, price clearly likes the weekly support barrier 1224.1 – just look at how close the yellow metal came to connecting with this level! With room being seen for the buyers to push prices higher on both weekly chart up to supply at 1307.4-1280.0 and on the daily chart up to resistance drawn from 1283.4, we have no interest in selling today. With that being the case, we’re looking to buy the retest off H4 support at 1256.2, targeting H4 supply at 1285.5-1278.5 (positioned within the above said weekly supply). Just to be on the safe side here though guys, setting pending orders at this level is a risky move in our book since one can never know how deep price will fake this level before holding, if at all! Waiting for lower timeframe confirmation will likely help avoid any potential whipsaws through this level.
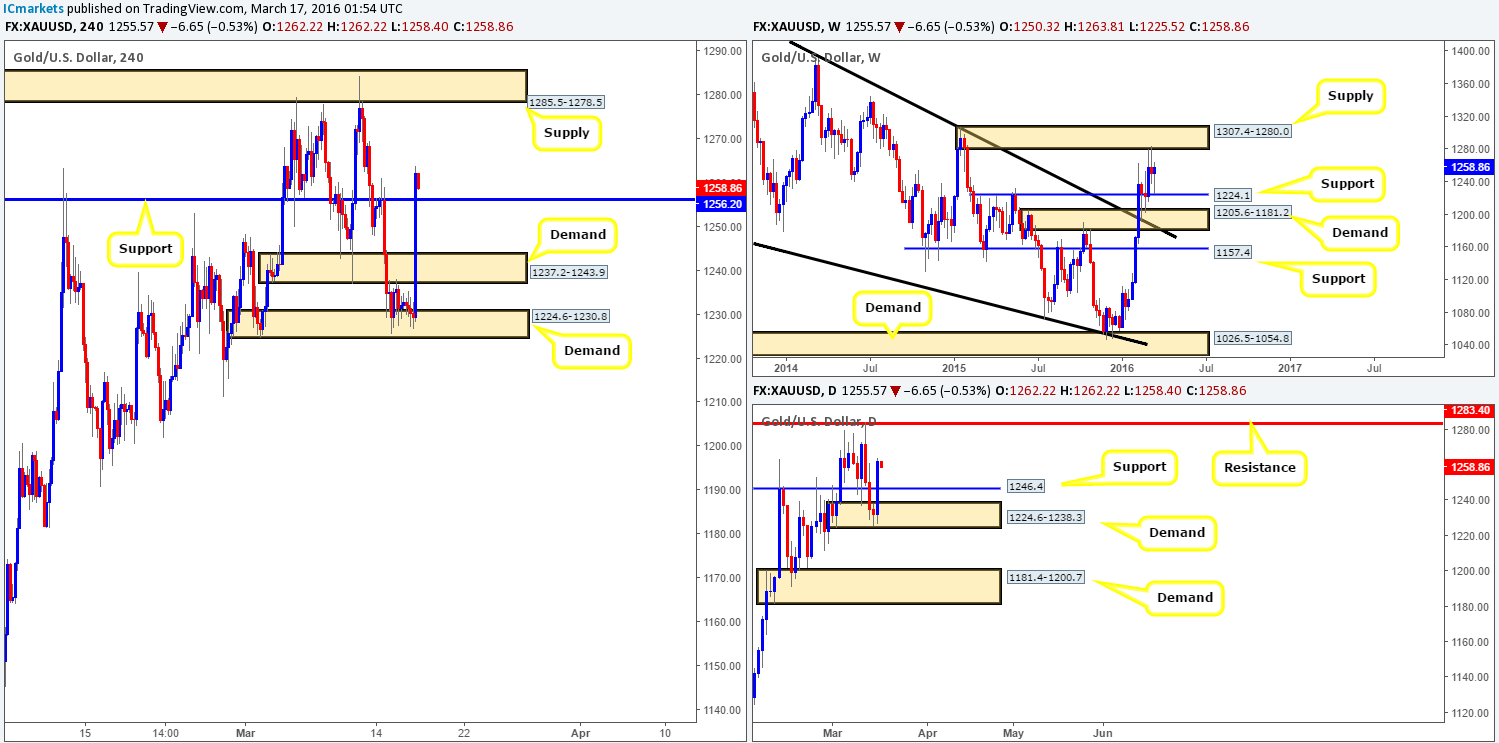
Levels to watch/live orders:
- Buys: 1256.2 region [Tentative – confirmation required] (Stop loss: dependent on where one confirms this area).
- Sells: Flat (Stop loss: N/A).


