
Key risk events today:
BoE Credit Conditions Survey; ECB Monetary Policy Meeting Accounts; US Core Retail Sales m/m and Retail Sales m/m; Philly Fed Manufacturing Index; FOMC Member Bowman Speaks; ECB President Lagarde Speaks.
(Italics represents previous analysis and outside sources)
EUR/USD:
The US and China have signed an agreement aimed at easing a trade war that has rattled markets and weighed on the global economy. Speaking in Washington, US President Donald Trump said the pact would be transformative for the US economy. Chinese leaders called it a win-win deal that would help foster better relations between the two countries. China has pledged to boost US imports by $200bn above 2017 levels and strengthen intellectual property rules. In exchange, the US has agreed to halve some of the new tariffs it has imposed on Chinese products (BBC News).
On the data front, the US Producer Price Index for final demand edged up 0.1 percent in December, seasonally adjusted. Prices for final demand less foods, energy, and trade services inched up 0.1 percent in December following no change in November. In 2019, the index for final demand less foods, energy, and trade services climbed 1.5 percent after advancing 2.8 percent in 2018, the US Bureau of Labour Statistics reported Wednesday. Both metrics came in lower than expected.
EUR/USD resumed upside control yesterday, adding more than 20 points, or 0.20%.
Traders who read last Friday’s analysis may recall the following:
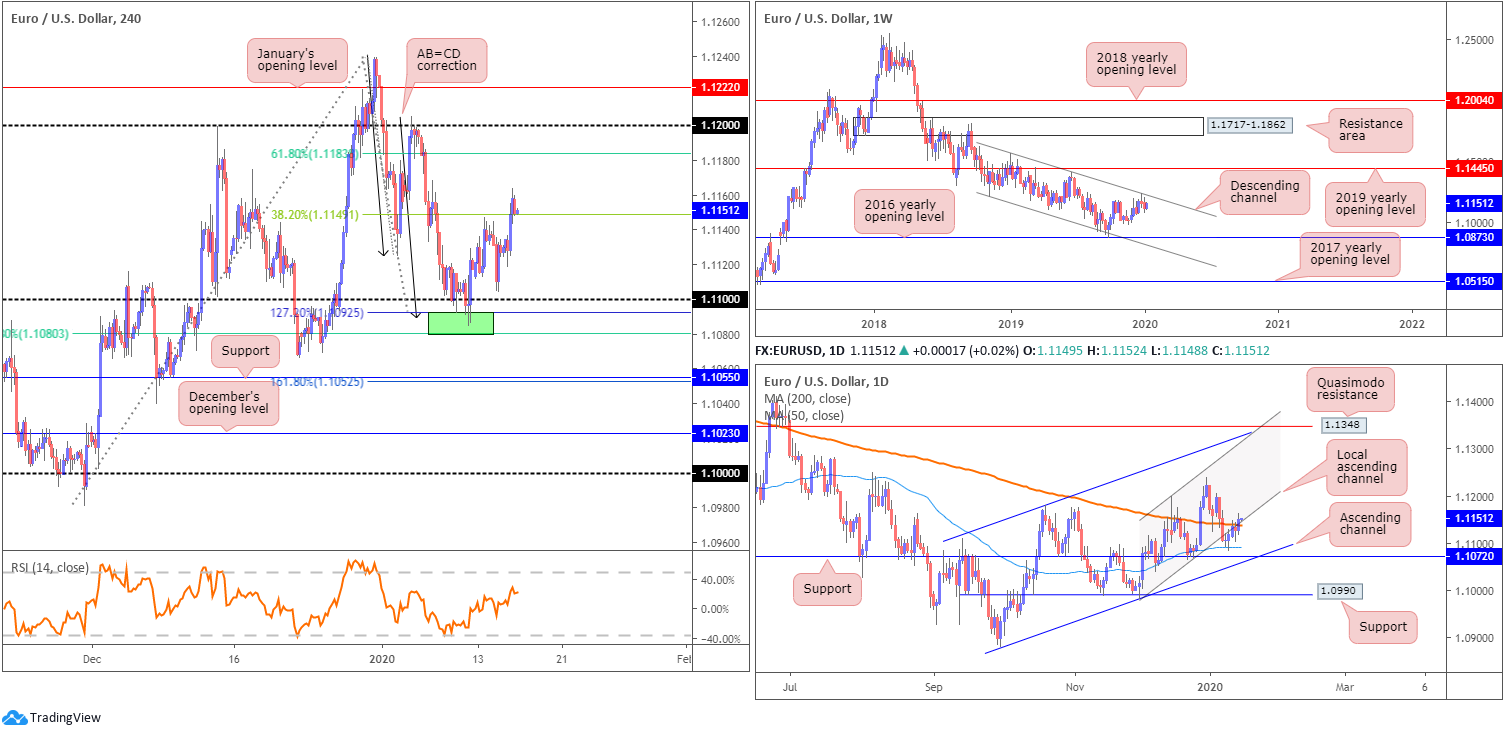
As of current price, buyers and sellers are squaring off a touch below the 1.11 handle on the H4 timeframe. As a result, a portion of sell stops beneath this psychological barrier have likely been tripped. Interestingly, though, the area between 1.1080/1.1092 (green), a 61.8% H4 Fibonacci retracement and a 127.2% AB=CD bullish correction, is likely to hamper downside. This, particularly for shorter-term traders, is an appealing reversal zone, given the liquidity generated from the filled sell stops.
The combination of stop-taking beneath 1.11, the H4 AB=CD reversal zone at 1.1080/1.1092 and the 50-day SMA (on the daily timeframe) is likely sufficient to tempt buyers into the market today, at least for an intraday bounce higher. Traditional AB=CD take-profit targets favour the 38.2%/61.8% Fibonacci retracements set from legs A-D, at 1.1149 and 1.1183. Traders, however, are urged to also pencil in the 1.1125 January 3rd low as possible resistance.
As evident from the H4 chart, the 38.2% Fibonacci retracement ratio at 1.1149 was hit in recent trade, likely prompting longs out of 1.11 to reduce risk to breakeven and maybe even liquidate a portion of the position. Note this level converges closely with the 200-day SMA (orange – 1.1137) and a local daily channel support-turned resistance, extended from the low 1.0981.
As a reminder of where we stand on the weekly timeframe, here’s what Monday’s technical briefing had to say:
Technical research has weekly movement extending losses south of long-standing channel resistance, drawn from the high 1.1569. Visible downside objectives on this timeframe fall in at the 2016 yearly opening level at 1.0873 and channel support, taken from the low 1.1109. To the upside, assuming a break of the said channel resistance, price has the 2019 yearly opening level at 1.1445 to target.
In terms of the primary trend, price has been trading lower since topping in early 2018, at 1.2555.
Areas of consideration:
Should the market hold beyond the 38.2% H4 Fibonacci retracement ratio at 1.1149, longs from 1.11ish likely have eyes on the 61.8% H4 Fibonacci retracement ratio at 1.1183 for (AB=CD pattern) completion. The move higher has seen the 200-day SMA taken out, which could be retested as support today.
Expecting upside beyond the noted 61.8% H4 Fibonacci retracement ratio is chancy, knowing where we’re coming from on the weekly timeframe.
Well done to any readers still long this market.
GBP/USD:
Sterling witnessed early selling in London, pressured lower after a combination of softer inflation and dovish commentary from BoE’s Saunders. The Consumer Prices Index (CPI) 12-month rate was 1.3% in December 2019, down from 1.5% in November 2019, the Office for National Statistics reported Wednesday.
The early decline saw lows of 1.2984, though H4 price action swiftly reclaimed 1.30+ status and continued to higher ground throughout the US session.
Traders who read last Friday’s report may recall the following piece:
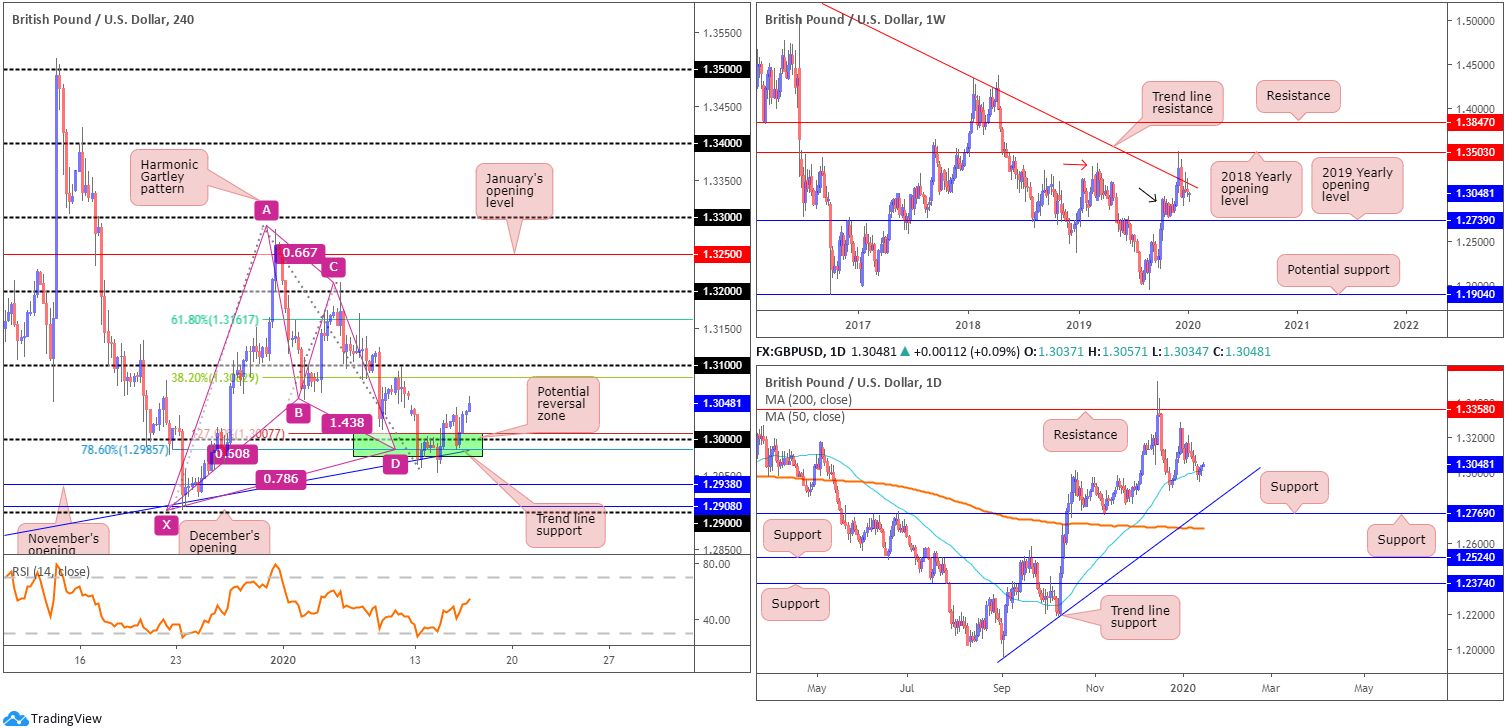
The key figure 1.30. Note (green) this level forms together with a potential H4 harmonic Gartley pattern, boasting an AB=CD equivalent formation and a 78.6% XA retracement at 1.2985 as well as a 127.2% BC projection at 1.3007. Additionally, there’s H4 trend line support, extended from the low 1.2768.
As evident from the H4 timeframe, the harmonic Gartley pattern is holding, with the unit testing highs of 1.3057.
As for the weekly timeframe, little change has been seen since Monday’s report:
Sellers, by way of back-to-back shooting star bearish candlestick patterns, continued to strengthen their grip off long-standing trend line resistance last week, pencilled in from the high 1.5930. This follows a somewhat dominant whipsaw to the 2018 yearly opening level drawn from 1.3503 four weeks ago. Buyers are attempting to defend nearby demand around the 1.2939 region (black arrow), seduced by the recent break of the notable high at 1.3380 (red arrow). The fact we’re holding the current trend line, though, implies we might see a push lower to the 2019 yearly opening level at 1.2739, consequently tripping sell stops from any traders long the aforementioned demand zone.
A closer reading on the daily timeframe shows the 50-day SMA (blue – 1.3015) remains in the frame. Recent movement witnessed a minor breach of the dynamic value to lows of 1.2954, though price is currently attempting to elbow its way north. In the event of a move lower, another layer of support that may eventually enter the fight on the daily chart is 1.2769, which happens to merge closely with trend line support, pencilled in from the low 1.1958 and the 200-day SMA (orange – 1.2687). With respect to resistance, the only level of interest right now sits at the 1.3284 December 31st high and 1.3358, which capped upside since mid-June 2019.
Areas of consideration:
The H4 Gartley pattern highlighted above had an entry point around the 1.30ish region, preferably the 78.6% Fibonacci retracement at 1.2985, with stop-loss order placement set beneath the X point – the 1.29 handle. In terms of take-profit targets, traders generally favour the 38.2%/61.8% (1.3082/1.3161) Fibonacci retracements of legs A-D; reduce risk to breakeven at 38.2% and take-profit at 61.8%.
AUD/USD:
Wednesday saw the US and China sign a trade deal that officials say will lead to a sharp increase in sales of US goods and services to China, further open Chinese markets to foreign firms—especially in financial services—and provide strong new protections for trade secrets and intellectual property (WSJ).
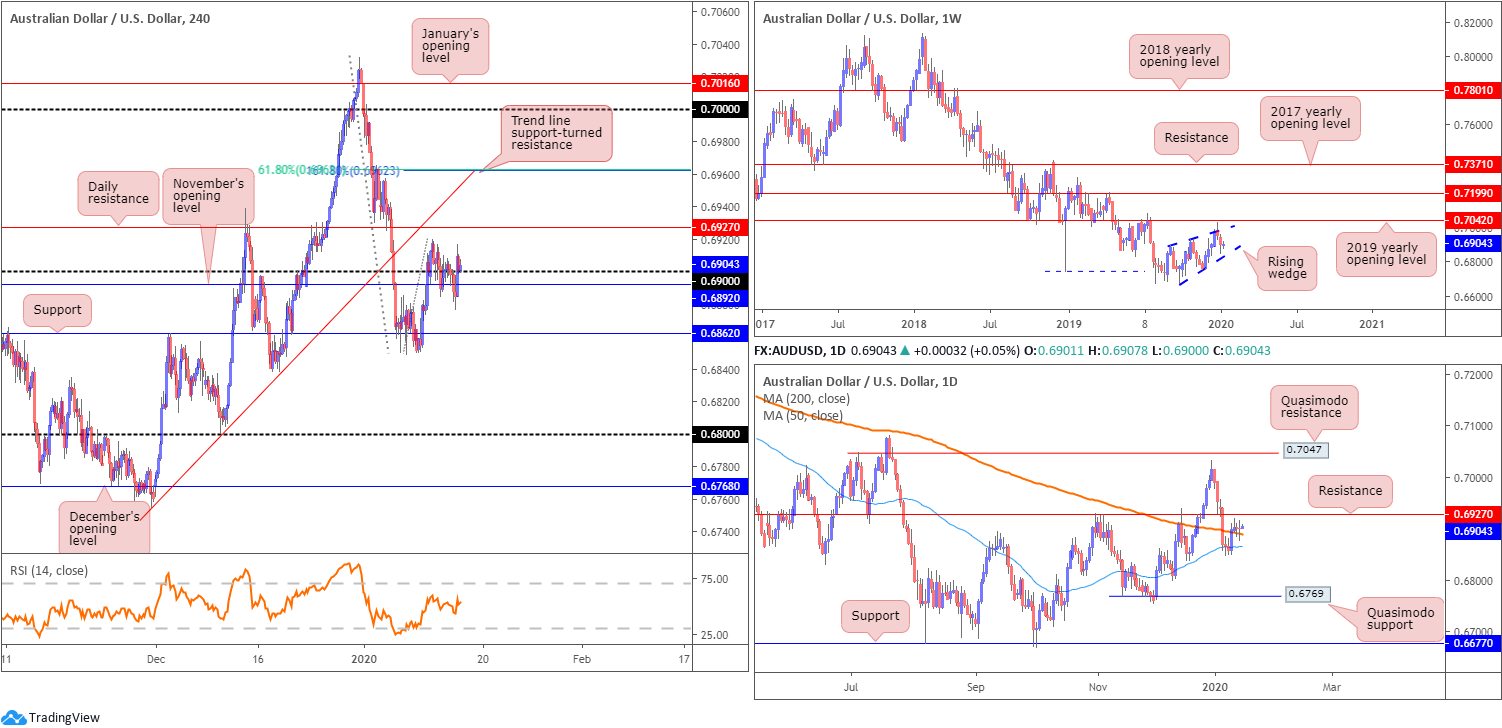
H4 price holds a touch above the 0.69 handle and November’s opening level at 0.6892 this morning. Resistance resides nearby in the form of a daily level at 0.6927, followed by a H4 trend line support-turned resistance, extended from the low 0.6754. Retaking November’s opening level from current price could lead to support at 0.6862 entering the fight.
Another point of interest on the H4 timeframe is the 161.8% Fibonacci extension at 0.6962 and a 61.8% Fibonacci retracement at 0.6963. Note these levels line up closely with the said H4 trend line resistance.
The situation on the weekly and daily timeframes remains unchanged:
Since registering a bottom in late September at 0.6670, AUD/USD has been busy carving out what appears to be a rising wedge formation, typically considered a continuation pattern. Recent selling witnessed price decline back into the rising wedge, with a break lower possible given the primary downtrend in this market has faced a southerly bearing since early 2018.
Withstanding a number of downside attempts, the 50-day SMA (blue – 0.6865) on the daily timeframe remained supportive last week, driving price marginally through the 200-day SMA (orange – 0.6890), which continues to hold as support. Resistance lies close by at 0.6927, with a break of this level exposing the 0.7031 December 31 high and Quasimodo resistance at 0.7047. Beyond the aforementioned 50-day SMA, however, active demand seems limited until reaching Quasimodo support coming in at 0.6769.
Areas of consideration:
In a nutshell, chart studies suggest further selling on the weekly timeframe, with a break of the rising wedge pattern potentially on the menu. Daily resistance at 0.6927, given its history, is likely to hold, potentially causing longs off the 200-day SMA problems.
Shorter-term movement houses an area of resistance around the 0.6960ish region (see above in bold). However, in order to get to this point, a move above the current daily resistance is required.
USD/JPY:
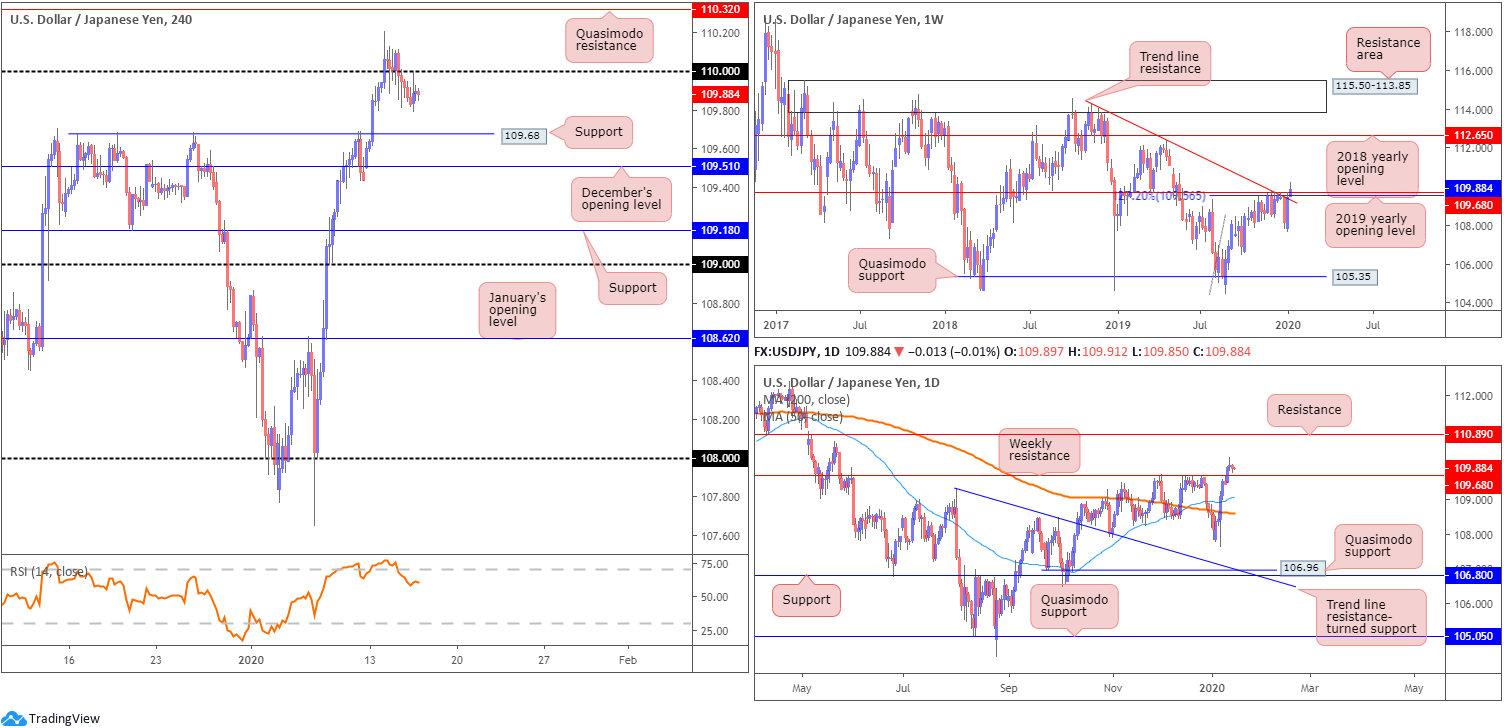
USD/JPY extended its subdued phase Wednesday, having priced in the ‘phase-one’ trade deal between the US and China. The pair, according to the H4 timeframe, continues to languish sub 110. This followed a test of highs on Tuesday at 110.21, leaving Quasimodo resistance at 110.32 unchallenged. Continued decline south of 110 may shake hands with support coming in at 109.68 (aligns with weekly resistance – see below).
On a wider perspective, weekly resistances (comprised of a 127.2% Fibonacci extension at 109.56 [taken from the low 104.44], the 2019 yearly opening level at 109.68 and trend line resistance, extended from the high 114.23) gave way in recent trading, perhaps setting a long-term stage for a run to the 2018 yearly opening level at 112.65. A decisive weekly close above the said resistances would add conviction to this theory.
A closer reading of price action on the daily timeframe shows price crossed weekly resistance in the shape of a near-full-bodied bullish candle Monday. This possibly clears the river north towards resistance at 110.89.
Areas of consideration:
Although H4 price holds beneath the 110 handle, portending lower levels, the higher timeframes trading a touch above weekly resistances highlight cautious selling.
Selling at current prices has limited space to profit; weekly resistance (also H4 support) at 109.68 may hamper downside.
The area between 109.68 and December’s opening level at 109.51 could offer a platform for longs today. A H4 bullish candlestick signal formed within this boundary (entry and risk levels can be fixed according to the candlestick pattern) will likely drive enough interest to revisit 110 and potentially beyond.
USD/CAD:
The US dollar wrapped up Wednesday a shade lower against its Canadian counterpart, down 20 points, or 0.15%.
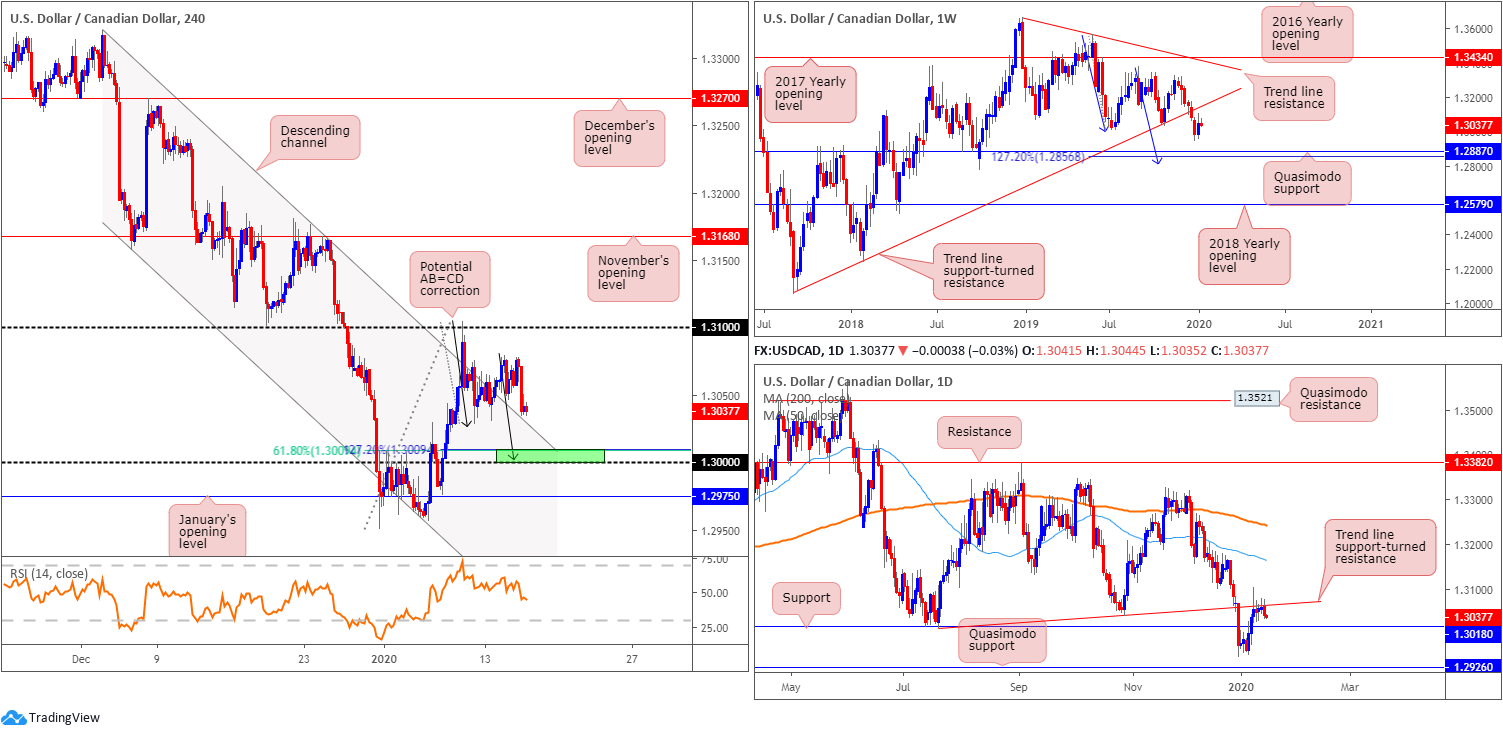
Technical research has the H4 candles hovering a few points north of channel resistance-turned support, taken from the high 1.3320. Another interesting area of support resides close by around the key figure 1.30, bolstered (green) by a potential AB=CD correction (black arrows), a 61.8% Fibonacci retracement at 1.3009 and a 127.2% Fibonacci extension at the same value. Indicator-based traders may also wish to acknowledge the relative strength index (RSI) recently popped back beneath its 50.0 value, signalling bearish movement.
Structure on the weekly timeframe shows price could potentially swing either way. To the upside, we have trend line support-turned resistance, extended from the low 1.2061. Lower on the curve, the pair exhibits scope to test Quasimodo support at 1.2887, positioned close by a 127.2% AB=CD bullish correction (blue arrows) at 1.2856. The immediate trend has faced north since bottoming in September 2017; however, this move could also be considered a deep pullback in a larger downtrend from the 1.4689 peak in early January 2016.
The story on the daily timeframe has price action fading the underside of a trend line support-turned resistance, taken from the low 1.3015. Sellers from this point, nonetheless, may find active buyers off support at 1.3018.
Areas of consideration:
The key figure 1.30. This level – coupled with H4 AB=CD confluence, H4 Fibonacci studies and daily support at 1.3018 – is likely to entice buyers into the market. Traders threatened by the possibility of a fakeout materialising through 1.30 (common viewing around psychological levels) may wait for additional candlestick confirmation to form before pulling the trigger. Not only will this help identify buyer intent, the candle signal provides entry and risk levels to work with.
USD/CHF:
USD/CHF recorded its fourth successive loss Wednesday, erasing more than 30 points, or 0.33%.
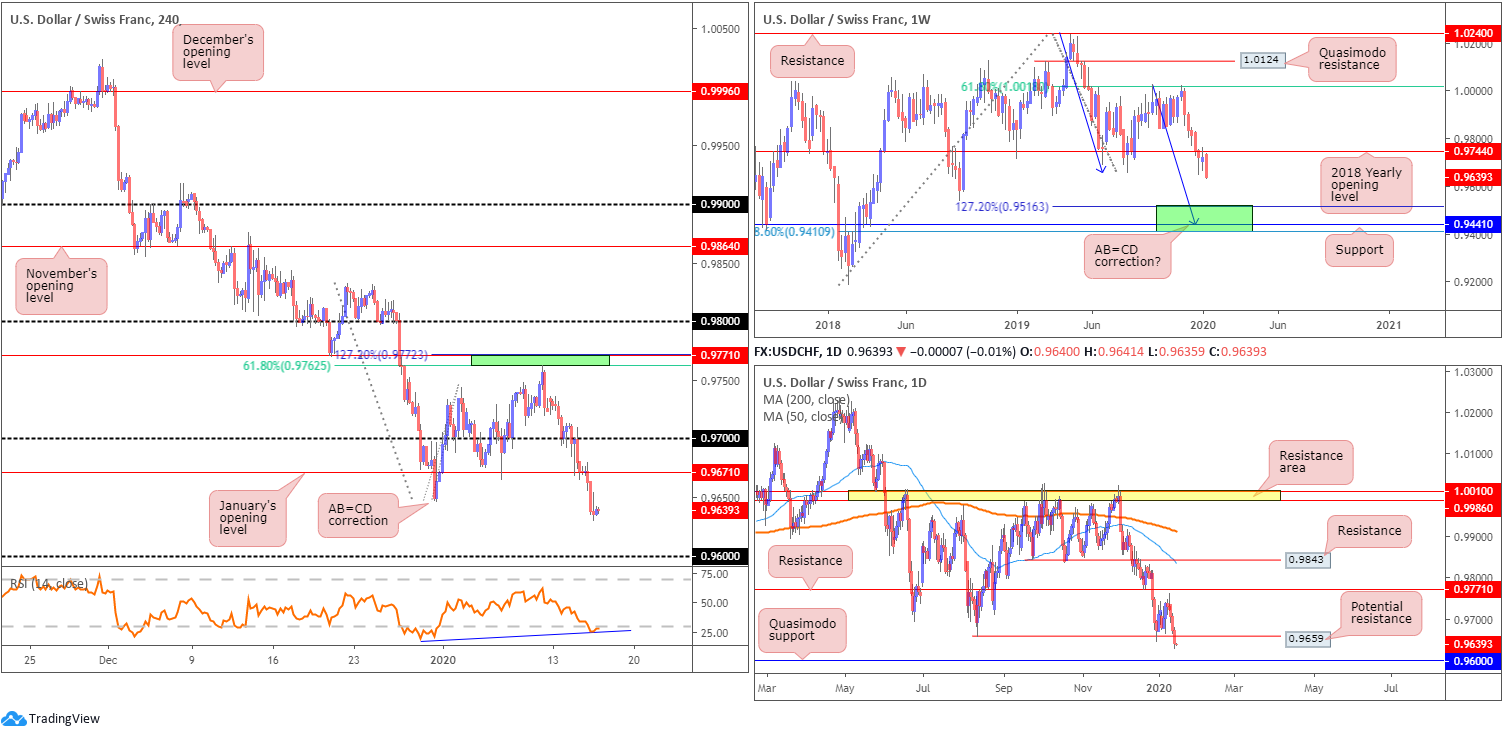
Shedding nearly 1.00% on the week so far, January’s opening level at 0.9671, despite an earnest attempt to offer support, gave way amid early London hours. Although the relative strength index (RSI) is producing bullish divergence within oversold territory, additional downside could be in store to the 0.96 handle. What’s also interesting from a technical standpoint here is 0.96 also represents daily Quasimodo support, which recently moved into view following a break of 0.9659.
Higher-timeframe technical analysis has weekly price establishing firm ground south of the 2018 yearly opening level at 0.9744. The next downside target sits in the range of 0.9410/0.9516 (comprised of a 78.6% Fibonacci retracement at 0.9410, support at 0.9441 and a 127.2% AB=CD bullish correction [black arrows] at 0.9516 – green]).
Areas of consideration:
Traders short from 0.9772/0.9762 are currently in a fantastic position, with further profits likely on the horizon. As highlighted above, the next downside target falls in at 0.9600.
Owing to the noted chart studies, a pullback/retest at January’s opening level 0.9674 may serve as a sell zone for many traders, given daily resistance also lurking close by at 0.9659. Aggressive stop-loss placement is seen around 0.9682; conservative traders may opt to position risk according to the rejection candle, if any.
Dow Jones Industrial Average:
US stocks climbed Wednesday after the United States and China signed a Phase one trade agreement and pledged to resolve a tariff dispute that has roiled financial markets for over a year. The centrepiece of the truce is a pledge by China to purchase at least an additional $200 billion worth of US farm products and other goods and services over two years, over a baseline of $186 billion in purchases in 2017 (Reuters). The Dow added 90.55 points, or 0.31%; the S&P 500 advanced 6.15 points, or 0.19% and the tech-heavy Nasdaq 100 ended mostly unchanged.
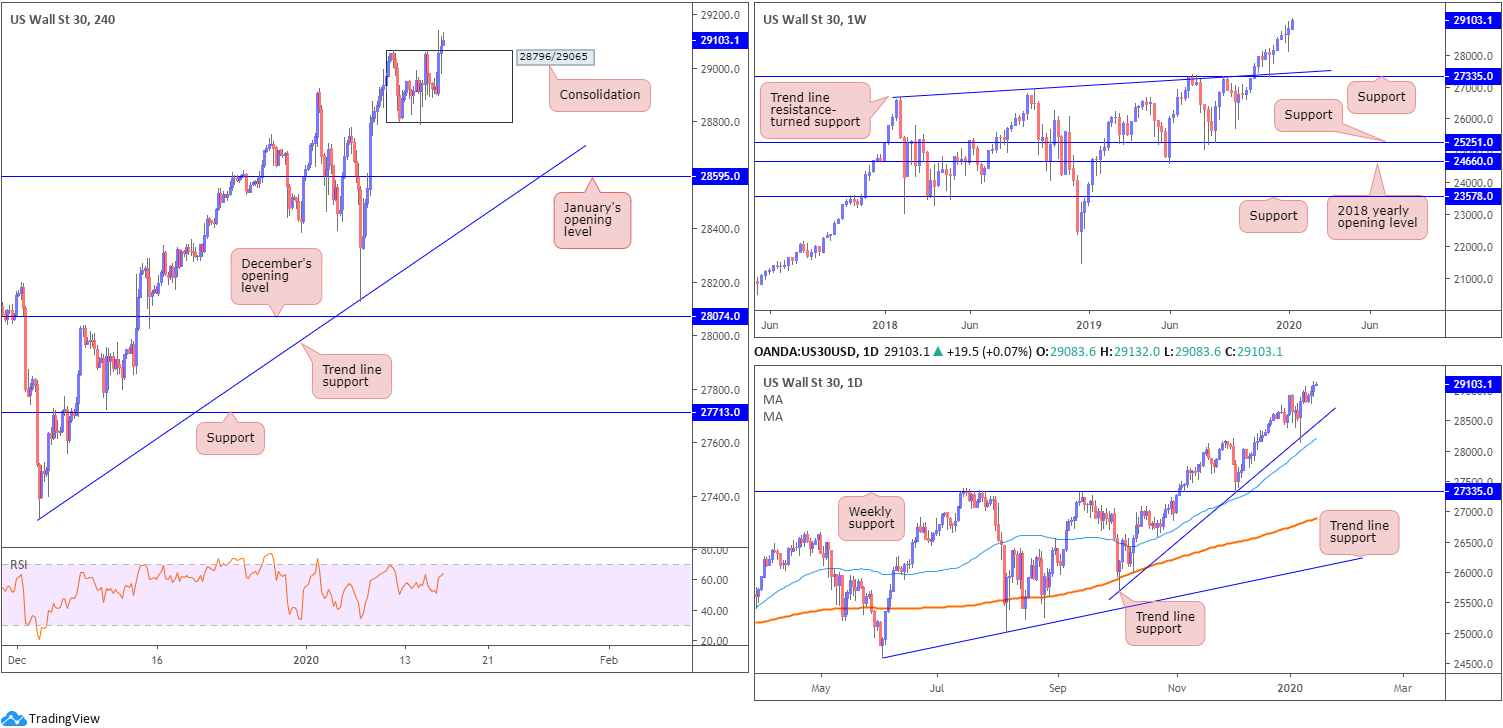
Since Friday clocked an all-time high of 29065, the H4 candles had been busy carving a consolidation between the said high and 28796. Wednesday’s technical briefing aired the following:
Given the primary trend faces north, a break to the upside is expected. However, in the event we turn lower, January’s opening level at 28595 rests as the next support, which happens to align with a 50.0% retracement ratio (removed).
As evident from the H4 chart this morning, a breakout north occurred, reaching an all-time high of 29140 and leaving the top edge of the noted consolidation open for a retest.
Technical research on the weekly timeframe enters Thursday unchanged:
Following a weekly hammer candlestick pattern (considered a buy signal at troughs), formed six weeks back at the retest of support drawn from 27335, along with trend line support etched from the high 26670, the index continued to advance higher.
The daily timeframe also displays unchanged analysis:
Trend line support, extended from the low 25710, entered the fray, bolstered by additional support located nearby from the 50-day SMA (blue – 28214).
Areas of consideration:
With the uptrend remaining strong, and daily price trading from trend line support, traders likely have eyes on a retest play at the top edge of the recently broken H4 consolidation 29065. A retest of this base, preferably in the shape of a H4 bullish candlestick signal (entry/risk levels can be determined according to this formation), would likely be sufficient for traders seeking to join this seemingly everlasting trend.
XAU/USD (GOLD):
In recent sessions, XAU/USD explored higher ground, notching gains of $10, or 0.64%.
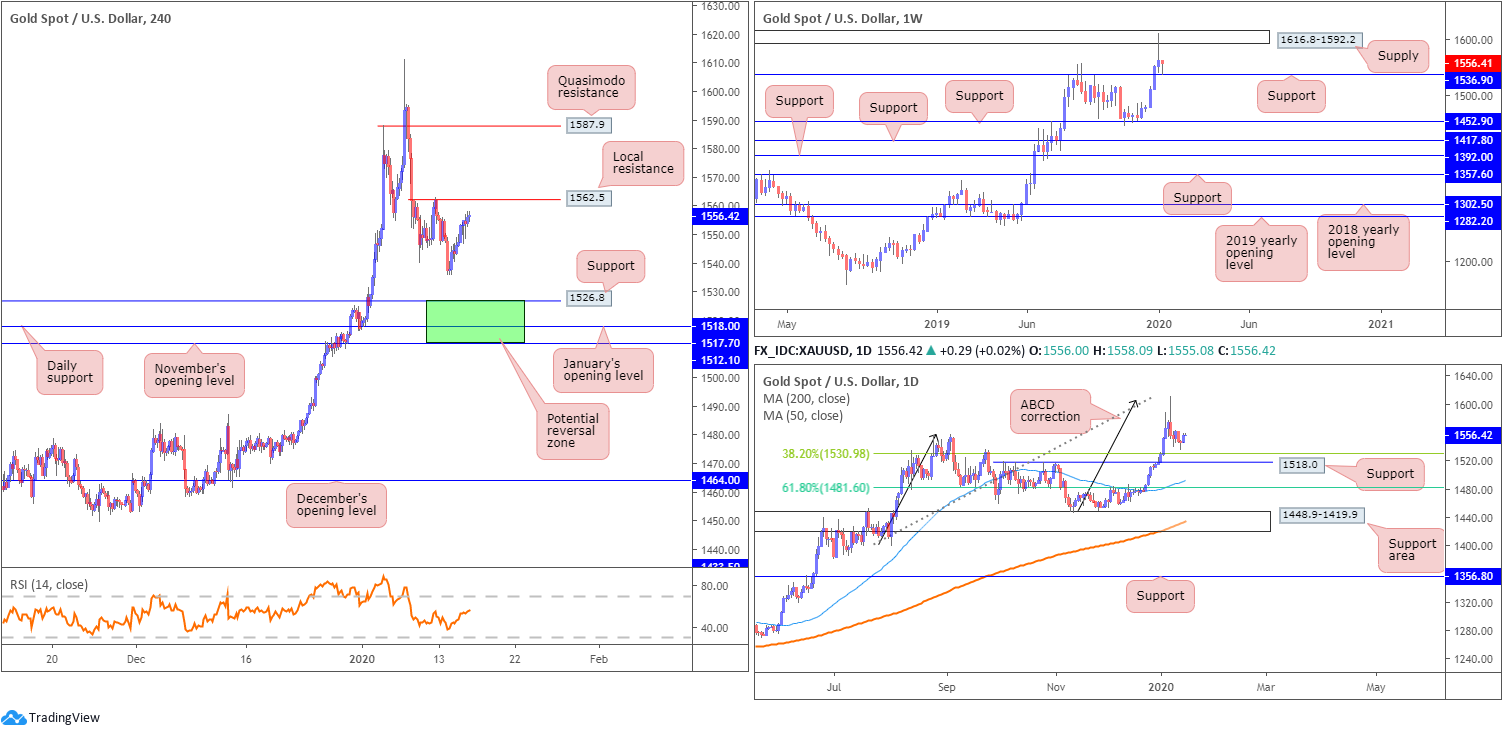
The top of the technical pile has weekly price recovering from support at 1536.9, following a dominant rejection out of supply at 1616.8-1592.2. A violation of the said support could prompt additional selling towards another layer of support residing at 1452.9.
A potential point of support worth bearing in mind on the daily timeframe is the 38.2% Fibonacci retracement at 1530.9, closely followed by 1518.0. The latter may form an initial take-profit target for traders short the ABCD bearish correction (black arrows) at 1608.0.
H4 structure also displays an area of support (green) between November’s opening level at 1512.1 and support at 1526.8 (daily support at 1518.0 and January’s opening level at 1517.7 seen within). Resistance, on the other hand, may form off 1562.5, though a break of this barrier suggests a run towards Quasimodo resistance plotted at 1587.9.
Areas of consideration:
Should a selloff occur, 1512.1/1526.8 on the H4 timeframe may be a zone worth watching for signs of buyer intent. Not only does it boast a strong mix of confluence, the support zone forms in line with the primary trend.
Continued buying, along with a H4 close north of H4 resistance at 1562.5, also unlocks the door to potential bullish themes, targeting H4 Quasimodo resistance at 1587.9, closely shadowed by the lower edge of weekly supply at 1592.2.
The accuracy, completeness and timeliness of the information contained on this site cannot be guaranteed. IC Markets does not warranty, guarantee or make any representations, or assume any liability regarding financial results based on the use of the information in the site.
News, views, opinions, recommendations and other information obtained from sources outside of www.icmarkets.com.au, used in this site are believed to be reliable, but we cannot guarantee their accuracy or completeness. All such information is subject to change at any time without notice. IC Markets assumes no responsibility for the content of any linked site.
The fact that such links may exist does not indicate approval or endorsement of any material contained on any linked site. IC Markets is not liable for any harm caused by the transmission, through accessing the services or information on this site, of a computer virus, or other computer code or programming device that might be used to access, delete, damage, disable, disrupt or otherwise impede in any manner, the operation of the site or of any user’s software, hardware, data or property.


