
EUR/USD:
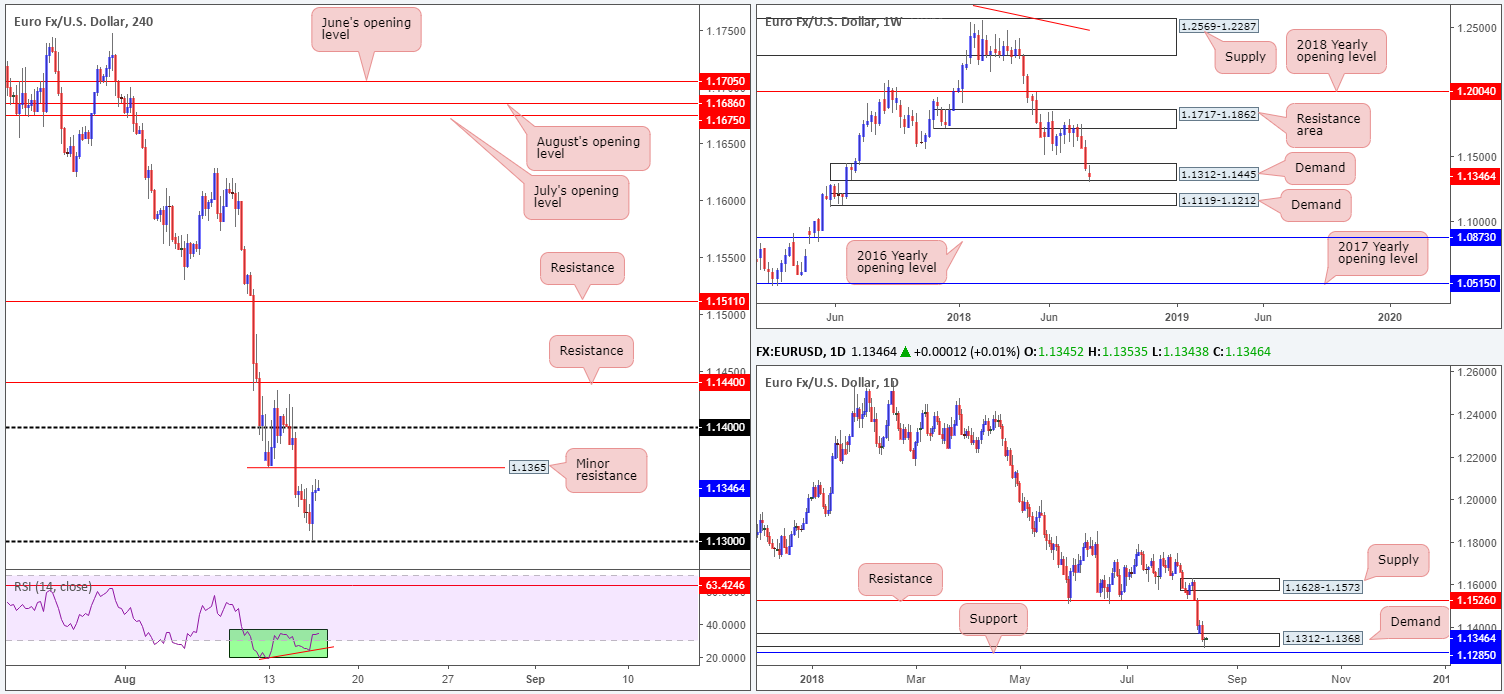
Selling, as is evident from the H4 timeframe, came to a pause just north of the 1.13 handle in the early hours of US trade on Wednesday. Nudged higher largely on USD selling from 2018 highs of 96.98 (US dollar index), the single currency managed to trim Asia/early European session losses, though did level off from session highs of 1.1354 to end the day pretty much unchanged. Of particular interest on the H4 scale is the nearby swing resistance marked at 1.1365, followed by the 1.14 handle.
The story over on the bigger picture shows weekly price marginally nudged beneath demand at 1.1312-1.1445, possibly activating nearby demand at 1.1119-1.1212. Supporting the current weekly demand, however, is a partner demand seen on the daily timeframe at 1.1312-1.1368. Yesterday’s minor break of this zone has brought daily support at 1.1285 into view. Another thing to keep in mind on the daily timeframe is yesterday’s movement penciled in a reasonably nice-looking bullish pin-bar formation.
Areas of consideration:
The future of the current demand areas mentioned above on the higher timeframes are unclear at the moment. Buying based on these ranges is problematic knowing we have broken the lower edges and potentially tripped stop-loss orders. And selling when we know price has yet to close outside of these zones is similarly chancy, in our humble view.
Intraday, keep the 1.13 handle, the swing H4 resistance at 1.1365 and the 1.14 handle on the watchlists, traders. Though confluence from these barriers is somewhat limited, bounces from any of these obstacles could take place today.
Today’s data points: US building permits and housing starts; Philly Fed manufacturing index; US unemployment claims.
GBP/USD:
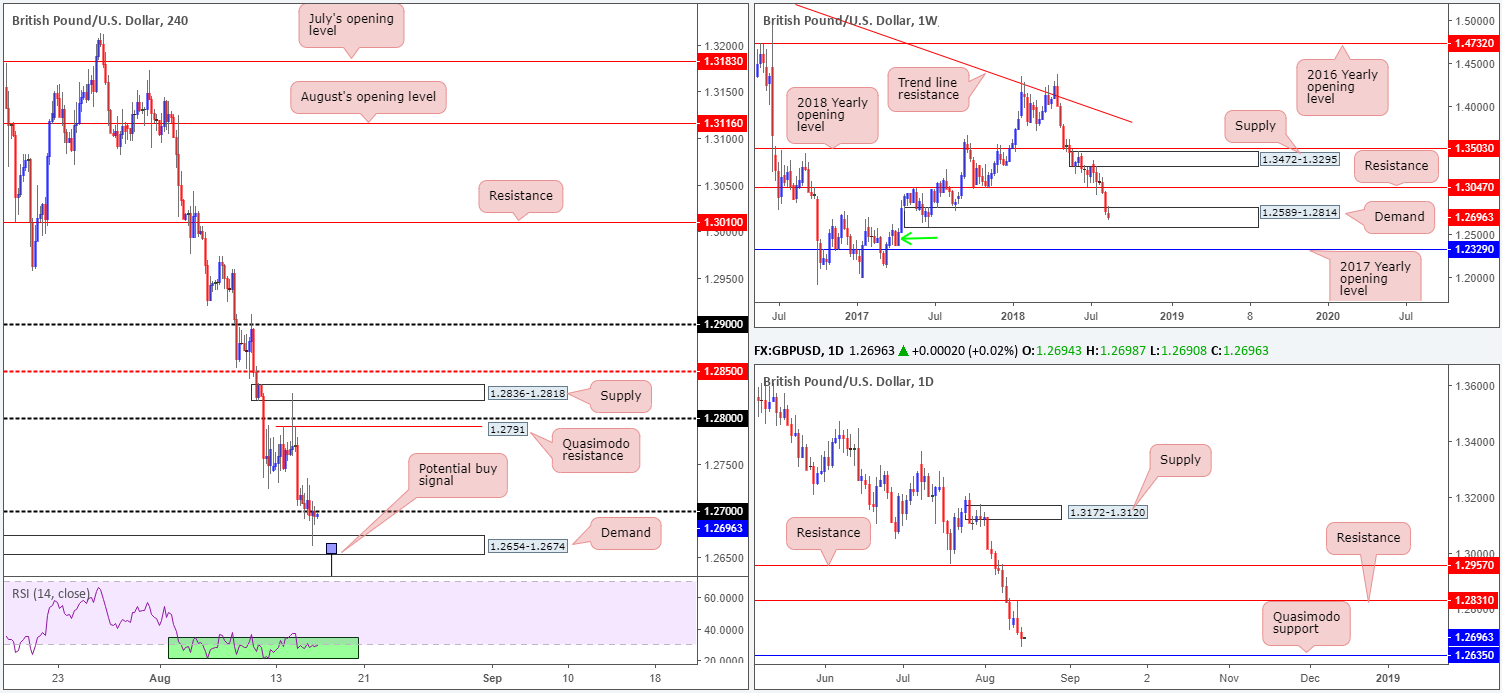
Sterling derived little traction from Wednesday’s headline y/y UK CPI, with the report coming in as expected. Cable, as is shown on the H4 chart, extended its downside presence yesterday, striking fresh 2018 lows around 1.2661 having failed to retain 1.27+ status. As traders debate the pound’s future sub 1.27, it may be worth noting the H4 demand at 1.2654-1.2674 currently in play.
In addition to the above, let’s remember where we are trading from and possibly heading to on the higher timeframes. Weekly players are seen trading within the walls of a demand zone at 1.2589-1.2814, though has, as of yet, failed to produce anything meaningful to the upside here. Daily action, on the other hand, exhibits potential to drive as far south as a Quasimodo support located at 1.2635.
Areas of consideration:
With the daily Quasimodo support urging daily action to press lower, not only might we witness further selling into the aforementioned weekly demand zone, we may also see the current H4 demand engulfed, given the area is positioned around 20 pips above the daily level.
On account of the above, should a H4 bullish pin-bar formation take shape that pierces through the lower edge of the noted H4 demand and taps the daily Quasimodo support, a long on the close of this candle could be an option, targeting 1.27 as the initial take-profit zone.
Today’s data points: UK retail sales m/m; US building permits and housing starts; Philly Fed manufacturing index; US unemployment claims.
AUD/USD:
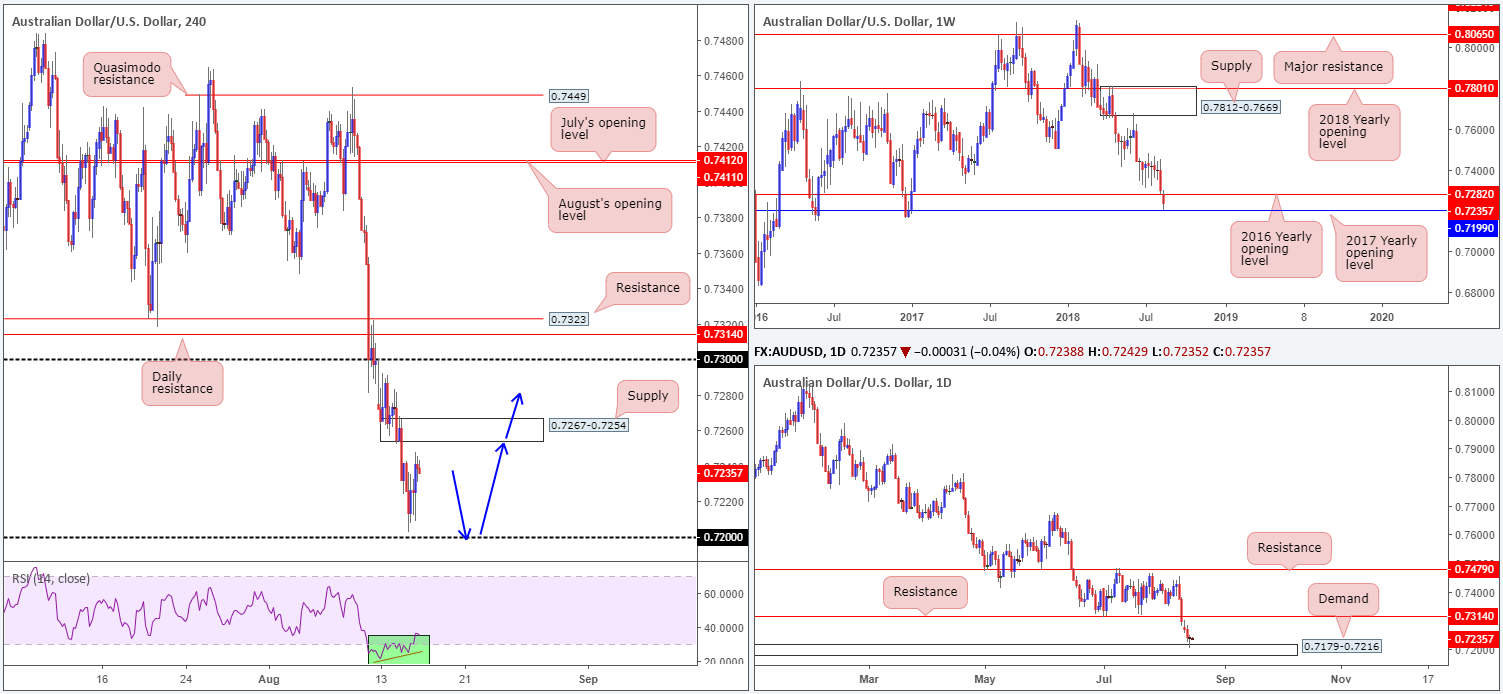
Following a modest recovery just north of the 0.72 handle on Wednesday, largely backed by a dip in the USD from 2018 highs of 96.98 (US dollar index), the H4 candles are seen poised to challenge nearby H4 supply at 0.7267-0.7254. Beyond this area the unit may head for 0.73, and quite possibly the daily resistance parked just above it at 0.7314.
Daily demand at 0.7179-0.7216, as you can see, was also brought into the fold on Wednesday in the shape of a bullish pin-bar formation. Note this area also happens to encase the 2017 yearly opening level on the weekly timeframe at 0.7199, which came within a stone’s throw away from seeing some action!
As traders await the latest employment figures from Australia this morning, our technical read shows the market may be looking to press higher, at least until we reach 0.7282: the underside of the 2016 yearly opening level on the weekly timeframe (the next upside target on that scale).
Areas of consideration:
Entering long at current price, knowing H4 action is seen lurking just beneath supply, is not considered a high-probability move since active sellers may reside here! The alternative is to wait and see if H4 price pulls back and tests 0.72, breaking yesterday’s low 0.7202. Besides bringing in buyers from 0.72, the move would likely trigger buy orders from the 2017 (weekly) yearly open level at 0.7199. Knowing all of this remains encapsulated within the confines of the current daily demand, longs from 0.72 to the noted H4 supply/2016 yearly opening level (blue arrows) are high probability, allowing traders to position stops just beneath the daily zone around 0.7177ish.
Today’s data points: Australian job’s figures; US building permits and housing starts; Philly Fed manufacturing index; US unemployment claims.
USD/JPY:
During the course of yesterday’s sessions the USD/JPY reclaimed all of Tuesday’s gains, consequently breaking through the 111 handle on the H4 timeframe and aggressively challenging July’s opening level at 110.65. Wednesday’s move lower also chalked up a clear-cut daily bearish engulfing candle, bringing the unit back to daily demand at 110.28-110.78. Defending upside, however, the weekly trend line resistance-turned support (taken from the high 123.57) remains intact.
In the event the market witnesses a close beneath July’s opening level at 110.65, the 110 handle is likely the next port of call. This psychological boundary should be of interest for a possible bounce higher, due to it fusing closely with a 61.8% Fib support at 110.04 (extended from the low 108.11) and a nearby H4 channel support (etched from the low 110.91). The only grumble is 110 is seen below the current daily demand zone!
Areas of consideration:
Keeping it Simple Simon this morning, traders are urged to consider the 110 boundary as a possible platform for longs today. To be on the safe side, though, waiting for a full or near-full-bodied H4 bull candle to form is advised (stops best placed beyond the rejecting candle’s tail). This will help avoid being taken out on a whipsaw through 110, which is common viewing around psychological levels. Ultimately, the first take-profit target can be set around 110.65, though keep in mind the underside of demand at 110.28 (possible resistance at that point) could hinder upside, too.
Today’s data points: US building permits and housing starts; Philly Fed manufacturing index; US unemployment claims.

USD/CAD:
While the USD is seen struggling to retain its upside presence at the moment, the USD/CAD managed to push into positive territory on Wednesday and reclaim all of Tuesday’s losses amid falling crude oil prices.
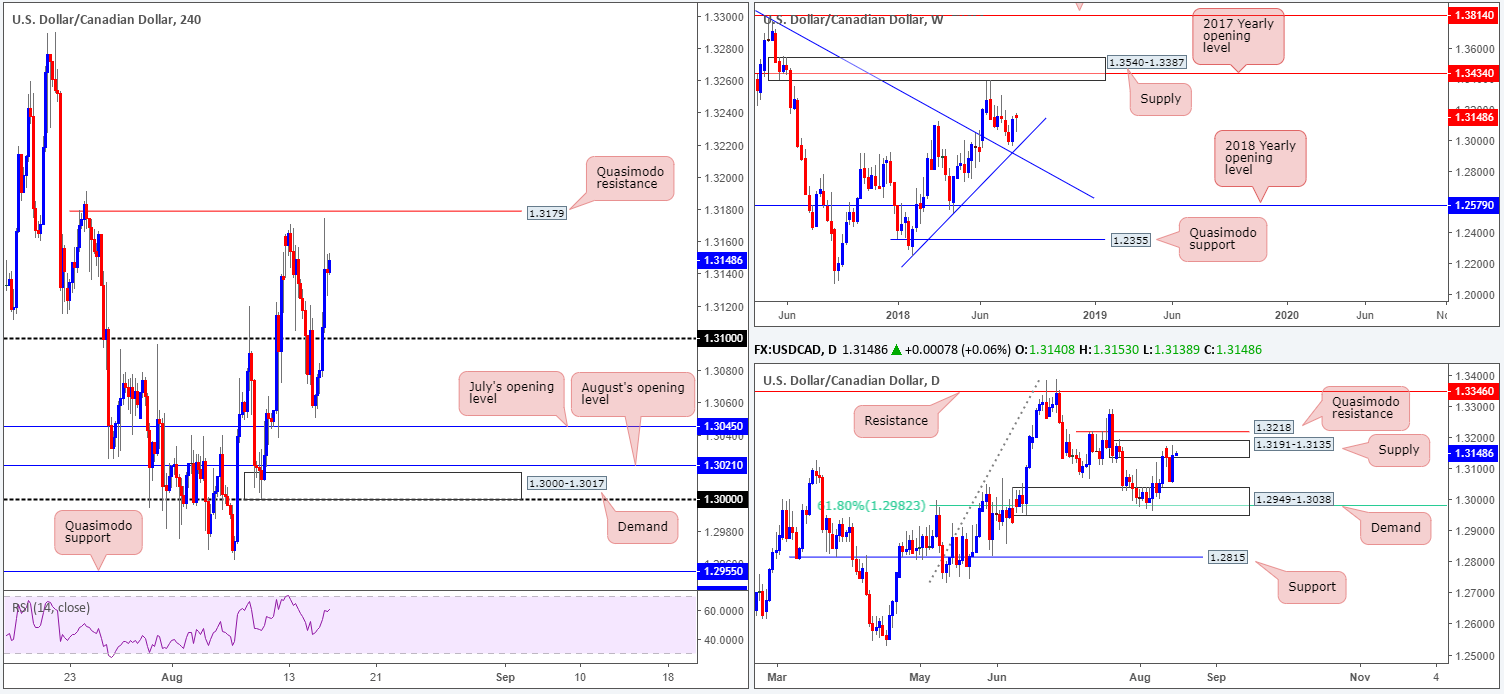
Leaving July’s opening level at 1.3045 unchallenged, H4 price hit the brakes and turned higher. The 1.31 handle put up little fight, permitting the candles to challenge, and marginally surpass, Monday’s high 1.3170 and come within a stone’s throw away from testing a H4 Quasimodo resistance level at 1.3179.
The story on the daily timeframe shows supply at 1.3191-1.3135 is back in the fight. A break of this area, however, has the nearby Quasimodo resistance at 1.3218 to target. Higher up on the curve, nevertheless, weekly price appears somewhat confined between two trend line supports (1.2247/1.4689) right now. To the upside on this scale, keep tabs on supply penciled in at 1.3540-1.3387, which happens to fuse with a 2017 yearly opening level at 1.3434.
Areas of consideration:
In view of the H4 Quasimodo resistance level at 1.3179 sited within the upper limits of the current daily supply zone, a sell from here could be something to watch today. Also worth noting is the option of positioning stops above the daily supply zone around the 1.3193ish neighborhood. In terms of take-profit targets from 1.3179, the 1.31 handle appears to be the logical barrier, as far as we can see.
Today’s data points: US building permits and housing starts; Philly Fed manufacturing index; US unemployment claims; Canadian manufacturing sales m/m.
USD/CHF:
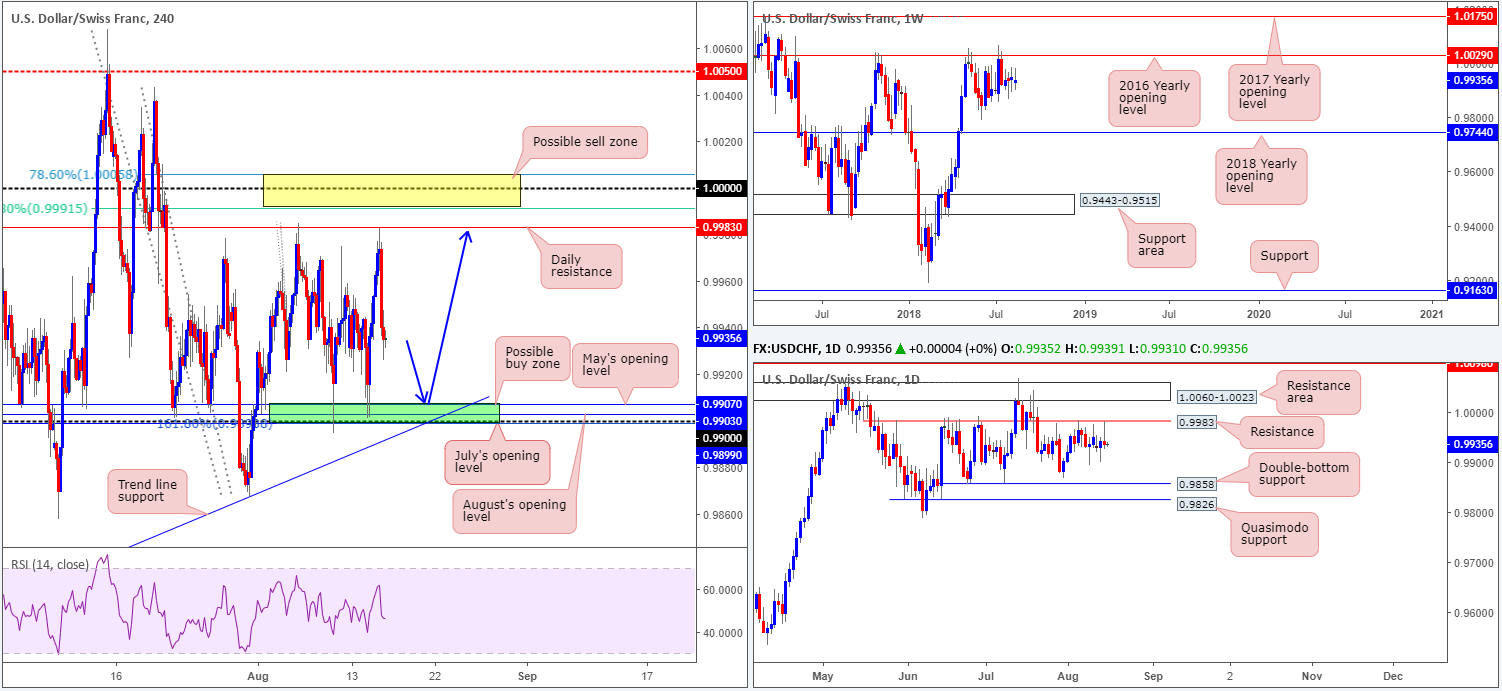
On the back of a sliding USD (US dollar index down from 2018 highs of 96.98), the USD/CHF failed to reach parity (1.0000) on Wednesday. In its place, the market turned at a daily resistance level drawn from 0.9983. Essentially, this market has been range bound for nearly two weeks between the aforesaid daily resistance level and a H4 buy zone marked in green at 0.9899/0.9907 (comprised of July’s opening level at 0.9899, a 161.8% Fib ext. point at 0.9899 [taken from the high 0.9984], the 0.99 handle, August’s opening level at 0.9903 and May’s opening level at 0.9907). This green zone remains a point of interest for longs, given its confluence.
In addition to this, the team has noted to keep eyeballs on parity (1.0000). Although this number is seen outside of the current H4 range, surrounding this widely watched number are two Fibonacci resistances: 78.6% at 1.0005 and 61.8% at 0.9991 (yellow zone), making it a reasonable sell zone to consider in the future.
As can be seen on the weekly timeframe, price action continues to consolidate just south of a key resistance at 1.0029: the 2016 yearly opening level. Holding price lower on two occasions in 2017, and twice already in 2018, this level commands attention! Downside supports to keep eyeballs on from here fall in at June’s low 0.9788, followed by the 2018 yearly opening level at 0.9744.
Daily resistance at 0.9983, as highlighted above, continues to cap upside at the moment (note yesterday’s daily bearish pin-bar formation off this level). In the event of a break north, nonetheless, the resistance area planted at 1.0060-1.0023 (holds the 2016 yearly opening level at 1.0029 mentioned on the weekly timeframe) is likely the next base in the firing range. A move lower from current price, on the other hand, has 0.9858 in view: a double-bottom support, shadowed closely by Quasimodo support at 0.9826.
Areas of consideration:
For folks looking to fade the nearby green H4 buy zone today, waiting for additional H4 candle confirmation prior to pulling the trigger is advised (preferably in the shape of a full or near-full-bodied bull candle). The reason being is round numbers (0.99) tend to attract ‘stop runs’ (fakeouts). There’s little worse than having your stop-loss order triggered by a hair only to watch price shortly after hit your take-profit area, which in this case would be the opposing H4 range extreme: daily resistance at 0.9983 (also a valid sell zone by and of itself).
Today’s data points: US building permits and housing starts; Philly Fed manufacturing index; US unemployment claims.
Dow Jones Industrial Average:
Reversing all of the previous session’s positive move, the DJIA tumbled lower on Wednesday amid fears of a possible contagion effect on regions with exposure to Turkey, despite signs of stability in the Turkish Lira. In addition to this, though, trade tensions resurfaced after Turkey doubled tariffs on some US imports in response to the US President Donald Trump’s move to raise duties on Turkish aluminium and steel.
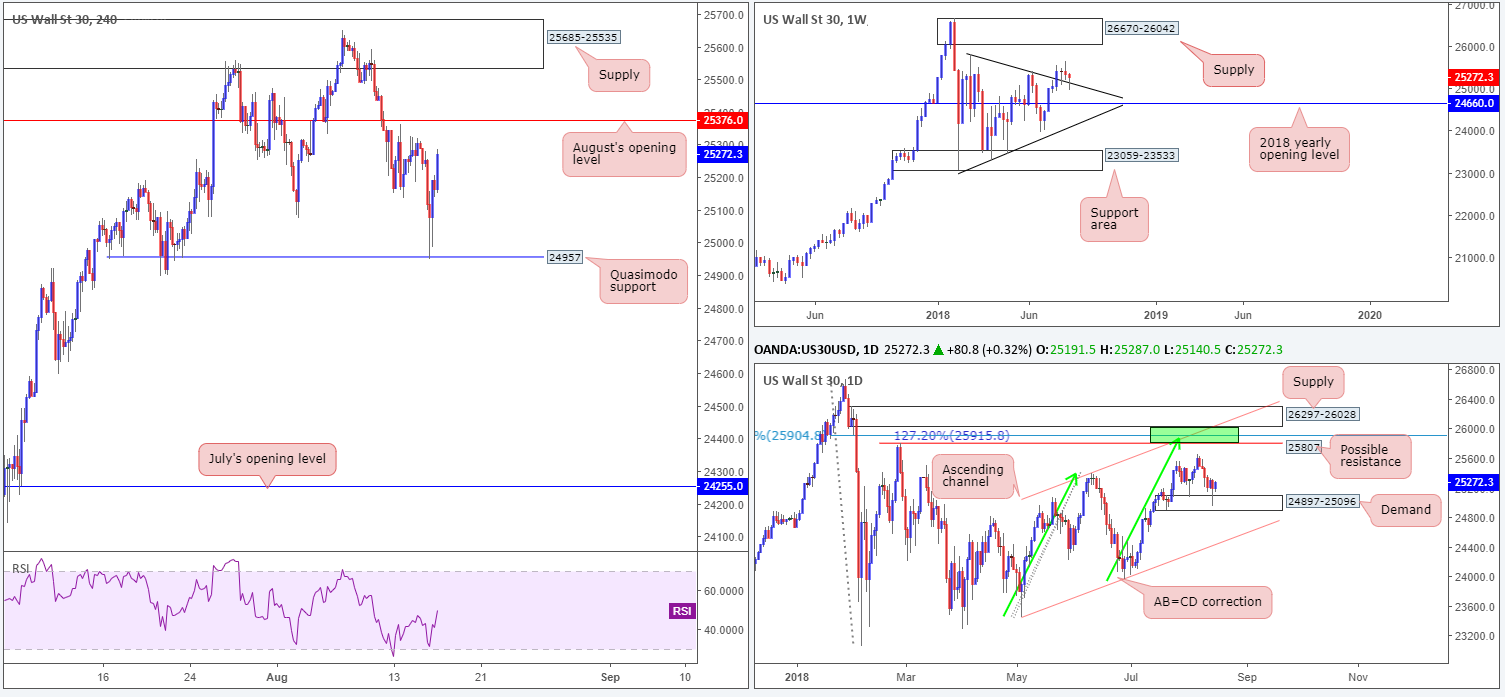
From a technical perspective, H4 price brought in a Quasimodo support at 24957 yesterday, which happens to be positioned within the walls of a daily demand zone at 24897-25096. Further adding to this, the index is seen retesting a weekly trend line resistance-turned support (etched from the high 25807). From here, a run up to weekly supply at 26670-26042 is potentially on the cards. The next upside target on the H4 scale, however, is seen nearby at 25376: August’s opening level.
Areas of consideration:
In the event a push above August’s opening level takes shape (next upside target on the H4 scale), traders can expect follow-through buying towards H4 supply at 25685-25535. A retest of 25376 as support would, in our view, be enough evidence to suggest an intraday long position here.
Today’s data points: US building permits and housing starts; Philly Fed manufacturing index; US unemployment claims.
XAU/USD (Gold)
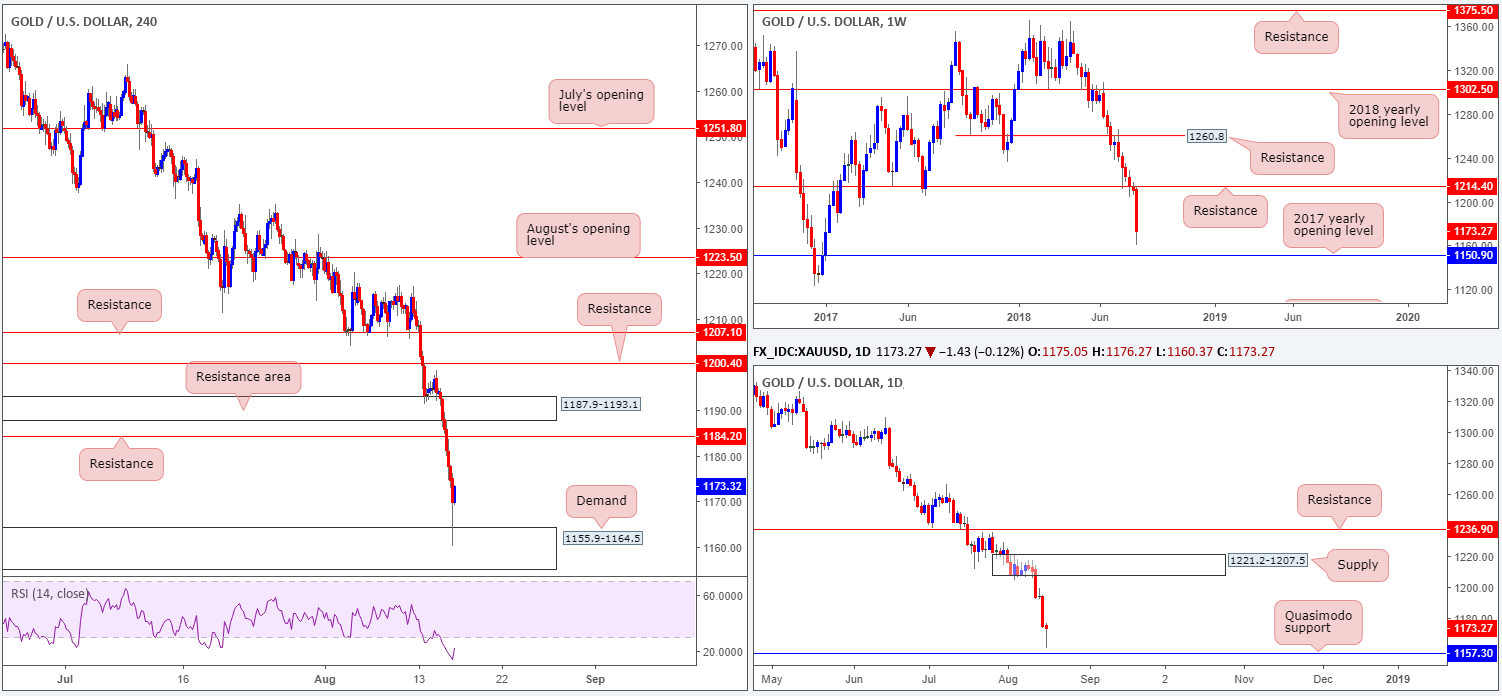
Bullion, as you can see, came under heavy selling pressure on Wednesday, breaking through H4 demand at 1187.9-1193.1 (now acting resistance zone), along with nearby H4 support at 1184.2 (also now acting resistance), consequently permitting the H4 candles to test H4 demand plotted at 1155.9-1164.5.
Weekly movement continues to emphasize a strong bearish tone beneath resistance at 1214.4, as the unit approaches the 2017 yearly opening level at 1150.9. A closer look at price action on the daily timeframe, however, shows potential support offered around the 1157.3 neighborhood: a Quasimodo support level.
Areas of consideration:
The only area worthy of attention for longs right now is between the 2017 yearly opening level mentioned above on the weekly timeframe at 1150.9 and the daily Quasimodo support at 1157.3. Note that the top edge of this area is actually fixed within the lower limits of the current H4 demand. Therefore, a H4 full or near-full-bodied bull candle printed between 1150.9/1157.3 would, according to the technical structure, likely be enough to encourage buyers into the market, targeting H4 resistance at 1184.2 as the initial take-profit zone.
The use of the site is agreement that the site is for informational and educational purposes only and does not constitute advice in any form in the furtherance of any trade or trading decisions.
The accuracy, completeness and timeliness of the information contained on tis site cannot be guaranteed. IC Markets does not warranty, guarantee or make any representations, or assume any liability with regard to financial results based on the use of the information in the site
News, views, opinions, recommendations and other information obtained from sources outside of www.icmarkets.com.au, used in this site are believed to be reliable, but we cannot guarantee their accuracy or completeness. All such information is subject to change at any time without notice. IC Markets assumes no responsibility for the content of any linked site. The fact that such links may exist does not indicate approval or endorsement of any material contained on any linked site.
IC Markets is not liable for any harm caused by the transmission, through accessing the services or information on this site, of a computer virus, or other computer code or programming device that might be used to access, delete, damage, disable, disrupt or otherwise impede in any manner, the operation of the site or of any user’s software, hardware, data or property.


