
A note on lower timeframe confirming price action…
Waiting for lower timeframe confirmation is our main tool to confirm strength within higher timeframe zones, and has really been the key to our trading success. It takes a little time to understand the subtle nuances, however, as each trade is never the same, but once you master the rhythm so to speak, you will be saved from countless unnecessary losing trades. The following is a list of what we look for:
- A break/retest of supply or demand dependent on which way you’re trading.
- A trendline break/retest.
- Buying/selling tails/wicks – essentially we look for a cluster of very obvious spikes off of lower timeframe support and resistance levels within the higher timeframe zone.
- Candlestick patterns. We tend to only stick with pin bars and engulfing bars as these have proven to be the most effective.
We search for lower timeframe confirmation between the M15 and H1 timeframes, since most of our higher-timeframe areas begin with the H4. Stops are usually placed 5-10 pips beyond confirming structures.
EUR/USD:
Going into the early hours of yesterday’s US session, the shared currency gathered momentum, consequently breaching and closing above the H4 mid-way resistance 1.1250. However, as you can see, price failed to sustain gains beyond this mark and closed back below the mid-way point by the day’s end. Despite the earnest seen attempt from the bulls yesterday, the overall structure of this pair has not changed since the week’s open.
Higher-timeframe technicals show that weekly action remains positioned around the underside of a major resistance area coming in at 1.1533-1.1278. Daily price, however, is seen flirting with the top edge of a support area drawn from 1.1224-1.1072, but as we already mentioned in yesterday’s report, we’ve seen little noteworthy bullish intent from here as of yet. While there is a possibility of further consolidation around the current daily support area, we feel pressure from the overhead weekly supply will eventually push prices south to test the daily trendline taken from the low 1.0516.
Our suggestions: Watch for a lower timeframe sell signal to form (see the top of this report) around the underside of 1.1250, targeting the 1.12 handle and possibly beyond. In the event that the market does indeed close below 1.12, a second short trade could also be possible on the retest of this number if followed up by a H4 bearish close. Should this come to view, we’d look to take profits at the following structures: the H4 trendline support taken from the low 1.1045 and the H4 demand base seen below it at 1.1131-1.1143. Our ultimate take-profit zone is seen between the H4 support at 1.1075 and the 1.11 band. Not only is this a good take-profit area, it is also a fantastic barrier to look for longs. It sits within the depths of the aforementioned daily support area, and merges with both the above noted daily trendline support and also a deep H4 88.6% Fib support at 1.1081. Therefore, do keep an eyeball on this area guys!
On the data front, nevertheless, traders will be focused on the US retail sales, the PPI report and the unemployment claims data, which is scheduled for release at 1.30pm GMT today. So do remain vigilant around this time!

Levels to watch/live orders:
- Buys: 1.1075/1.11 [strong-looking buy zone which could, dependent on the time of day and approach, be sufficient enough to condone an entry without lower timeframe confirmation] (Stop loss: 1.1060).
- Sells: 1.1250 region [lower timeframe confirmation required] (Stop loss: dependent on where one confirms this area). Watch for price to close below the 1.12 handle and then look to trade any retest seen thereafter (H4 bearish close required prior to pulling the trigger).
GBP/USD:
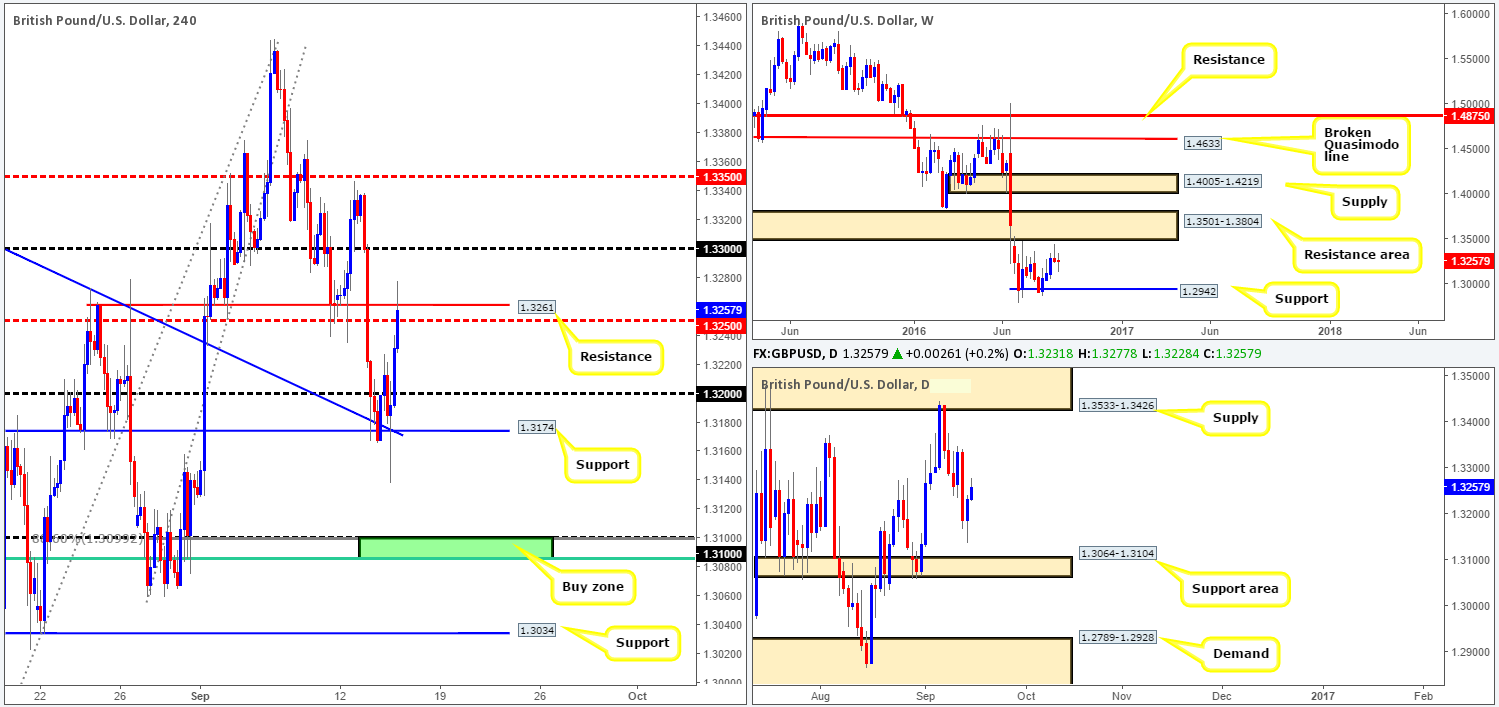
As US trading desks opened for business yesterday, we saw the GBP appreciate against its US counterpart from H4 support at 1.3174 (merges with a H4 trendline support taken from the high 1.3371). The advance took out offers around the 1.32 handle and ended the day clocking a high of 1.3240. This morning’s action, however, has seen price extend from yesterday’s close and kiss the underside of both a H4 resistance at 1.3261 and the H4 mid-way resistance 1.3250.
In the event that the H4 candles form a top around this region today, we may see yesterday’s low taken out and price head on down to the 1.31 band. In support of this move, there is room on both the weekly and daily charts to trade south, with the nearest downside target being seen on the daily chart: a support area at 1.3064-1.3104.
Our suggestions: Should price go on to top out around the 1.3250 range, we feel a short from here could be something to consider (we personally would need a decisive H4 bearish close to form from here to condone a short), with an ultimate target set at 1.31.
Assuming that the above scenario comes into view and 1.31 is hit, we would then advise liquidating any shorts one may have and begin hunting for longs. Here’s why 1.31 is considered a high-probability reversal zone:
- It is bolstered by a H4 61.8% Fib support at 1.3085 (taken from the low 1.2865).
- It also boasts a deep 88.6% Fib support at 1.31.
- On the assumption that the GBP does decline in value today, this could mark the third leg of a three-drive bullish pattern, which could stretch as far down as 1.31.
- Converges beautifully with the top edge of a daily support area coming in at 1.3064-1.3104.
Given that the above said buy zone is relatively small we would also advise waiting for at least a H4 bullish rotation candle to form here before considering a long in this market. Furthermore, the BoE is set to take the limelight midday GMT today to discuss monetary policy, so do remain vigilant during this time!
Levels to watch/live orders:
- Buys: 1.31 region [H4 bullish close required] (Stop loss: below the trigger candle).
- Sells: 1.3261/1.3250 [H4 bullish close required] (Stop loss: above the trigger candle).
AUD/USD:
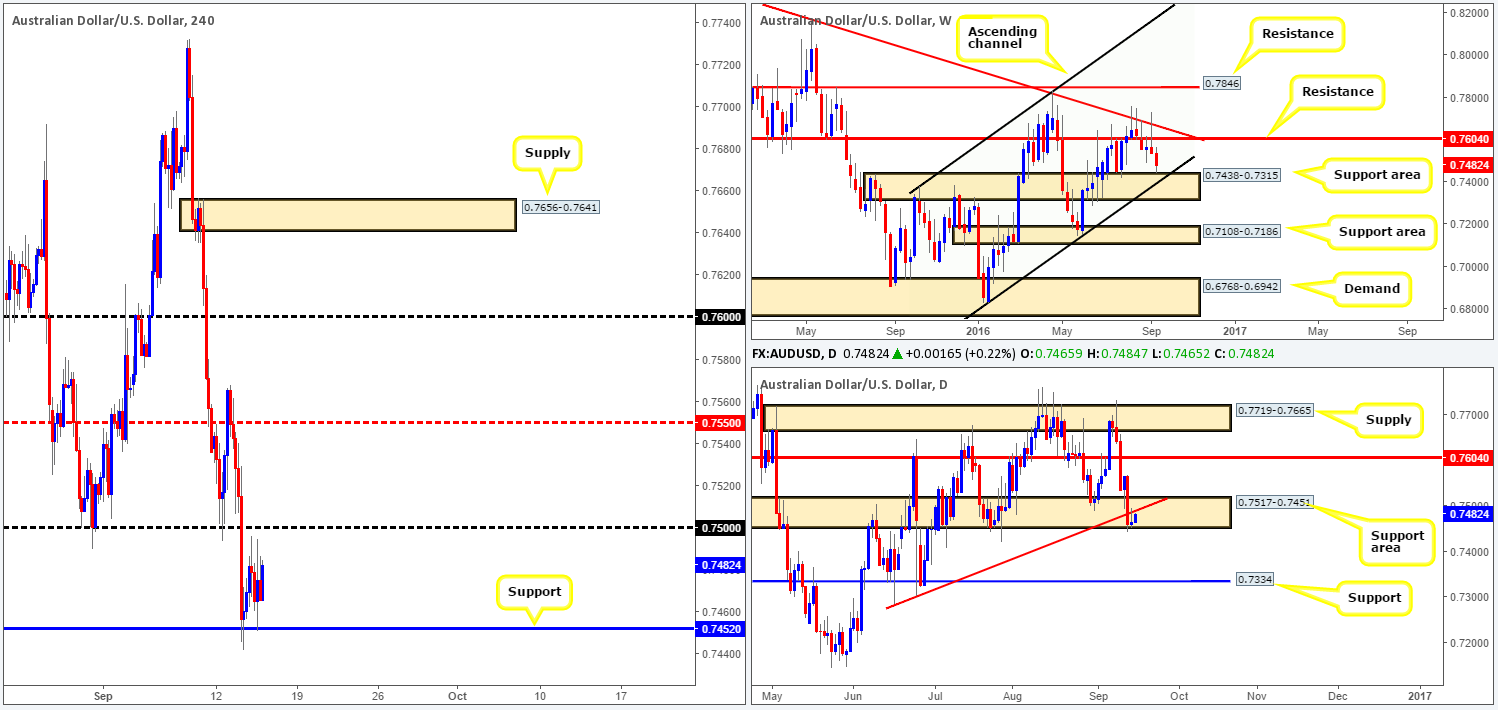
Following Tuesday’s selloff, the commodity-linked currency entered into a phase of consolidation yesterday between a H4 support barrier at 0.7452 and the overhead 0.75 handle. Beyond the current H4 support, we see little active demand in place. The only barrier which jumps out at us is the 0.74 hurdle, followed by a daily support level coming in at 0.7334.
Over in the bigger picture, the current weekly candle is seen hovering above a support area drawn from 0.7438-0.7315 which could see the commodity currency correct itself sometime soon. Turning our attention to the daily chart, however, price chalked up a bearish selling wick which tapped the underside of a recently broken trendline support taken from the low 0.7285. For all that though, we have to take into account that the daily candles still remain within a support area at 0.7517-0.7451 (positioned just above the aforementioned weekly support area).
Our suggestions: With weekly action trading so close to a support area at the moment, taking shorts from either the 0.75 band or the underside of the daily trendline resistance still remains high risk in our book. Personally, we’re going to step aside here since selling into a weekly zone is not really something we’d be comfortable participating in. We would, nevertheless, consider becoming buyers in this market following a decisive close above 0.75.
In addition to the above points, traders are advised to take precautions around 2.30am GMT today, since Aussie labor market data is set to take the spotlight. Market-moving events such as this can spark aggressive moves, so do remain alert during this time if you’re trading.
Levels to watch/live orders:
- Buys: Flat (Stop loss: n/a).
- Sells: Flat (Stop loss: n/a).
USD/JPY:
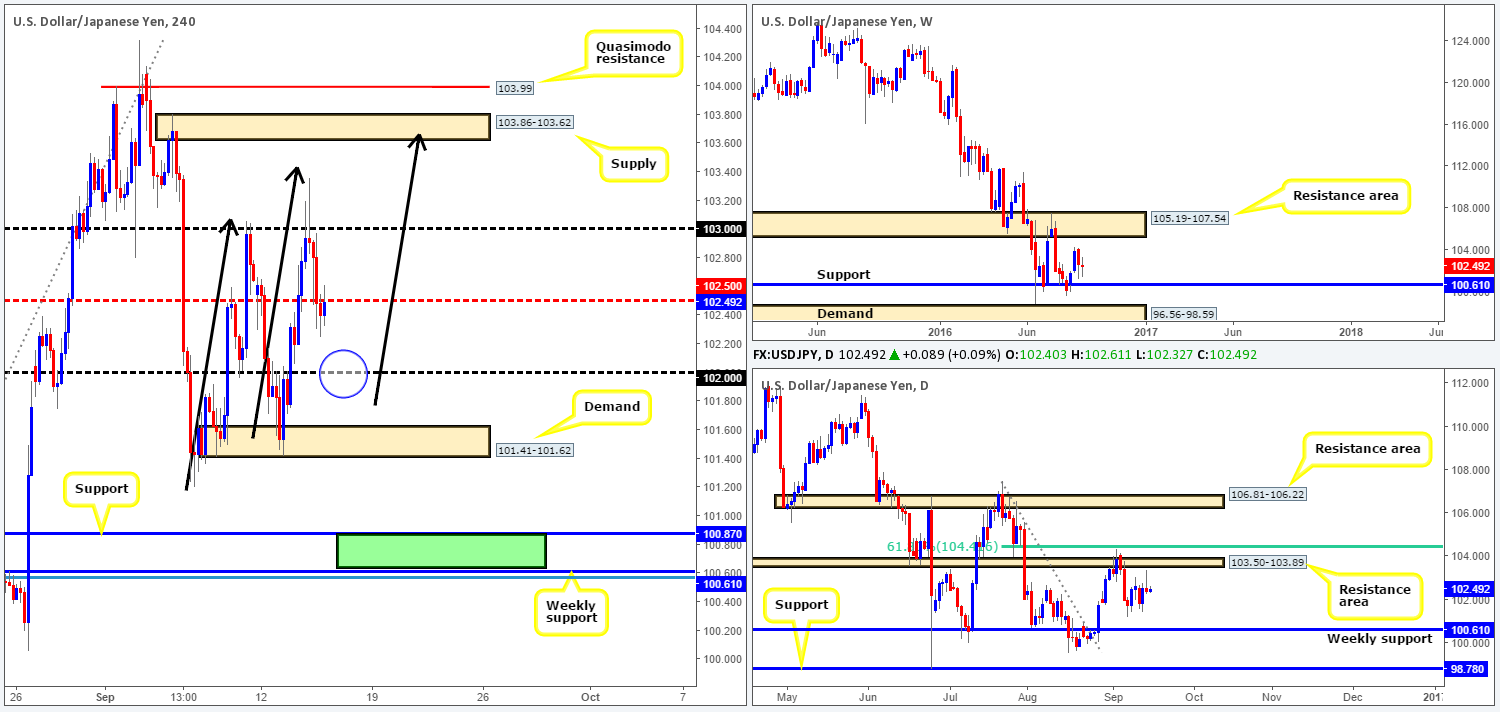
Based on recent H4 action we can see that the USD/JPY pair sold off from the 103 handle, following a rather aggressive bearish selling wick. The day ended with price closing below the H4 mid-way support 102.50, which, as you can see, is currently being retested as resistance. From a technical perspective, our team expects this number to hold as resistance today and push the pair into further losses down to the 102 band which should hold ground as support.
Assuming that our analysis is correct, a long from 102 is valid on the basis that price will want to complete the third leg of a symmetrical three-drive bearish pattern which terminates around the underside of supply coming in at 103.86-103.62 (positioned within a daily resistance area at 103.50-103.89).
Our suggestions: Watch for a H4 bullish candle to form off the 102 band today. If this comes into view, look to enter long with stops placed below the trigger candle. The ultimate target from here, of course, will be the H4 supply zone we discussed above at 103.86-103.62. Should this come to fruition this week, we’ll then consider the possibility of shorting from the aforementioned H4 supply zone on the basis of the three-drive approach and higher-timeframe confluence.
Levels to watch/live orders:
- Buys: 102 region [H4 bullish close required] (Stop loss: below the trigger candle).
- Sells: 103.86-103.62 [H4 bullish close will likely be required – dependent on the time of day] (Stop loss: above the trigger candle).
USD/CAD:
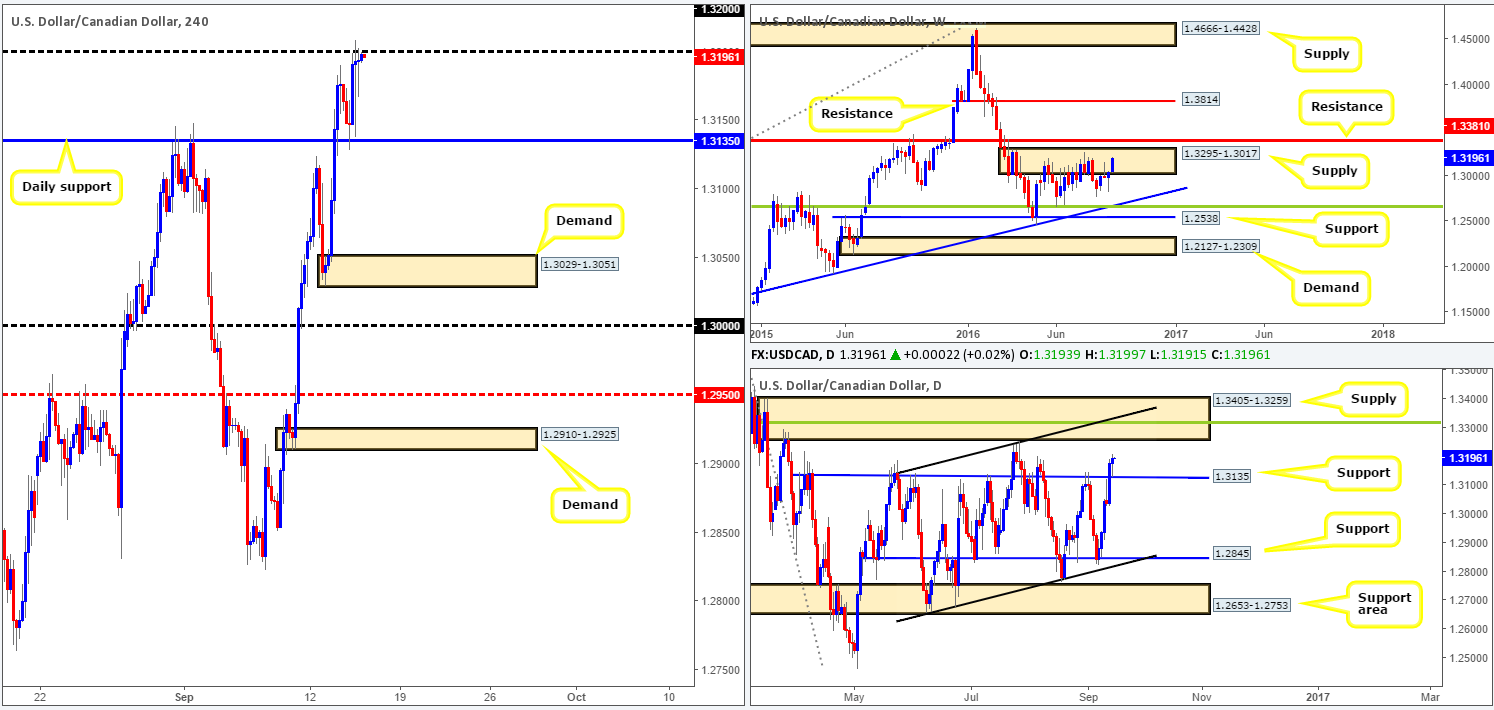
Despite the USD/CAD currently occupying a weekly supply zone drawn from 1.3295-1.3017, the buyers not only broke above a daily resistance level at 1.3135 on Tuesday, but they went on to retest the level as support on Wednesday! Looking at this from the daily chart, one can see that there is also room for further buying up to supply penciled in at 1.3405-1.3259.
Stepping across to the H4 chart, this recent bout of buying has brought price up to the psychological resistance level 1.32. By and large, the bulls still look to be in control here with a bearish close yet to be seen. A close above 1.32 would, in our opinion, further confirm the possibility of a push into the aforementioned daily supply zone. Directly above 1.32 we see a Quasimodo resistance barrier at 1.3244, which is positioned just below the daily supply.
Our suggestions: Despite daily action indicating that the bulls may push this market higher today, we are not looking to buy. Instead, we like the idea of shorting from either the above noted H4 Quasimodo resistance, or the daily 38.2% Fib resistance at 1.3315, which unties with a daily channel resistance taken from the high 1.3241 and sits within the aforementioned daily supply. Personally, we favor the latter.
To short from the H4 Quasimodo, we would require at least a H4 bearish close to form. Shorting from the daily Fib resistance, however, we feel that the confluence seen here is sufficient enough to permit a short entry at market with one’s stop placed above the daily supply itself at 1.3410.
Levels to watch/live orders
- Buys: Flat (Stop loss: n/a).
- Sells: 1.3244 [H4 bearish close required] (Stop loss: above the trigger candle). 1.3315 region (Stop loss: 1.3410).
USD/CHF:
Across the board the US dollar sold off yesterday. After price failed to muster enough strength to breach the H4 resistance at 0.9784, the pair declined in value going into the London trading session. Technically speaking, this has seen price enter into a phase of consolidation between the above said H4 resistance and the H4 demand base registered at 0.9710-0.9721.
With the above in mind, let’s see how the land lies on the higher-timeframe picture. The weekly chart offers very little as far as direction is concerned. The buyers and sellers are currently seen trading mid-range between a supply at 1.0092-0.9928 and a pair of supports drawn from 0.9508/0.9581. Down on the daily chart, however, the Swissy is seen holding ground at the top edge of a support area coming in at 0.9648-0.9708. In that there’s room for further upside from here we could see this pair stretch up to the trendline resistance extended from the high 1.0256.
Our suggestions: Looking for buying opportunities off the current H4 demand base is certainly something worth considering given the daily picture (see above). However, seeing as how price could still potentially fake beyond this base to the 0.97 handle we would at least wait for a H4 bull candle to form prior to pulling the trigger. For those who are extra conservative, in addition to the H4 close, you may also want to wait for lower timeframe confirming price action as well (see the top of this report).
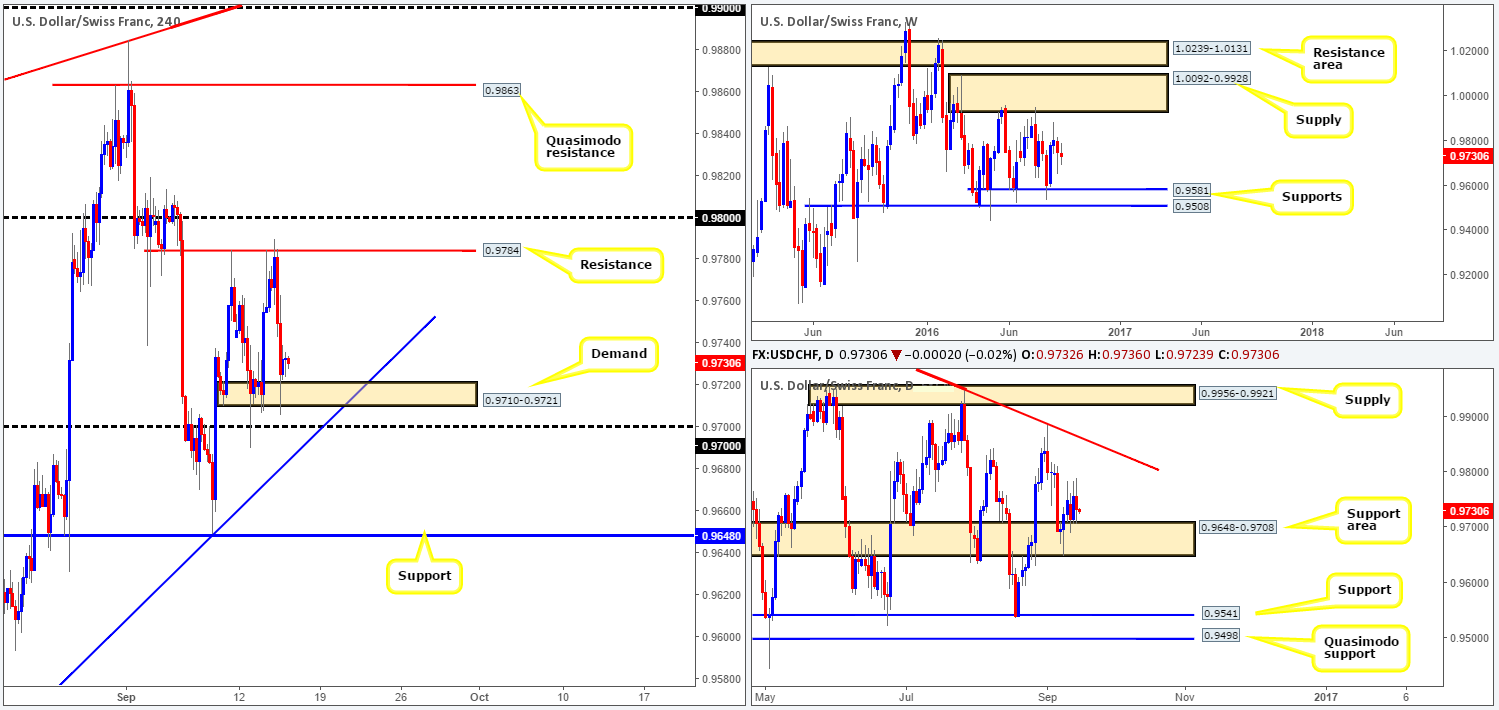
Levels to watch/live orders:
- Buys: 0.9710-0.9721 [H4 bullish close required] (Stop loss: below the trigger candle).
- Sells: Flat (Stop loss: n/a).
DOW 30:
Recent action shows that the US equity market extended losses yesterday from the H4 resistance area at 18321-18349 down to lows of 17987. With prices now seen trading just ahead of a H4 demand coming in at 17867-17911, where do we go from here? Well, according to the daily chart, the DOW is also seen loitering around the broken Quasimodo line at 18018 which converges with a trendline support extended from the low 15501. Therefore, there’s a good chance of a second reaction being seen from the current H4 demand base. However, one must also take into account that the weekly sellers are doing a good job in holding this index lower from the resistance area seen at 18365-18158.
Our suggestions: Watch over the current H4 demand area today guys as even though weekly flow is positioned against this zone, we feel that alongside the daily confluence, a bounce higher could be seen from here. Be that as it may, to be on the safe side here a H4 bullish candle would need to form prior to us pulling the trigger here.
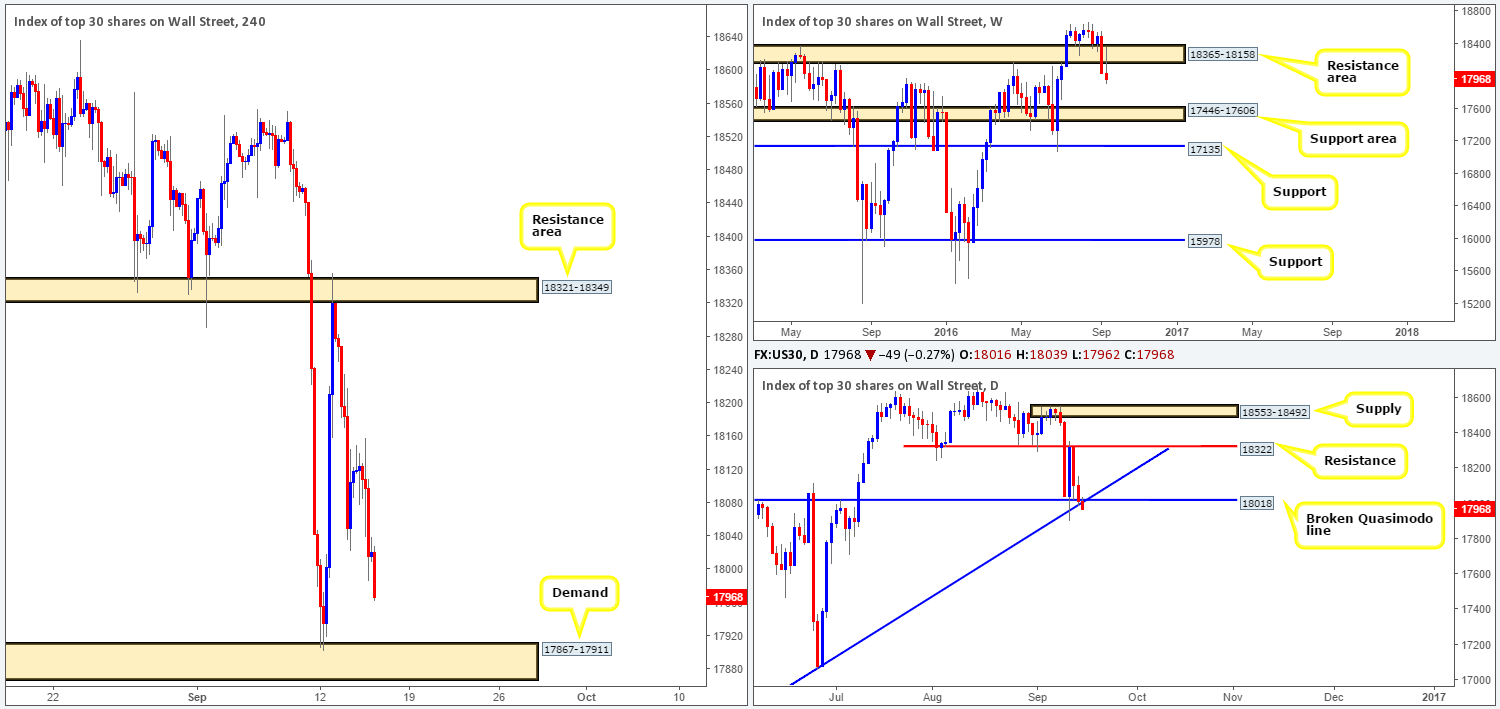
Levels to watch/live orders:
- Buys: 17867-17911 [H4 bullish close required] (Stop loss: below the trigger candle).
- Sells: Flat (Stop loss: n/a).
GOLD:
For those who read our previous report on gold you may recall that our team entered long at 1318.2 with a stop placed below the H4 support zone (1312.0-1316.0) at 1311.2. We have now moved our stop to breakeven and are waiting to see if the yellow metal reaches our first take-profit area at 1331.8-1329.6: a H4 supply zone.
With price also recently establishing itself around a daily demand area at 1305.3-1322.8, we feel confident our take-profit zone will be achieved today. Assuming that we’re correct, 70% of our position will be liquidated here, allowing the remaining 30% to run up to the next H4 supply seen at 1339.4-1337.0, followed hopefully by a third run up to the daily trendline resistance taken from the high 1375.0.
Other than yesterday’s call to enter long this market, we do not really see much else to hang our hat on at the moment.
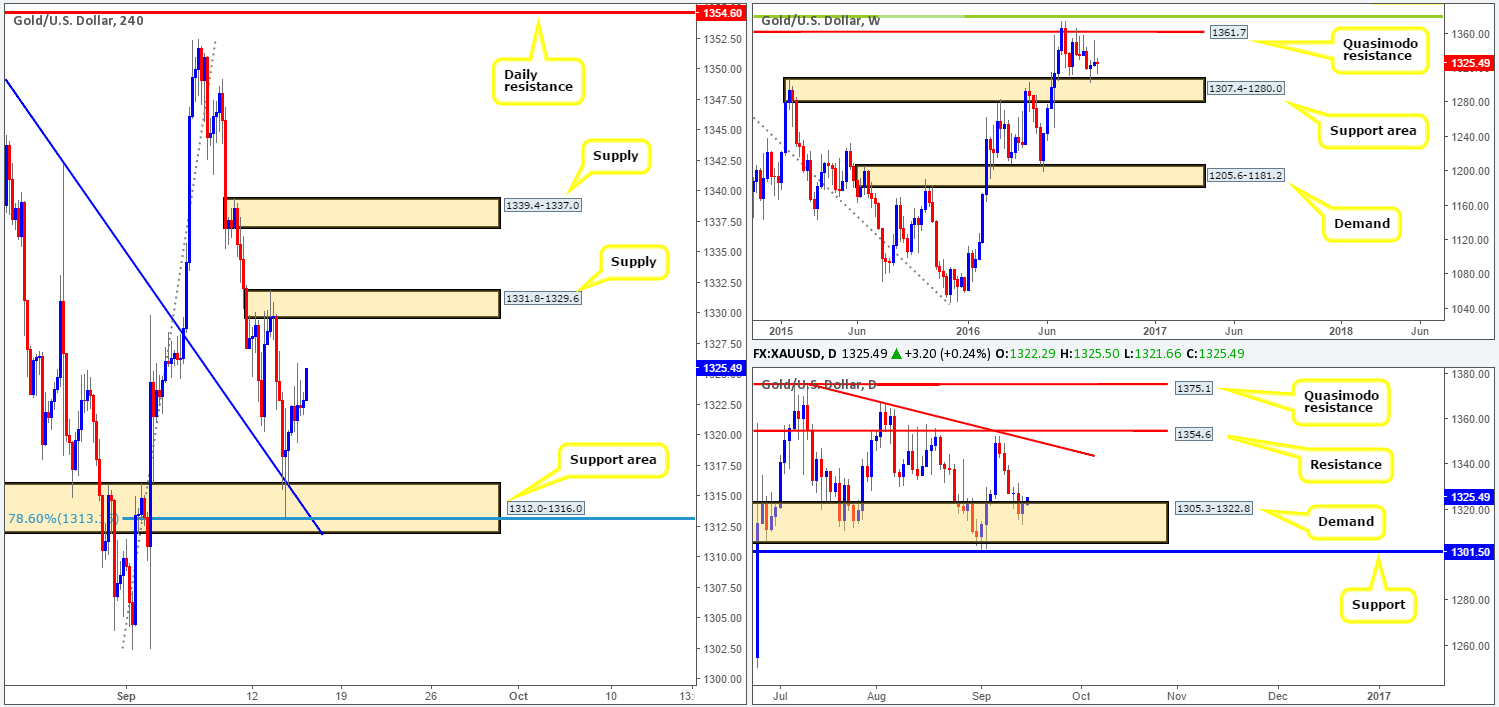
Levels to watch/live orders:
- Buys: 1318.2 [live] (Stop loss: breakeven).
- Sells: Flat (Stop loss: n/a).


