
EUR/USD:
In recent trading the EUR/USD failed in its attempt to breach 1.24, but did manage to come within a few pips of connecting with February’s opening level at 1.2417 and its intersecting H4 trendline resistance taken from the high 1.2555. Following mixed economic data out of the US, the H4 candles pressed lower and eventually rejoined the H4 mid-level point at 1.2350, which, as you can see, held firm into the closing bell. Should 1.2350 give way today, the next port of call to the downside comes in at 1.2314-1.2334: a H4 demand that’s followed closely by 1.23.
Upside remains capped on the weekly timeframe by a major-league weekly supply zone coming in at 1.2569-1.2287. Should sellers crank it up a gear, downside targets fall in around the weekly support band at 1.2044, shadowed closely by the 2018 yearly opening level at 1.2004. Looking down to the daily timeframe, the only areas of interest at the moment can be seen at a daily support zone drawn from 1.2246-1.2164 and a daily resistance area at 1.2626-1.2577 (positioned above the current weekly supply). It might also be worth noting a potential daily AB=CD formation (see red arrows) that terminates just short of the aforementioned daily resistance area.
Potential trading zones:
The H4 chart exhibits a somewhat restricted trading environment at the moment.
Intraday traders, however, will likely have their crosshairs fixed on the 1.24 region for shorts (given that it now fuses with the said H4 trendline resistance), and the space between the top edge of the noted H4 demand and 1.2350 for longs.
Data points to consider: US Empire state manufacturing index, Philly Fed manufacturing index and weekly unemployment claims all due at 12.30pm GMT.

Areas worthy of attention:
Supports: 1.2350; 1.2314-1.2334; 1.23; 1.2246-1.2164; 1.2004/1.2044.
Resistances: 1.24 handle; 1.2417; H4 trendline resistance; 1.2626-1.2577; 1.2569-1.2287.
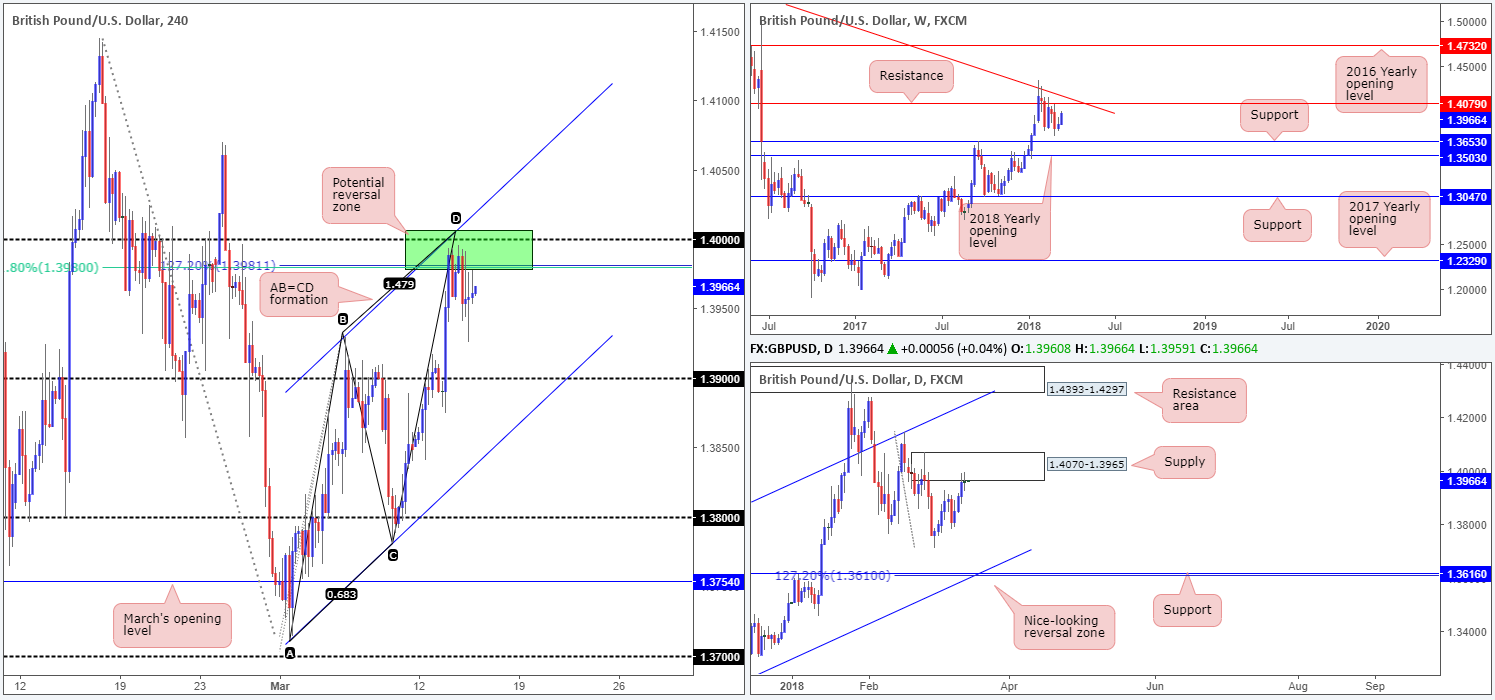
GBP/USD:
As is evident from the H4 timeframe this morning, our H4 sell zone marked in green at 1.4008/1.3980 has so far held ground. This should not really come as much of a surprise given that the area is comprised of the key psychological level 1.40, a H4 channel resistance taken from the high 1.3929, a H4 AB=CD (black arrows) 127.2% Fib ext. point at 1.3981 and a 61.8% H4 Fib resistance at 1.3980. Also noteworthy is the fact that the aforesaid H4 zone is seen housed within the lower limits of a daily supply base coming in at 1.4070-1.3965. The ultimate take-profit target on the H4 scale is the opposite side of the H4 channel: the H4 trendline support taken from the low 1.3711.
Potential trading zones:
All being well, those who shorted the above noted H4 sell zone have reduced risk and taken some profits off the table. We say this because there is a real possibility that the H4 candles may look to try and bring 1.40 into the picture today, whereby traders should expect a marginal fakeout beyond this number due to stops lurking above.
Data points to consider: US Empire state manufacturing index, Philly Fed manufacturing index and weekly unemployment claims all due at 12.30pm GMT.
Areas worthy of attention:
Supports: 1.39 handle; H4 channel support.
Resistances: 1.4008/1.3980; 1.4070-1.3965.
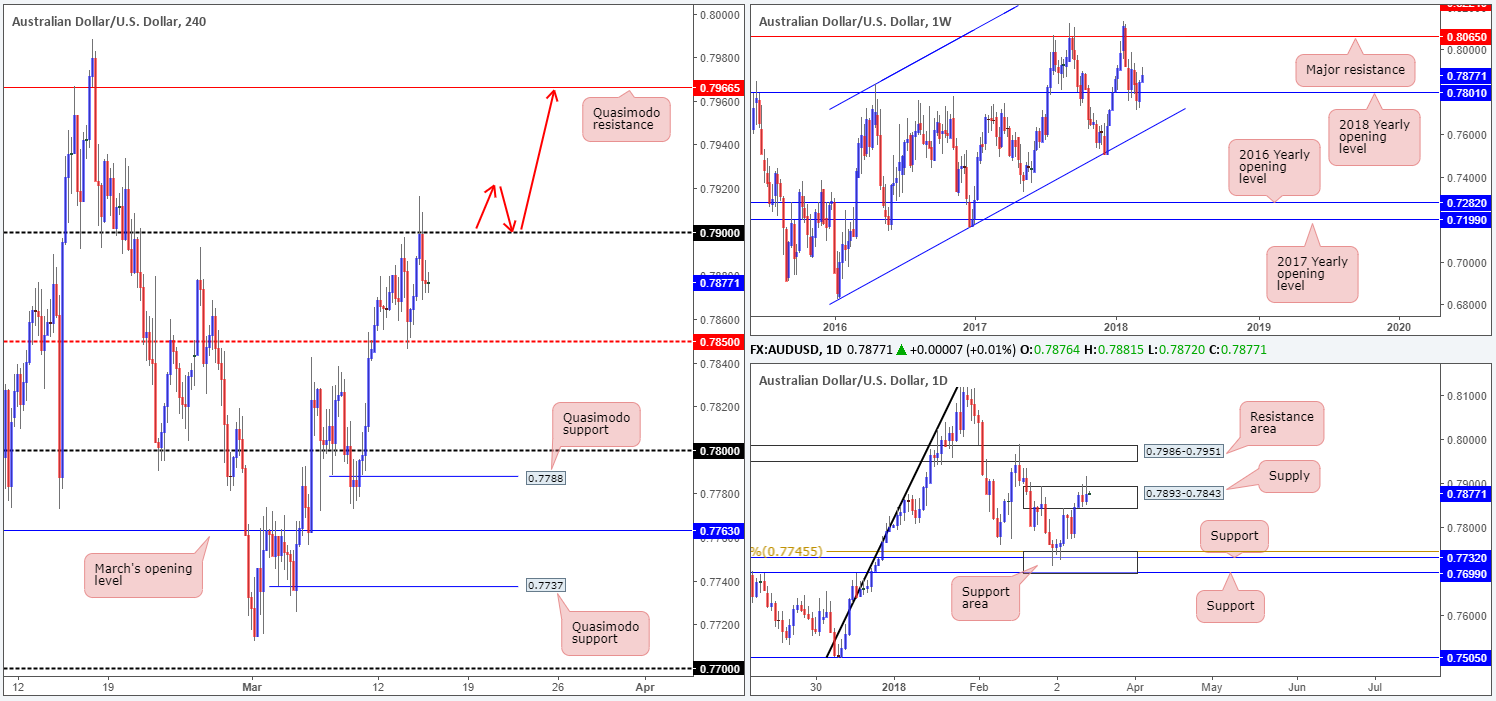
AUD/USD:
The commodity currency, as you can see, lifted higher in early hours of Wednesday’s trade on the back of upbeat Chinese data. The pair continued to press north through Asia and the first half of Europe, but turned lower after running stops above 0.79 going into the US session. H4 structure, therefore, is capped between 0.79 and the H4 mid-level support 0.7850 as we move into today’s segment.
On the bigger picture, daily flow remains capped by a daily supply zone coming in at 0.7893-0.7843, despite two back-to-back topside breaches. Weekly price, on the other hand, is seen trading above the 2018 yearly opening level (a support) on the weekly timeframe at 0.7801, and shows room to stretch as far north as the weekly resistance line at 0.8065.
Potential trading zones:
With the current daily supply area likely weakened by recent movement, we could see the unit push higher today/tomorrow. A H4 close above 0.79, followed up with a retest as support would, in our technical book, be enough to validate longs up to the H4 Quasimodo resistance level at 0.7966 (lodged within a daily resistance area at 0.7986-0.7951 – the next upside target beyond the aforementioned daily supply zone).
Data points to consider: US Empire state manufacturing index, Philly Fed manufacturing index and weekly unemployment claims all due at 12.30pm GMT.
Areas worthy of attention:
Supports: 0.7850; 0.7801.
Resistances: 0.7893-0.7843; 0.7986-0.7951; 0.79; 0.7966; 0.8065.
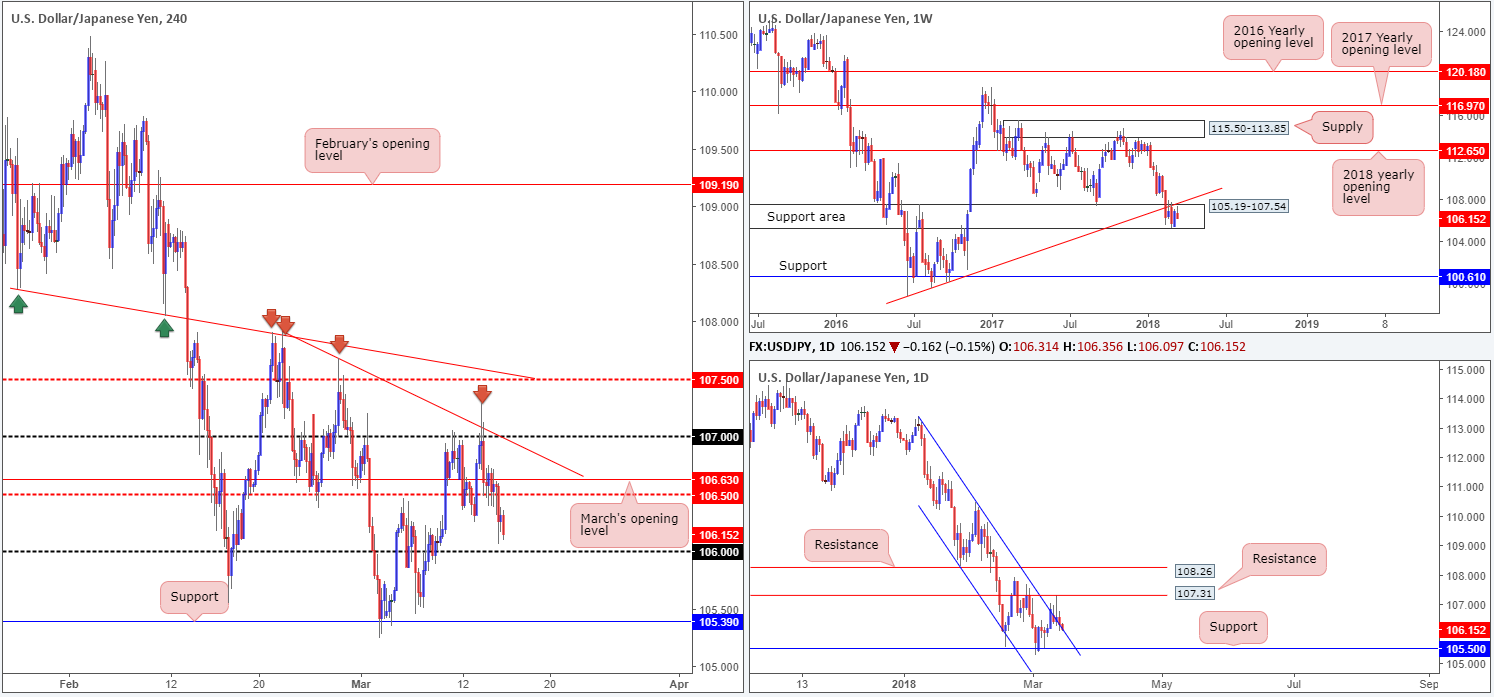
USD/JPY:
Taking its cue from a softer US equity market, the USD/JPY declined in value on Wednesday. After running through bids at the H4 mid-level support drawn from 106.50, the pair is now effectively free to shake hands with 106. Beyond this number, we see some space for the bears to stretch their legs down to H4 support at 105.39.
On the daily timeframe, price action is seen nudging its way back below a daily channel resistance line taken from the high 113.38, after recently coming within a few pips of testing daily resistance at 107.31. On the other side of the coin, weekly movement remains within a weekly support area at 105.19-107.54 but continues to reflect a bearish tone below the nearby weekly trendline support-turned resistance etched from the low 98.78.
Potential trading zones:
A break/retest of 106 would be interesting. Downside targets from this point fall in at a daily support penciled in at 105.50 (next support target on the daily scale), followed by the aforesaid H4 support level.
Data points to consider: US Empire state manufacturing index, Philly Fed manufacturing index and weekly unemployment claims all due at 12.30pm GMT.
Areas worthy of attention:
Supports: 106 handle; 105.39; 105.50; 105.19-107.54.
Resistances: 106.50; daily channel resistance; weekly trendline resistance; 107.31.
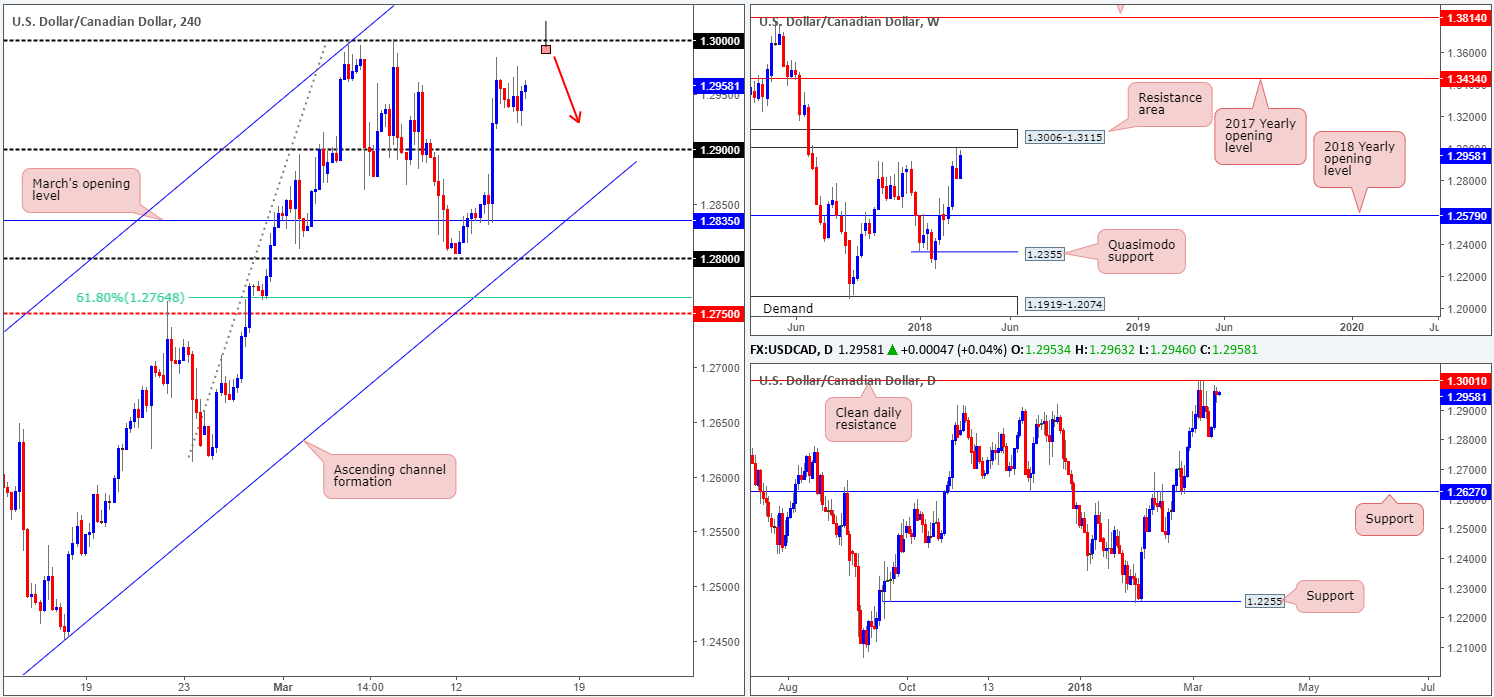
USD/CAD:
Following two consecutive days of gains, the pair entered into a phase of consolidation on Wednesday around 1.2950.
Directly above, traders likely have their crosshairs fixed on the key psychological level 1.30. This, by and of itself, is a widely watched number – even more so considering that it also represents a daily resistance at 1.3001, and is seen located just a few pips short of a weekly resistance area at 1.3006-1.3115.
Should 1.30 enter the fray today, traders need to be prepared for the possibility of a fakeout taking place to run stop-loss orders positioned above.
Potential trading zones:
Given the threat of a fakeout around 1.30, waiting for additional candle confirmation is advised should you intend shorting from here. A H4 selling wick (bearish pin bar) that pierces through 1.30 and closes on (or near) its lows (see H4 chart) would, in our humble view, be sufficient to confirm bearish intent.
Downside targets from the 1.30 neighborhood fall in at 1.2950, followed by 1.29. According to the higher-timeframe structure, though, price could potentially drive much lower!
Data points to consider: US Empire state manufacturing index, Philly Fed manufacturing index and weekly unemployment claims all due at 12.30pm GMT.
Areas worthy of attention:
Supports: 1.29 handle.
Resistances: 1.30 handle; 1.3006-1.3115; 1.3001.
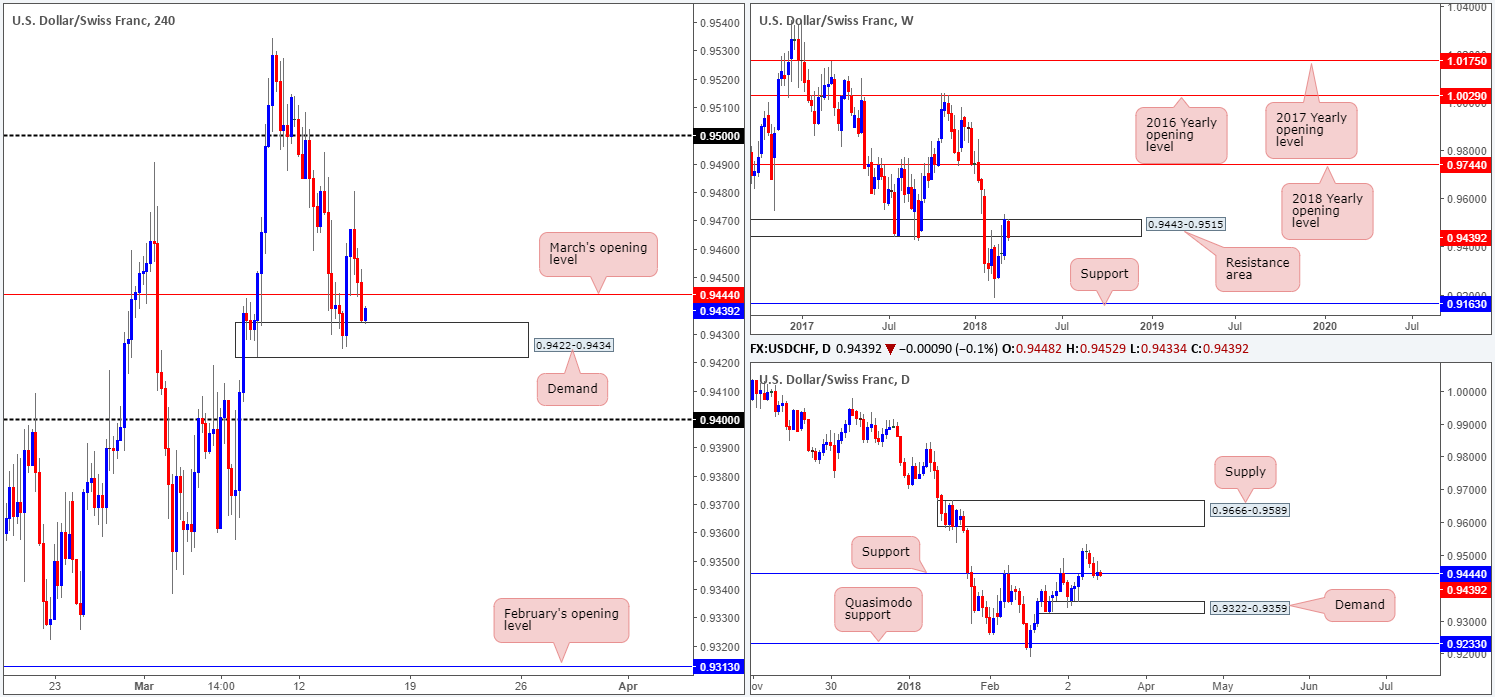
USD/CHF:
The USD/CHF ended the day printing modest gains, following a dominant push lower from session highs of 0.9480. The H4 demand at 0.9422-0.9434 is currently in sight, with March’s opening level seen not too far off at 0.9444. A violation of the current H4 demand base has the 0.94 handle to target.
Turning our attention to the daily picture, price is seen trading sub 0.9444: a daily support level that has the same value as March’s opening level mentioned above. A little higher on the curve, nevertheless, we can see weekly price attempting to defend a weekly resistance area at 0.9443-0.9515. Continued selling from this point could potentially drag the piece as far south as the weekly support level at 0.9163.
In Switzerland, the key event today will be the Swiss National Bank decision. No change in rates is expected. The central bank will also release the Quarterly Bulletin.
Potential trading zones:
While the current H4 demand boasts a strong base and proved valuable during yesterday’s movement, higher-timeframe direction still indicates that we may see further downside materialize. A violation of the H4 demand could set the stage for a test of 0.94. Should a push lower take place here followed up with a retest, intraday sellers may want to think about looking for viable selling opportunities. If we get beyond 0.94; the next downside target can be seen at the top edge of daily demand mentioned above at 0.9359.
Data points to consider: US Empire state manufacturing index, Philly Fed manufacturing index and weekly unemployment claims all due at 12.30pm; CHF Libor rate and SNB monetary policy assessment at 8.30am GMT.
Areas worthy of attention:
Supports: 0.9422-0.9434; 0.94; 0.9322-0.9359; 0.9163.
Resistances: 0.9444; 0.9443-0.9515.
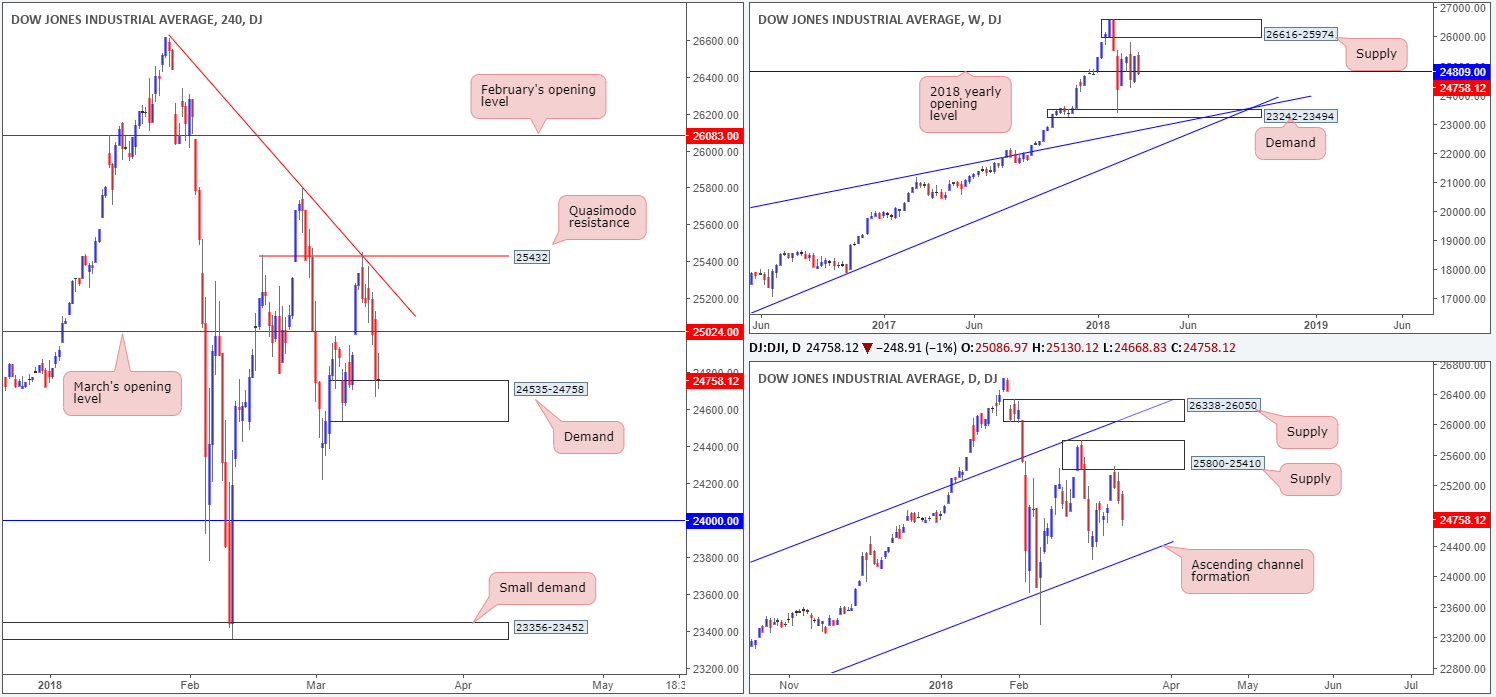
DOW 30:
Renewed fears of a trade war undermined risk sentiment on Wednesday, forcing the Dow Jones Industrial Average into negative territory for the third consecutive day.
The H4 candles crossed beneath March’s opening level at 25024 and crossed swords with a H4 demand base at 24535-24758. Although we’re not particularly impressed by the demand’s structure, we do like the fact that the 2018 yearly opening level seen on the weekly timeframe (support) at 24809 is planted just above it. According to the daily timeframe, though, further selling could very well be on the cards. After responding beautifully from daily supply at 25800-25410, the index shows room to press as far south as the daily channel support extended from the low 17883.
Potential trading zones:
An intraday bounce may materialize from the current H4 demand base today, but the most we see price reaching is the underside of March’s opening line. Our rationale behind this is simply that daily price exhibits room to decline further. Be careful shorting beyond this area, though, since there’s only a few points space before we reach the noted daily channel support.
Data points to consider: US Empire state manufacturing index, Philly Fed manufacturing index and weekly unemployment claims all due at 12.30pm GMT.
Areas worthy of attention:
Supports: 24535-24758; 24809; daily channel support.
Resistances: 25800-25410; 25024.
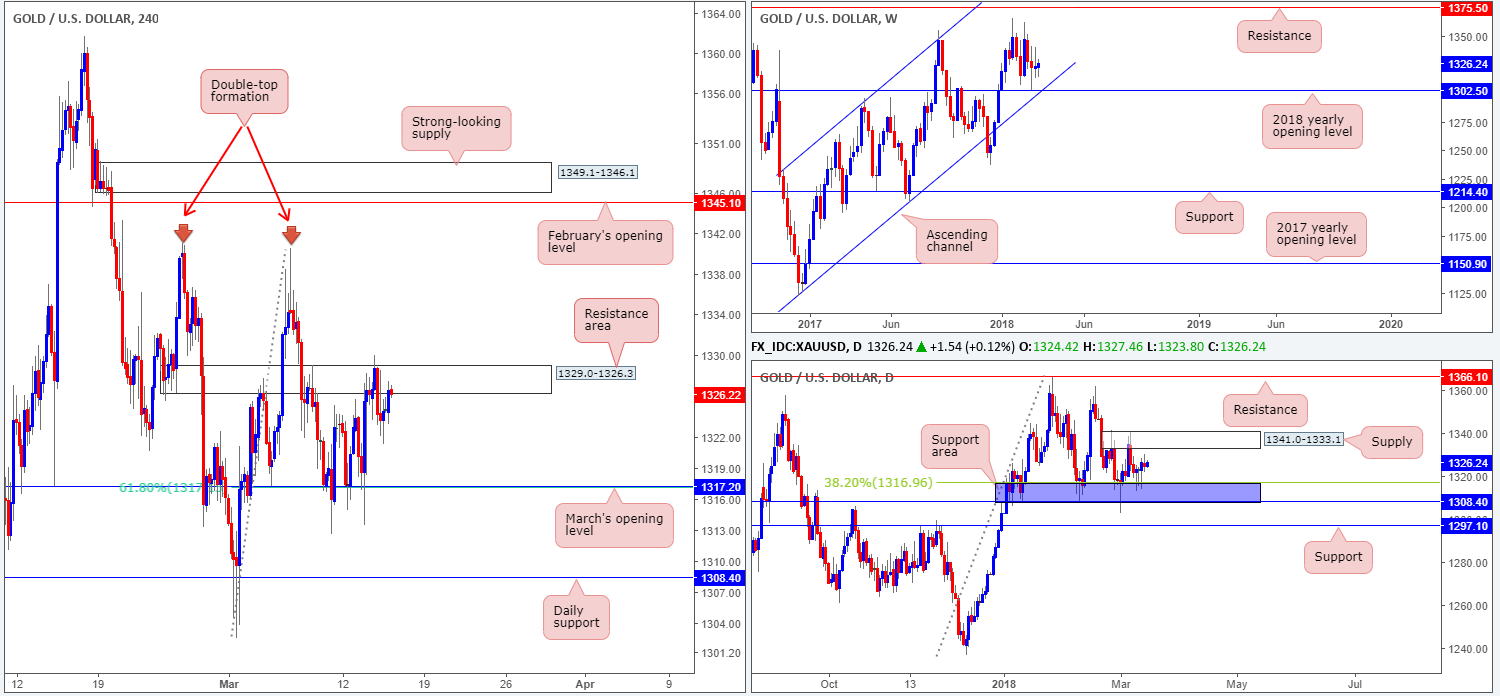
GOLD:
Gold prices are little changed this morning. H4 price remains capped by a H4 resistance area at 1329.0-1326.3. A break of this zone on the H4 timeframe clears upside to the 1340.2ish mark: a double-top H4 resistance, positioned just short of February’s opening level at 1345.1.
For those looking to buy the breakout above the current H4 resistance area, it might be an idea to note what you are buying in to. Directly above this area is a daily supply zone coming in at 1341.0-1333.1. This is the next upside target on the daily scale following an advance from the daily support area marked in blue at 1308.4/1316.9. Therefore, despite weekly price showing promise to the upside from the 2018 yearly opening level at 1302.5, traders should exercise caution buying this market right now!
Potential trading zones:
In the absence of clearer price action, the team has stamped this market flat for the time being.
Areas worthy of attention:
Supports: 1317.2; 1308.4/1316.9.
Resistances: 1341.0-1333.1; 1329.0-1326.3; 1340.2.
This site has been designed for informational and educational purposes only and does not constitute an offer to sell nor a solicitation of an offer to buy any products which may be referenced upon the site. The services and information provided through this site are for personal, non-commercial, educational use and display. IC Markets does not provide personal trading advice through this site and does not represent that the products or services discussed are suitable for any trader. Traders are advised not to rely on any information contained in the site in the process of making a fully informed decision.
This site may include market analysis. All ideas, opinions, and/or forecasts, expressed or implied herein, information, charts or examples contained in the lessons, are for informational and educational purposes only and should not be construed as a recommendation to invest, trade, and/or speculate in the markets. Any trades, and/or speculations made in light of the ideas, opinions, and/or forecasts, expressed or implied herein, are committed at your own risk, financial or otherwise.
The use of the site is agreement that the site is for informational and educational purposes only and does not constitute advice in any form in the furtherance of any trade or trading decisions.
The accuracy, completeness and timeliness of the information contained on this site cannot be guaranteed. IC Markets does not warranty, guarantee or make any representations, or assume any liability with regard to financial results based on the use of the information in the site.
News, views, opinions, recommendations and other information obtained from sources outside of www.icmarkets.com.au, used in this site are believed to be reliable, but we cannot guarantee their accuracy or completeness. All such information is subject to change at any time without notice. IC Markets assumes no responsibility for the content of any linked site. The fact that such links may exist does not indicate approval or endorsement of any material contained on any linked site.
IC Markets is not liable for any harm caused by the transmission, through accessing the services or information on this site, of a computer virus, or other computer code or programming device that might be used to access, delete, damage, disable, disrupt or otherwise impede in any manner, the operation of the site or of any user’s software, hardware, data or property.


