
DXY:
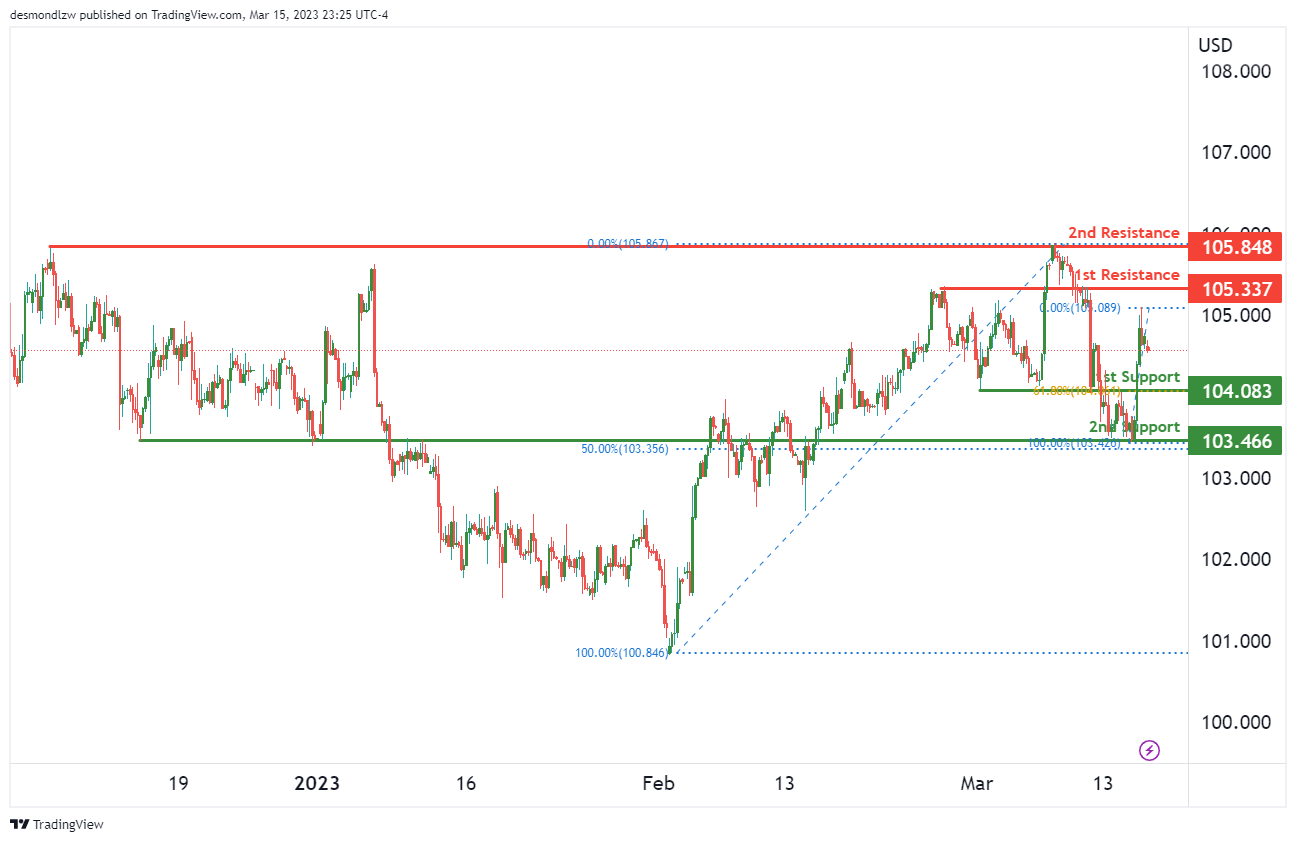
The DXY chart is currently showing bearish momentum, with potential for a bearish reaction off the first resistance level at 105.33, dropping to the first support level at 104.08.
The first support level at 104.08 is an overlap support level, coinciding with a 61.80% Fibonacci retracement, which may provide strong support for the price if it drops.
If the price were to break below the first support level, it could drop to the second support level at 103.46, which is also an overlap support level, coinciding with a 50% Fibonacci retracement.
There is also a first resistance level at 105.33, which is an overlap resistance level. If the price were to react bearishly off this level, it could potentially pave the way for further downside potential.
There is also a second resistance level at 105.84, which is a multi-swing high resistance level. If the price were to break above this level, it could potentially invalidate the bearish scenario.
EUR/USD:
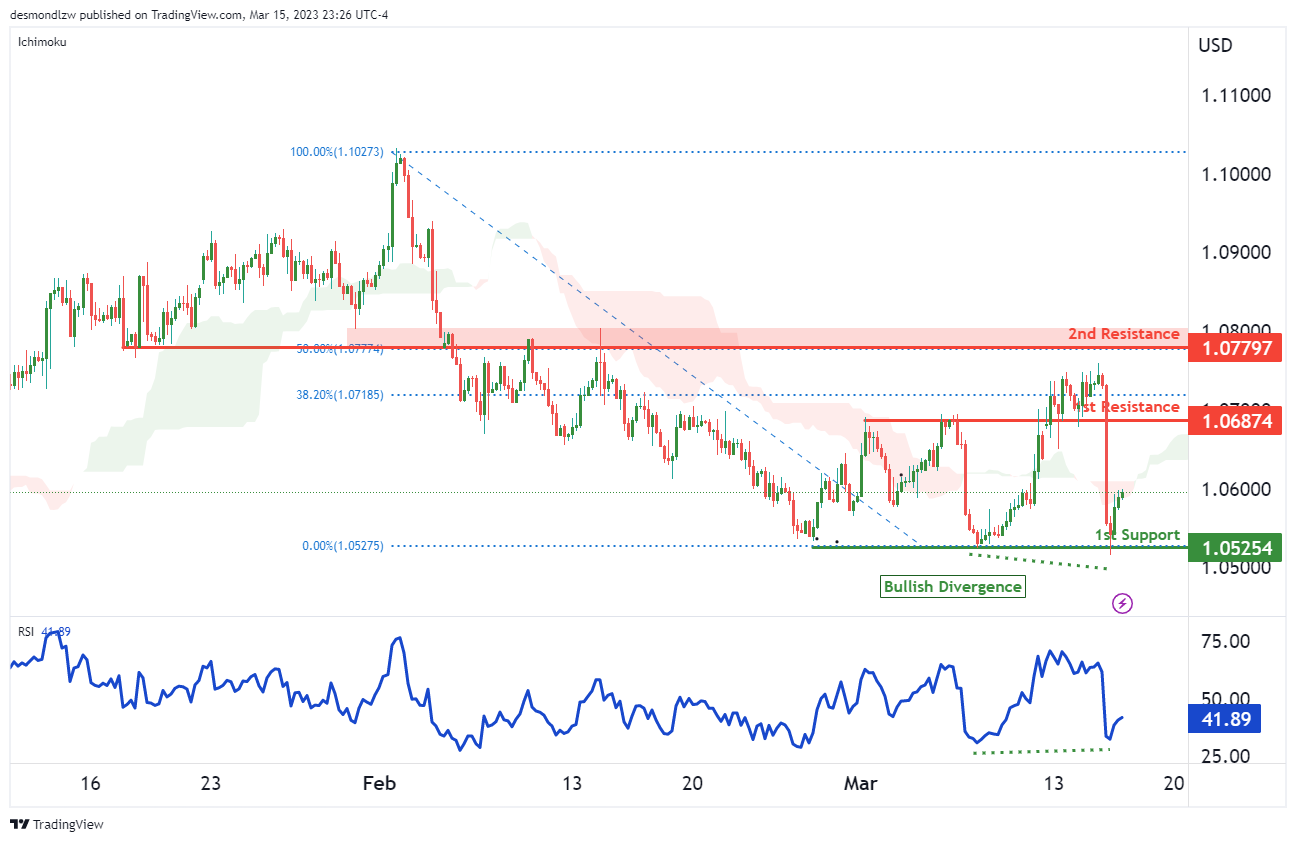
The EUR/USD chart is currently showing a bullish momentum, with the potential for a bullish bounce off the first support level at 1.0525, heading towards the first resistance level at 1.0687.
The first support level at 1.0525 is a multi-swing low support, which may provide strong support for the price if it drops. Furthermore, the price is currently within the bullish Ichimoku cloud, which often suggests that it might bounce from there, further supporting the bullish scenario.
If the price were to bounce off the first support, it could rise to the first resistance level at 1.0687, which is an overlap resistance level.
There is also a second resistance level at 1.0779, which is an overlap resistance level, coinciding with a 50% Fibonacci retracement. If the price were to break above this level, it could potentially pave the way for further upside potential.
The RSI is also displaying bullish divergence versus price, suggesting that a bounce might occur soon, potentially further supporting the bullish scenario.
GBP/USD:
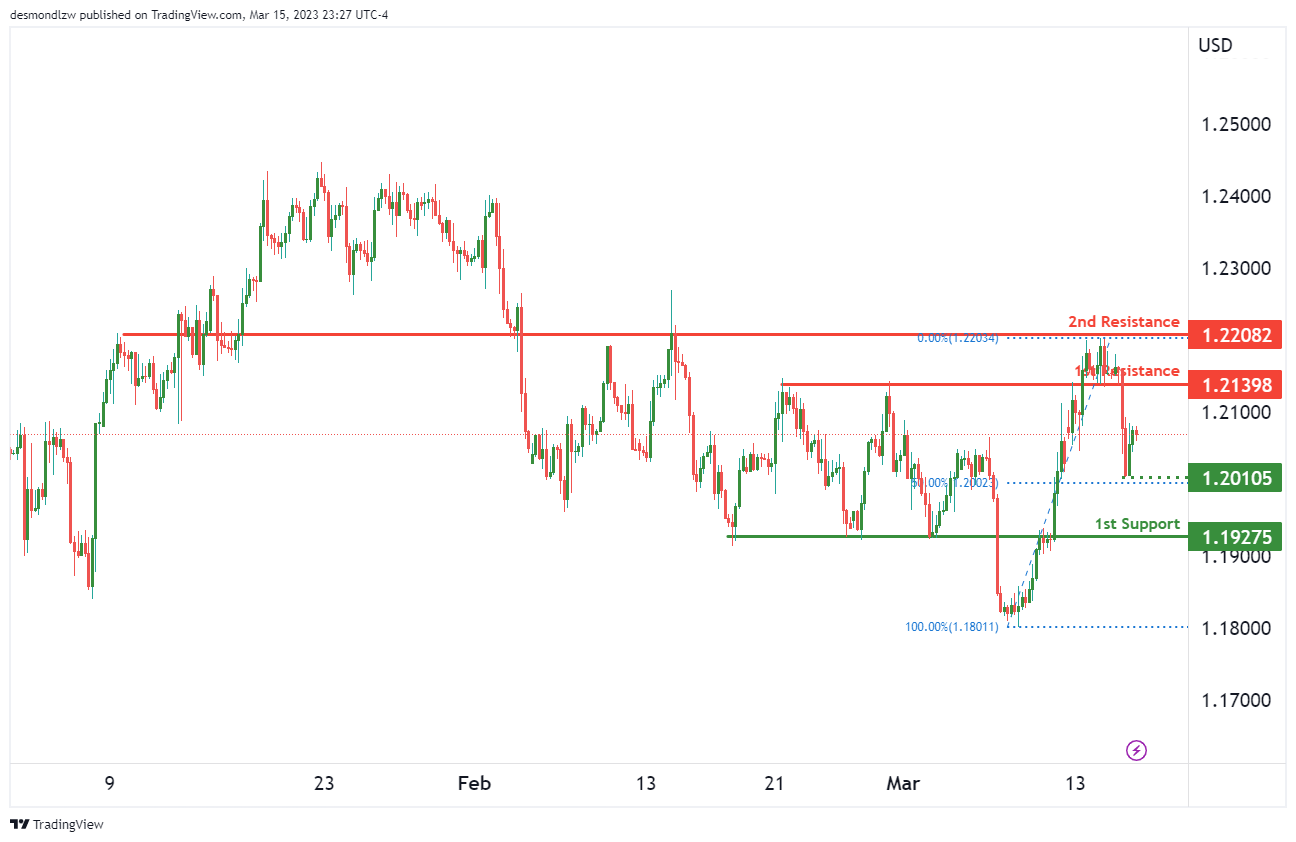
The GBP/USD chart is currently in a a neutral range, with potential for price to fluctuate between the first resistance level at 1.2139 and the first support level at 1.1927.
The first support level at 1.1927 is an overlap support level, which may provide strong support for the price if it drops. There is also an intermediate support level at 1.2010, which is an overlap support level coinciding with a 50% Fibonacci retracement.
On the other hand, the first resistance level at 1.2139 is an overlap resistance level. If the price were to break above this level, it could potentially rise towards the second resistance level at 1.2208.
USD/CHF:
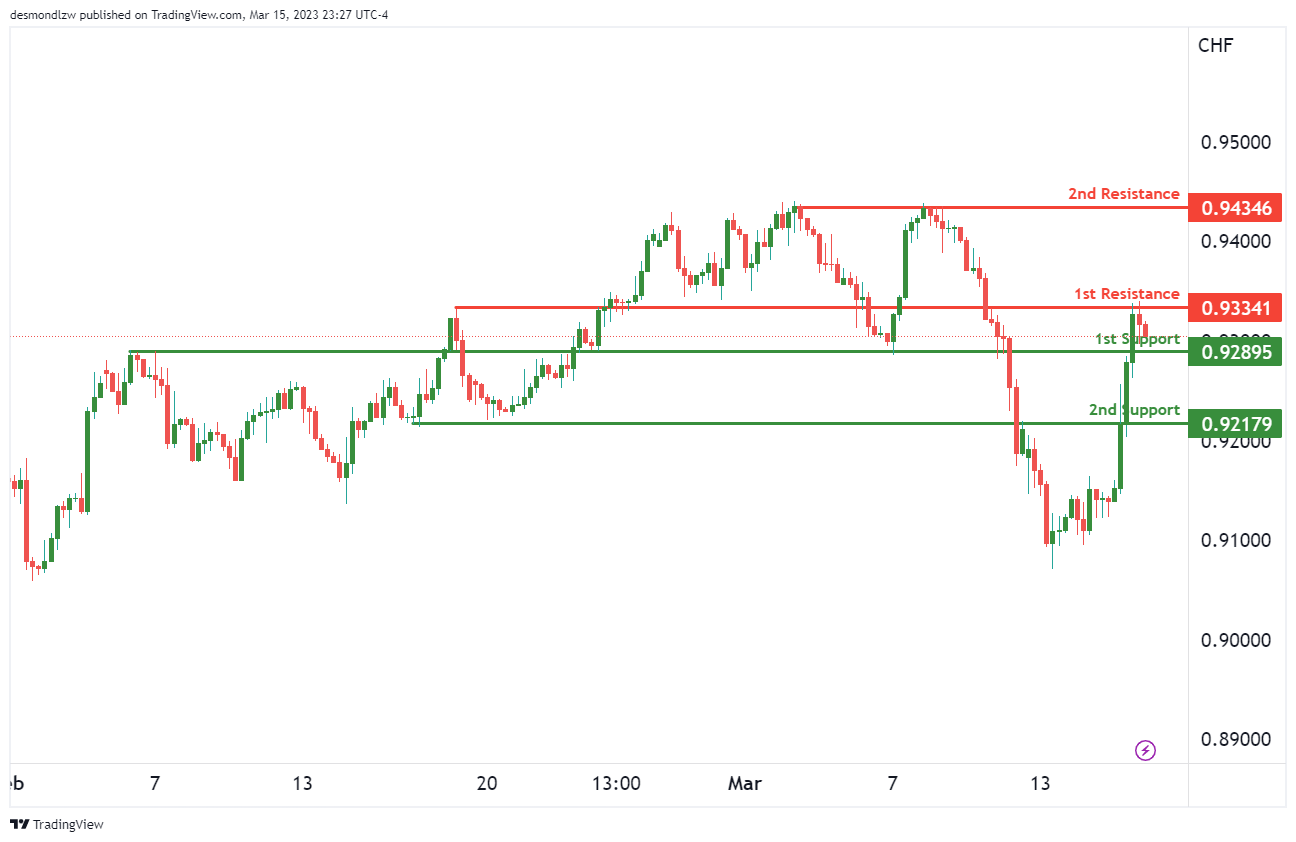
The USD/CHF chart is currently showing bearish momentum, with potential for a bearish reaction off the first resistance level at 0.9334, dropping to the first support level at 0.9289.
The first support level at 0.9289 is an overlap support level, which may provide strong support for the price if it drops. Additionally, there is a second support level at 0.9217, which is also an overlap support level.
If the price were to break below the first support level, it could potentially drop to the second support level at 0.9217, which is also an overlap support level.
On the other hand, the first resistance level at 0.9334 is an overlap resistance level. If the price were to react bearishly off this level, it could potentially pave the way for further downside potential.
There is also a second resistance level at 0.9434, which is a multi-swing high resistance level. If the price were to break above this level, it could potentially invalidate the bearish scenario.
USD/JPY:
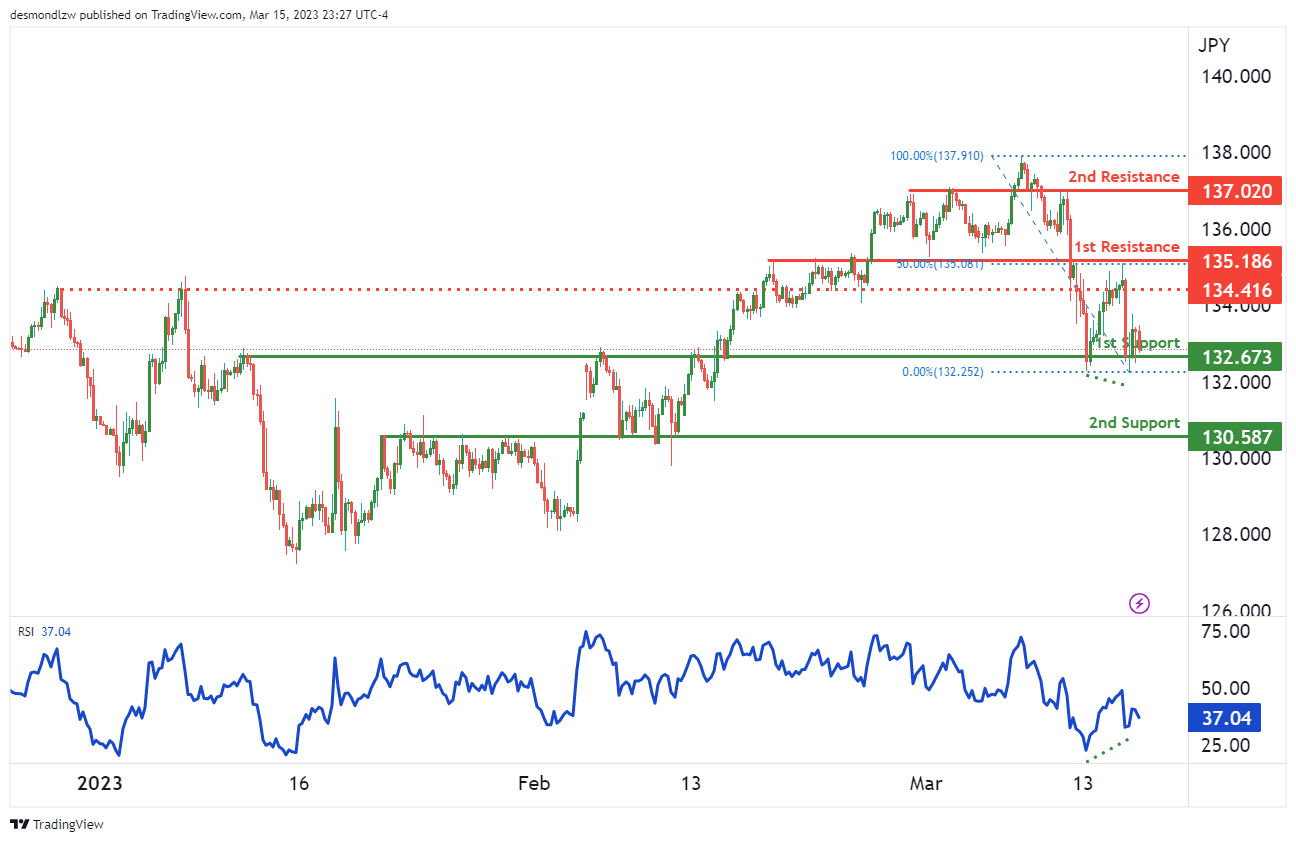
The USD/JPY chart is currently showing bullish momentum, with potential for a bullish bounce off the first support level at 132.67, heading towards the first resistance level at 135.18.
The first support level at 132.67 is an overlap support level, which may provide strong support for the price if it drops. Additionally, there is a second support level at 130.58, which is also an overlap support level.
If the price were to break below the first support level, it could potentially drop to the second support level at 130.58, which is also an overlap support level.
On the other hand, the first resistance level at 135.18 is an overlap resistance level, coinciding with a 50% Fibonacci retracement. If the price were to break above this level, it could potentially rise towards the second resistance level at 137.02, which is a multi-swing high resistance level.
There is also an intermediate resistance level at 134.41, which may provide a minor obstacle before the price potentially breaks above the first resistance level.
The RSI is displaying bullish divergence versus price, suggesting that a bounce might occur soon.
AUD/USD:
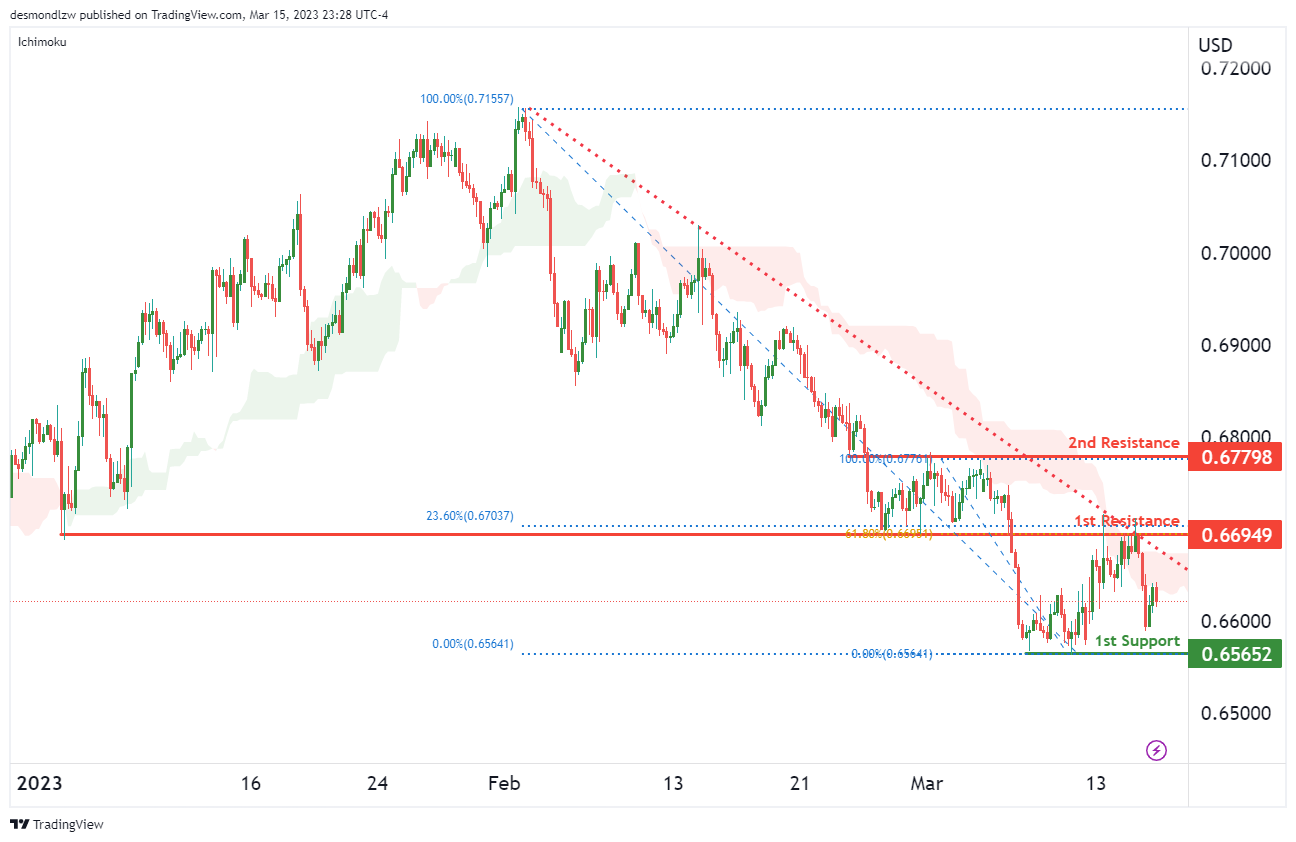
The AUD/USD chart is currently showing bearish momentum, with potential for a bearish reaction off the first resistance level at 0.6694, dropping to the first support level at 0.6565.
The first support level at 0.6565 is a multi-swing low support level, which may provide strong support for the price if it drops.
On the other hand, the first resistance level at 0.6694 is an overlap resistance level, coinciding with a 61.80% Fibonacci retracement. Additionally, it is right below the bearish Ichimoku cloud, which usually suggests that the price might reverse from there. If the price were to react bearishly off this level, it could potentially drop to the first support level at 0.6565.
There is also a second resistance level at 0.6779, which is an overlap resistance level.
NZD/USD:
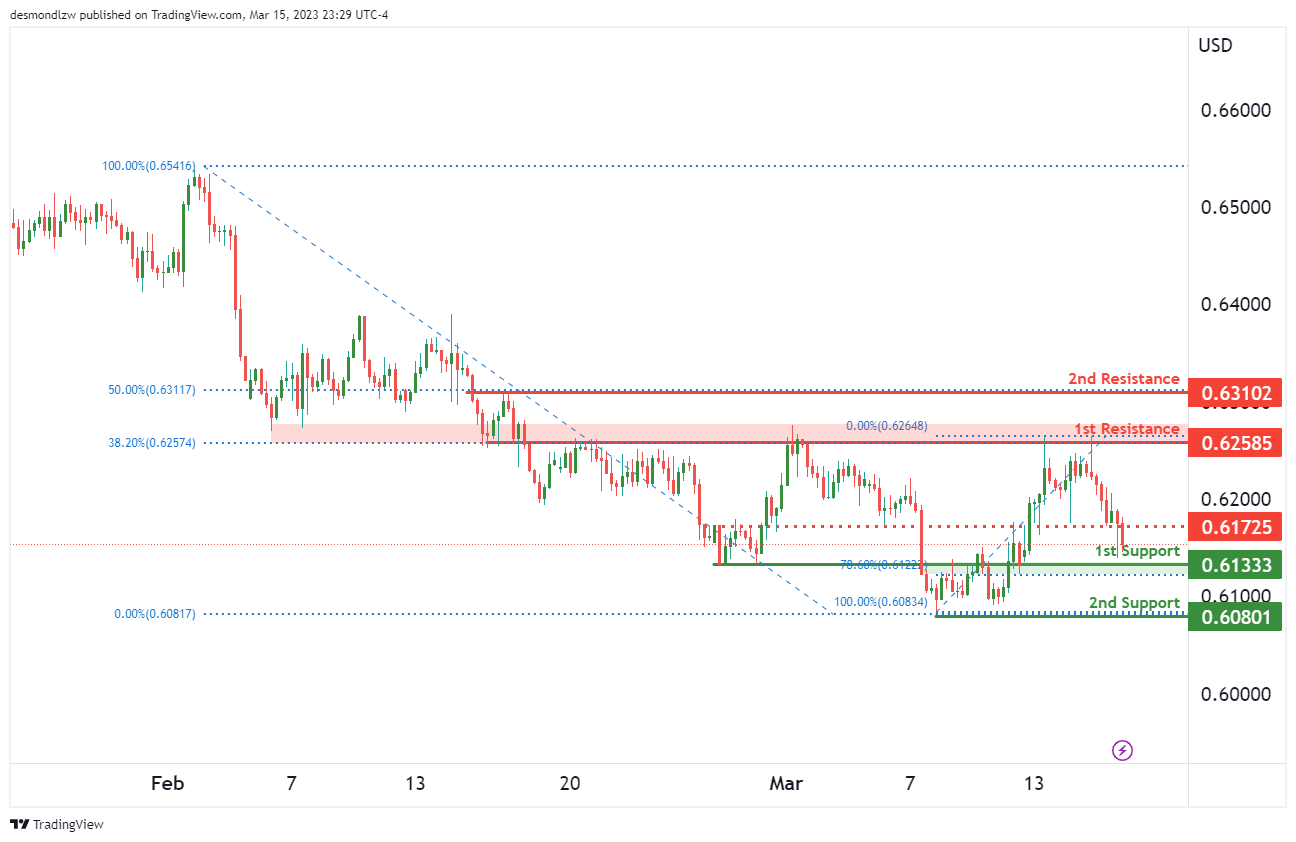
The NZD/USD chart is currently showing bearish momentum, with potential for a bearish reaction off the first resistance level at 0.6258, dropping to the first support level at 0.6133.
The first support level at 0.6133 is a pullback support level, coinciding with a 78.60% Fibonacci retracement, which may provide strong support for the price if it drops.
If the price were to break below the first support level, it could potentially drop to the second support level at 0.6080, which is a multi-swing low support level.
On the other hand, the first resistance level at 0.6258 is an overlap resistance level, coinciding with a 38.20% Fibonacci retracement. There is also a second resistance level at 0.6310, which is a swing high resistance level.
USD/CAD:
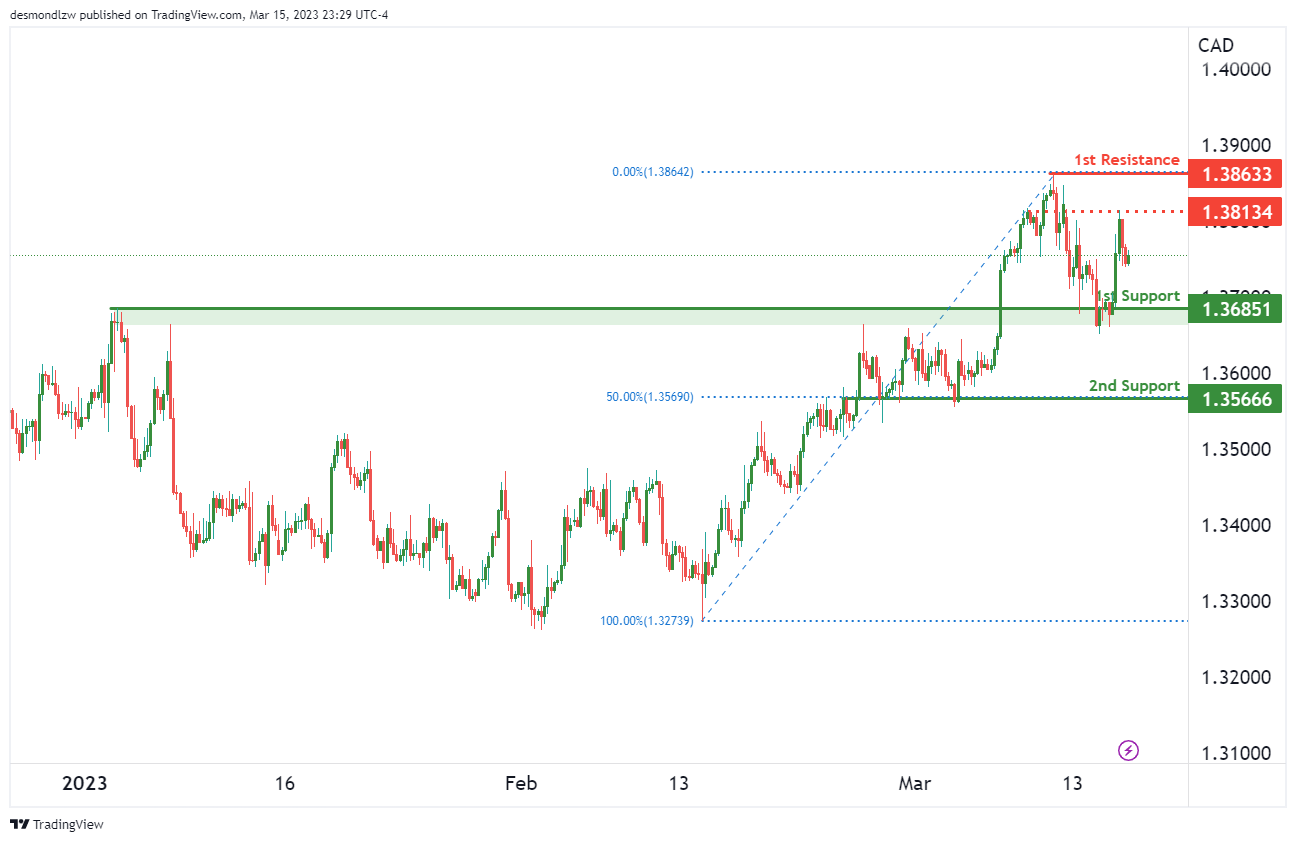
The USD/CAD chart is currently showing bullish momentum with potential for a bullish bounce off the first support level at 1.3685, heading towards the first resistance level at 1.3863.
The first support level at 1.3685 is an overlap support level, which may provide strong support for the price if it drops. If the price were to break below this level, it could drop to the second support level at 1.3566, which is a multi-swing low support level coinciding with a 50% Fibonacci retracement.
There is also a first resistance level at 1.3863, which is a swing high resistance level. If the price were to break above this level, it could potentially pave the way for further upside potential.
There is also an intermediate resistance level at 1.3813, which is an overlap resistance level. If the price were to break above this level, it could potentially provide additional support for the bullish scenario.
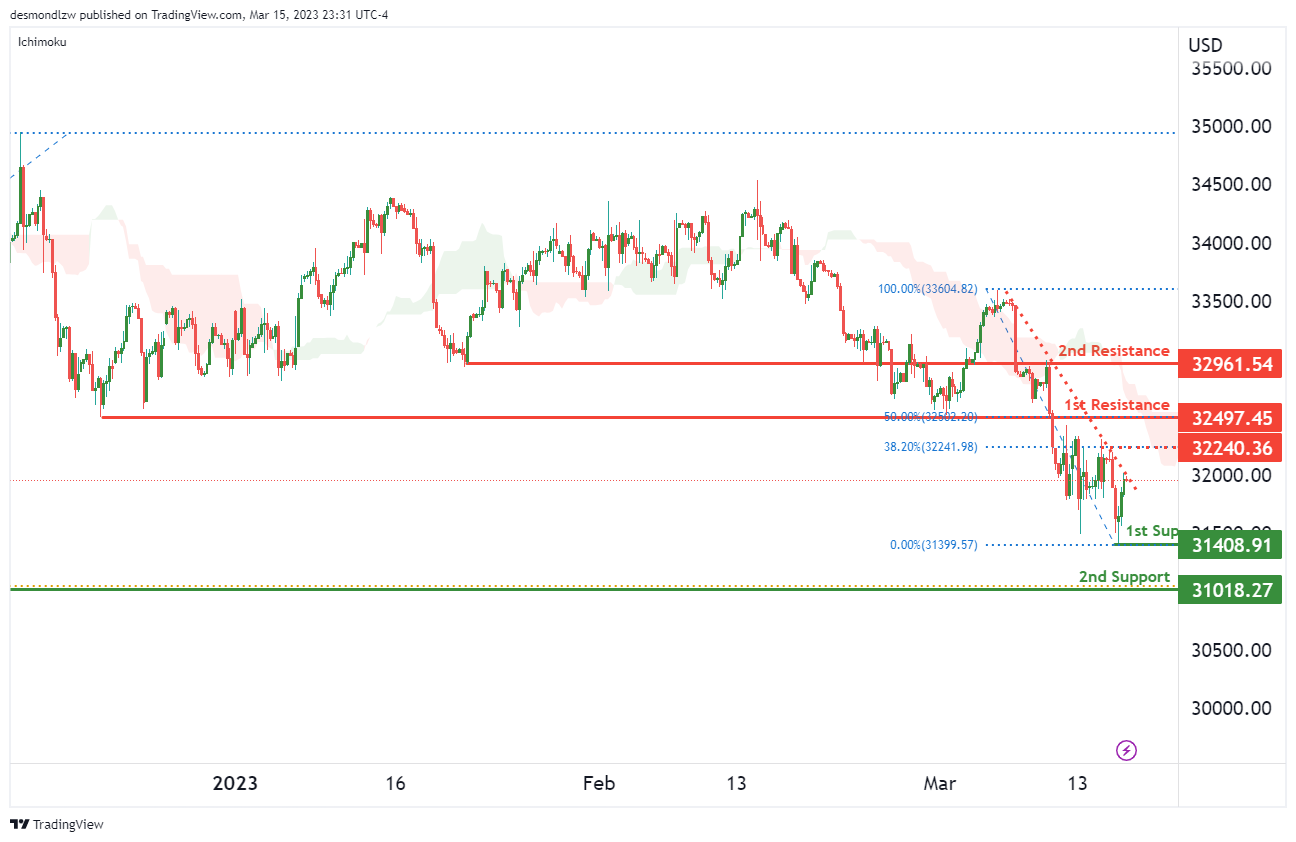
DJ30:
The DJ30 chart currently shows bearish momentum, with the potential for a bearish continuation towards the first support level at 31480.
The first support level at 31480 is a swing low support level, which may provide strong support for the price if it drops.
If the price were to break below the first support level, it could drop to the second support level at 31018, which is also an overlap support level and coincides with a 61.80% Fibonacci retracement.
There is also a first resistance level at 32497, which is a pullback resistance level. If the price were to react bearishly off this level, it could potentially pave the way for further downside potential. This level is also right below the bearish Ichimoku cloud, which usually suggests that the price might reverse from there.
There is also an intermediate resistance level at 32240, which is a multi-swing high resistance level, and a second resistance level at 32961, which is an overlap resistance level. If the price were to break above these levels, it could potentially invalidate the bearish scenario.
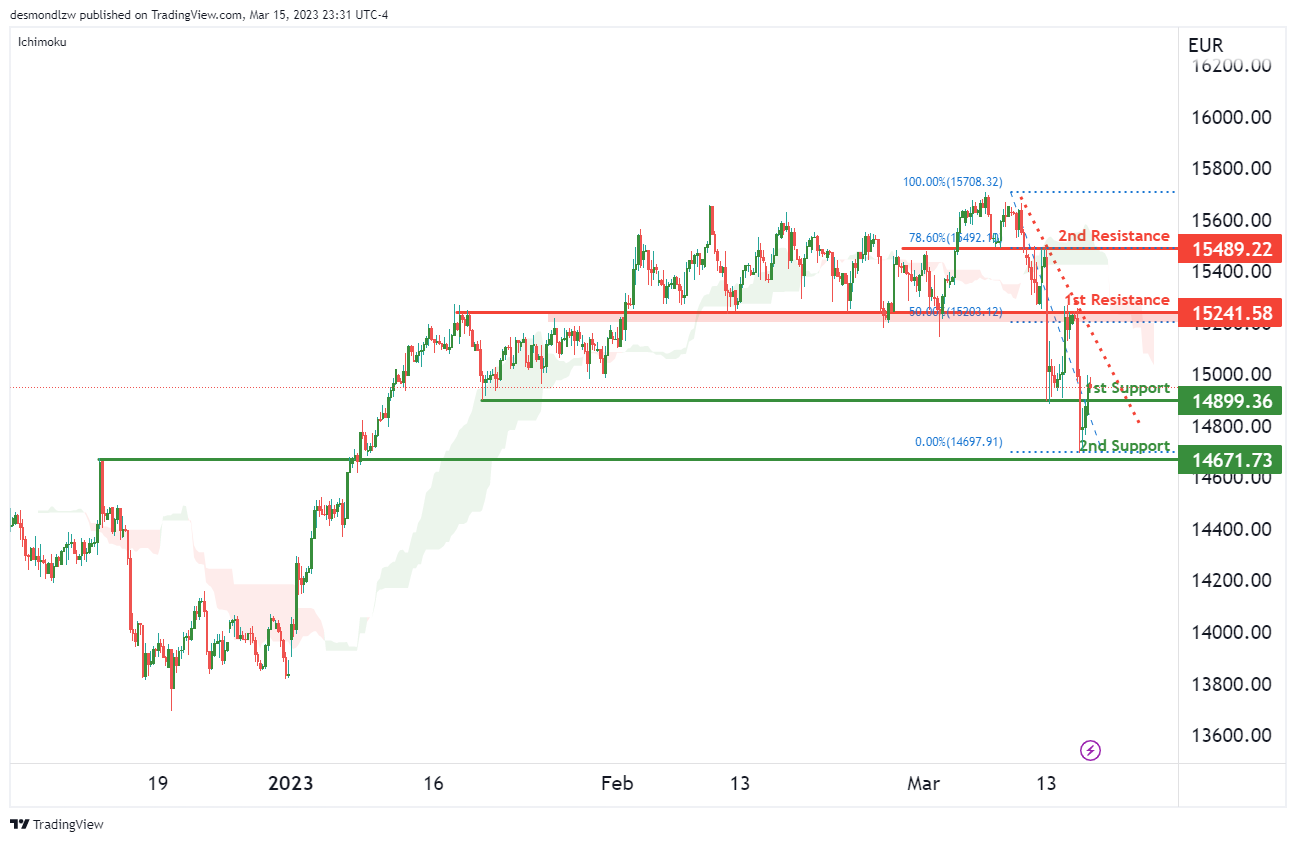
GER30:
The GER30 chart is currently showing bearish momentum, with potential for a bearish continuation towards the first support level at 14899.
The first support level at 14899 is an overlap support level, which could provide strong support for the price if it continues to drop.
If the price were to break below the first support level, it could drop to the second support level at 14671, which is also an overlap support level.
There is also a first resistance level at 15241, which is an overlap resistance level. If the price were to react bearishly off this level, it could potentially pave the way for further downside potential. This resistance level is also right below the bearish Ichimoku cloud, which usually suggests that the price might reverse from there. Additionally, the level is testing a descending trend line that acts as resistance and coincides with the 50% Fibonacci retracement level.
There is also a second resistance level at 15489, which is an overlap resistance level and coincides with the 78.60% Fibonacci retracement level. If the price were to break above this level, it could potentially invalidate the bearish scenario.
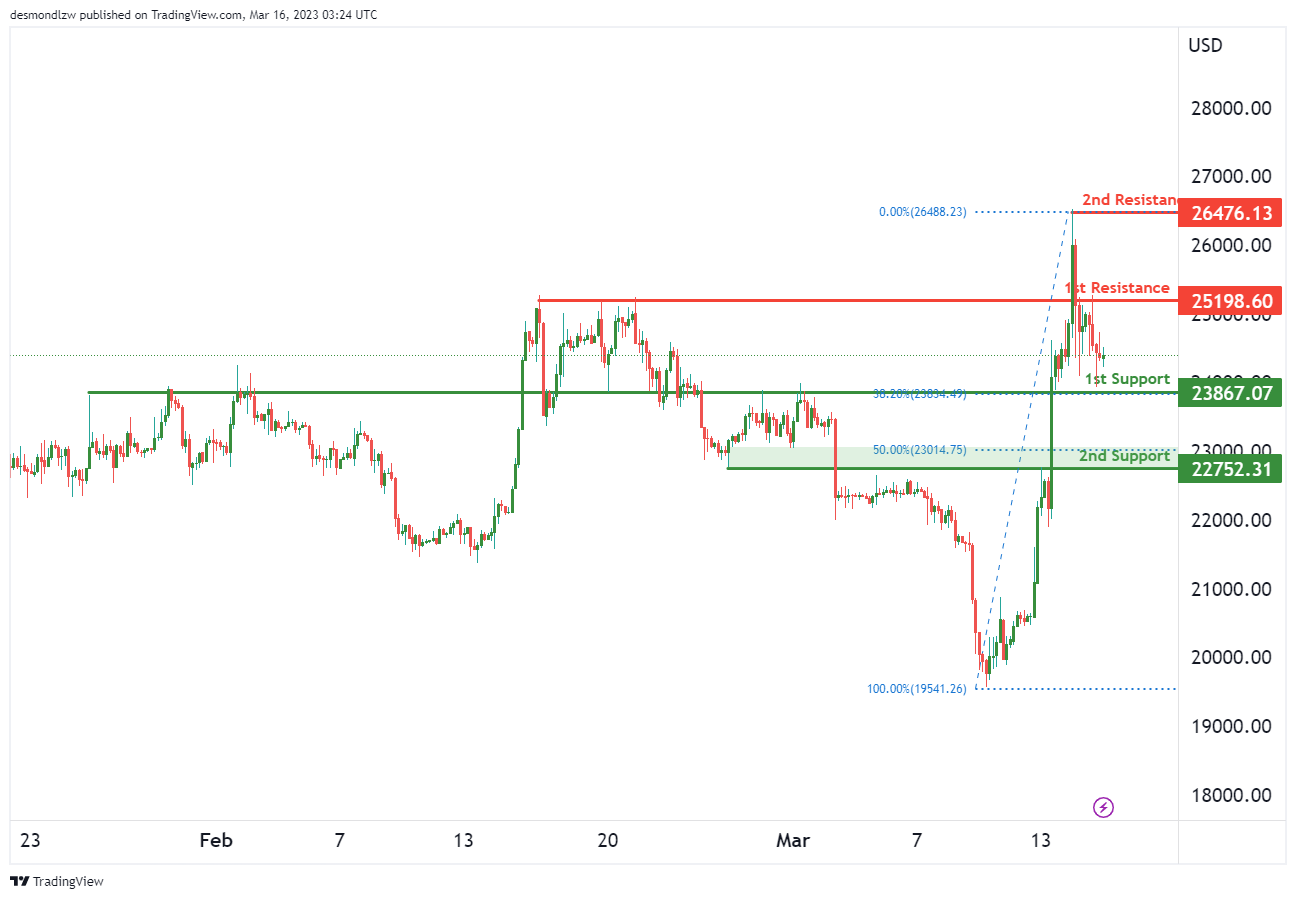
BTC/USD:
The BTC/USD chart is currently showing bearish momentum with the potential for a bearish continuation towards the first support level at 23865. This level is an overlap support and coincides with a 38.20% Fibonacci retracement, which could provide strong support for the price if it drops.
If the price were to break below the first support level, it could drop to the second support level at 22752, which is also an overlap support level and coincides with a 50% Fibonacci retracement.
There is a first resistance level at 25198, which is an overlap resistance level. If the price were to react bearishly off this level, it could potentially pave the way for further downside potential.
There is also a second resistance level at 26476, which is a swing high resistance level. If the price were to break above this level, it could potentially invalidate the bearish scenario.
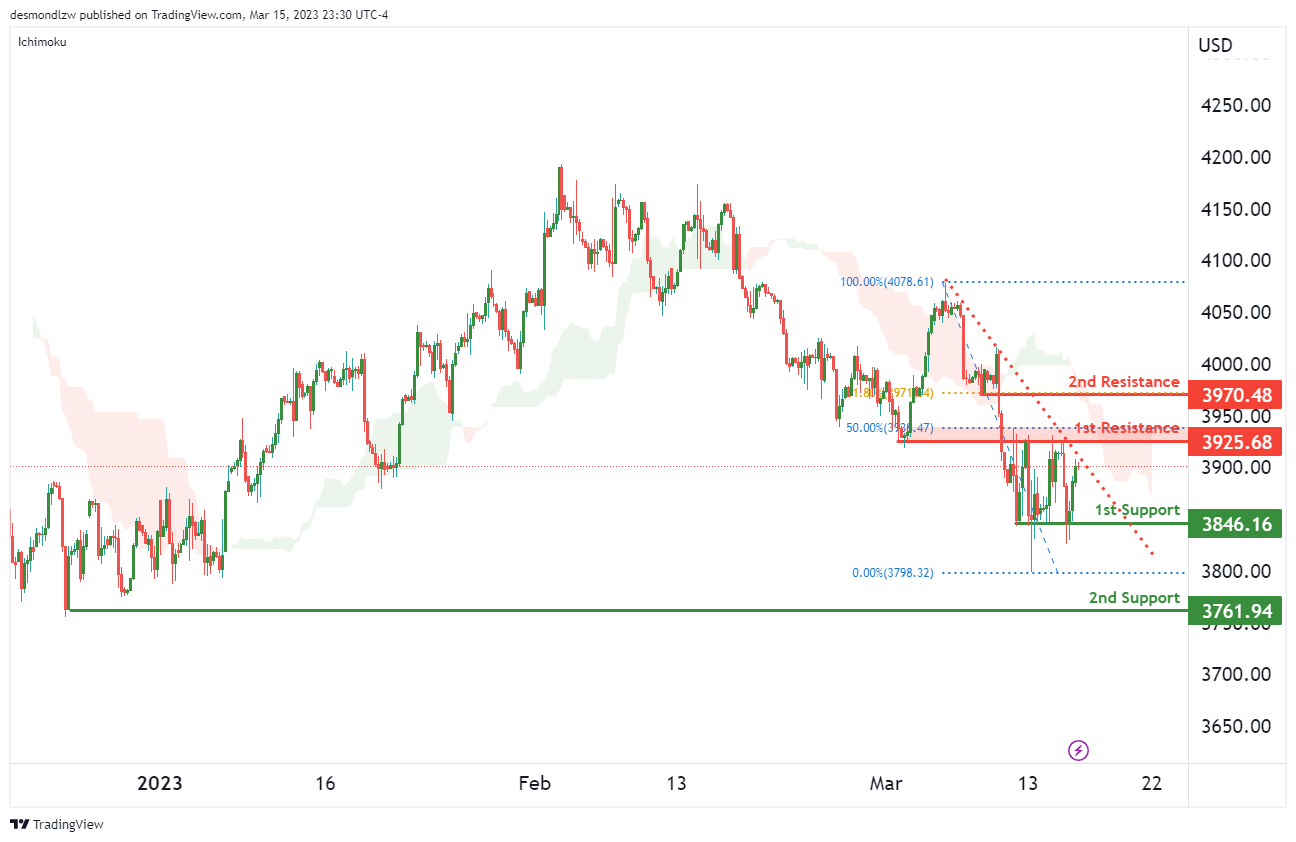
US500
The US500 chart is showing bearish momentum, with potential for a bearish continuation towards the first support level at 3846.
The first support level at 3846 is a multi-swing low support level, which may provide strong support for the price if it drops.
If the price were to break below the first support level, it could drop to the second support level at 3761, which is also a swing low support level.
There is also a first resistance level at 3925, which is an overlap resistance level. If the price were to react bearishly off this level, it could potentially pave the way for further downside potential. Additionally, the first resistance level is right below the bearish Ichimoku cloud, which usually suggests that the price might reverse from there. Furthermore, the price is testing a descending trend line which acts as resistance, adding to the potential resistance at this level.
There is also a second resistance level at 3970, which is a pullback resistance level, coinciding with a 61.80% Fibonacci retracement.
Overall, the US500 chart suggests a bearish continuation bias, with potential for the price to drop from the first resistance level towards the first support level.
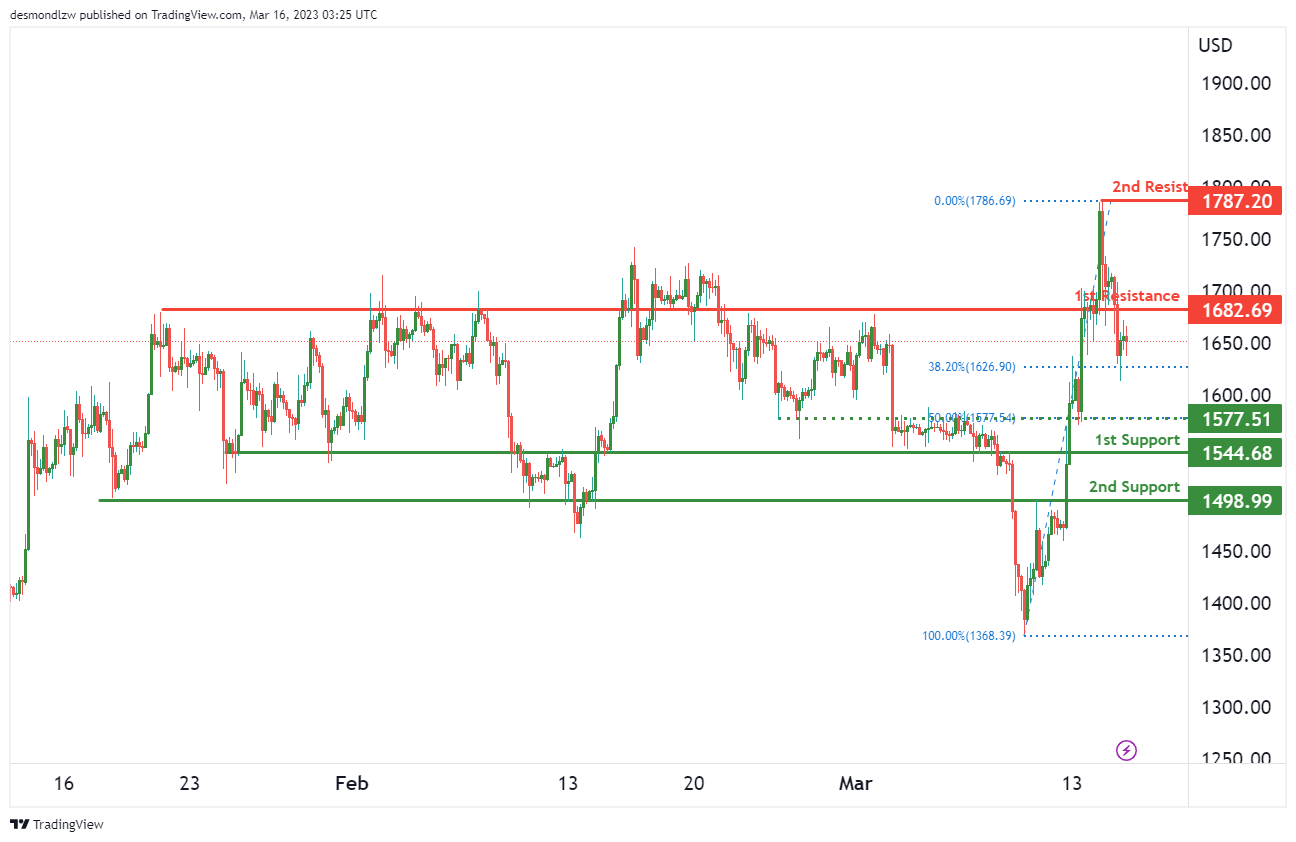
ETH/USD:
ETH/USD chart is currently bearish. The price could potentially make a bearish reaction off the first resistance level at 1782 and drop to the first support level at 1577.
The first support level at 1577 is a pullback support level and could provide strong support for the price if it drops.
If the price were to break below the first support level, it could drop to the second support level at 1498, which is also a pullback support level.
There is also a first resistance level at 1782, which is an overlap resistance level. If the price were to react bearishly off this level, it could potentially pave the way for further downside potential.
There is also a second resistance level at 1787, which is a swing high resistance level. If the price were to break above this level, it could potentially invalidate the bearish scenario.
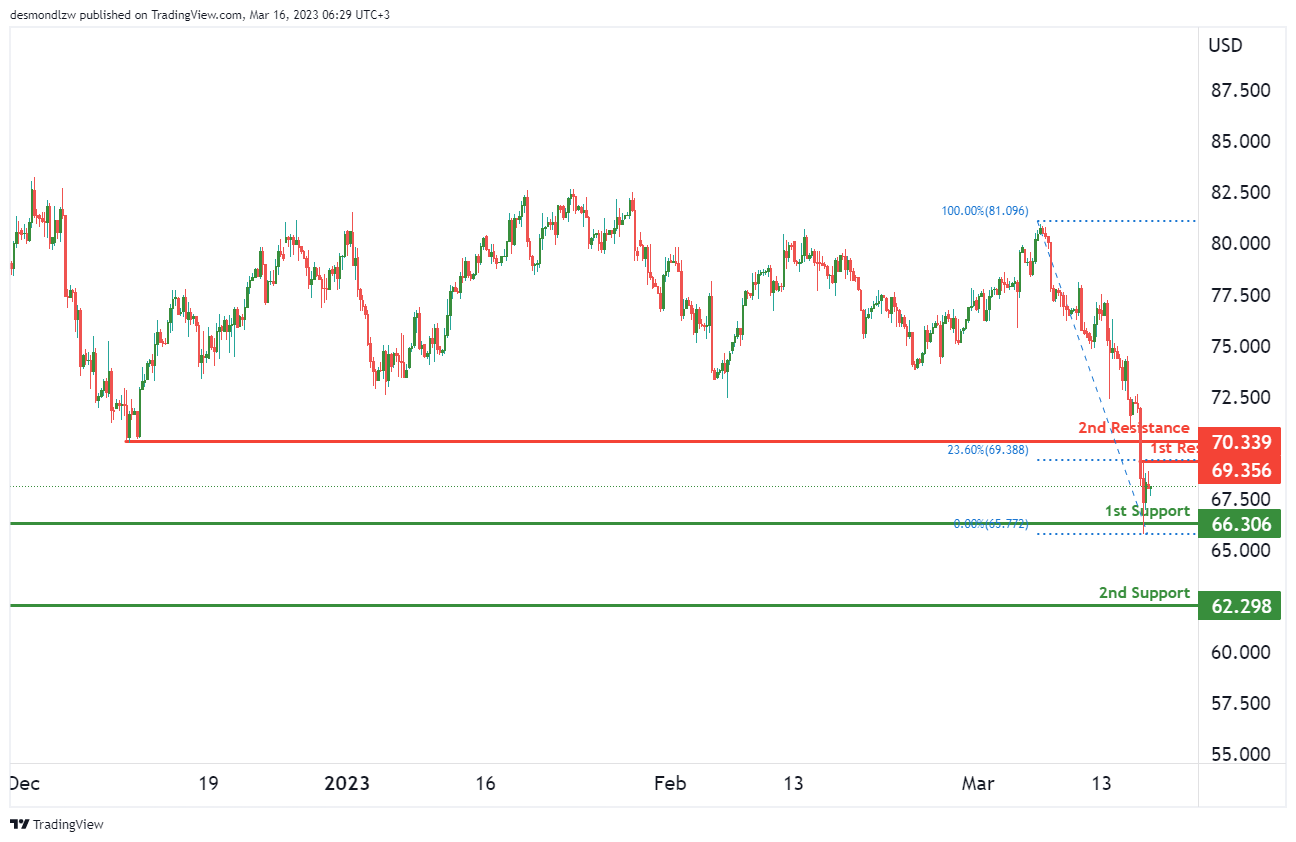
WTI/USD:
WTI chart is currently showing bullish momentum. There is potential for a bullish bounce off the first support level at 66.30, heading towards the first resistance level at 69.35.
The first support level at 66.30 is a swing low support level, which may provide strong support for the price if it drops.
If the price were to break below the first support level, it could drop to the second support level at 62.29, which is also a swing low support level.
There is also a first resistance level at 69.35, which is a swing high resistance level and coincides with a 23.60% Fibonacci retracement level. If the price were to break above this level, it could potentially pave the way for further upside potential.
There is also a second resistance level at 70.33, which is a pullback resistance level. If the price were to break above this level, it could further confirm the bullish scenario.
XAU/USD (GOLD):
XAU/USD is bearish, and the price could potentially make a bearish reaction off the first resistance level at 1937.00 and drop to the first support level at 1890.00.
The first support level at 1890.00 is an overlap support level coinciding with a 38.20% Fibonacci retracement, which may provide strong support for the price if it drops. If the price were to break below this level, it could drop to the second support level at 1861.00, which is also an overlap support level and coincides with a 61.80% Fibonacci retracement.
There is also a first resistance level at 1937.00, which is a swing high resistance level. If the price were to react bearishly off this level, it could potentially pave the way for further downside potential. There is also a second resistance level at 1959.00, which is also a swing high resistance level.
An intermediate support level at 1907.00, which is a swing low support level and coincides with a 23.60% Fibonacci retracement, could potentially provide a minor support level if the price were to drop.

The accuracy, completeness and timeliness of the information contained on this site cannot be guaranteed. IC Markets does not warranty, guarantee or make any representations, or assume any liability regarding financial results based on the use of the information in the site.
News, views, opinions, recommendations and other information obtained from sources outside of www.icmarkets.com, used in this site are believed to be reliable, but we cannot guarantee their accuracy or completeness. All such information is subject to change at any time without notice. IC Markets assumes no responsibility for the content of any linked site.
The fact that such links may exist does not indicate approval or endorsement of any material contained on any linked site. IC Markets is not liable for any harm caused by the transmission, through accessing the services or information on this site, of a computer virus, or other computer code or programming device that might be used to access, delete, damage, disable, disrupt or otherwise impede in any manner, the operation of the site or of any user’s software, hardware, data or property.


