
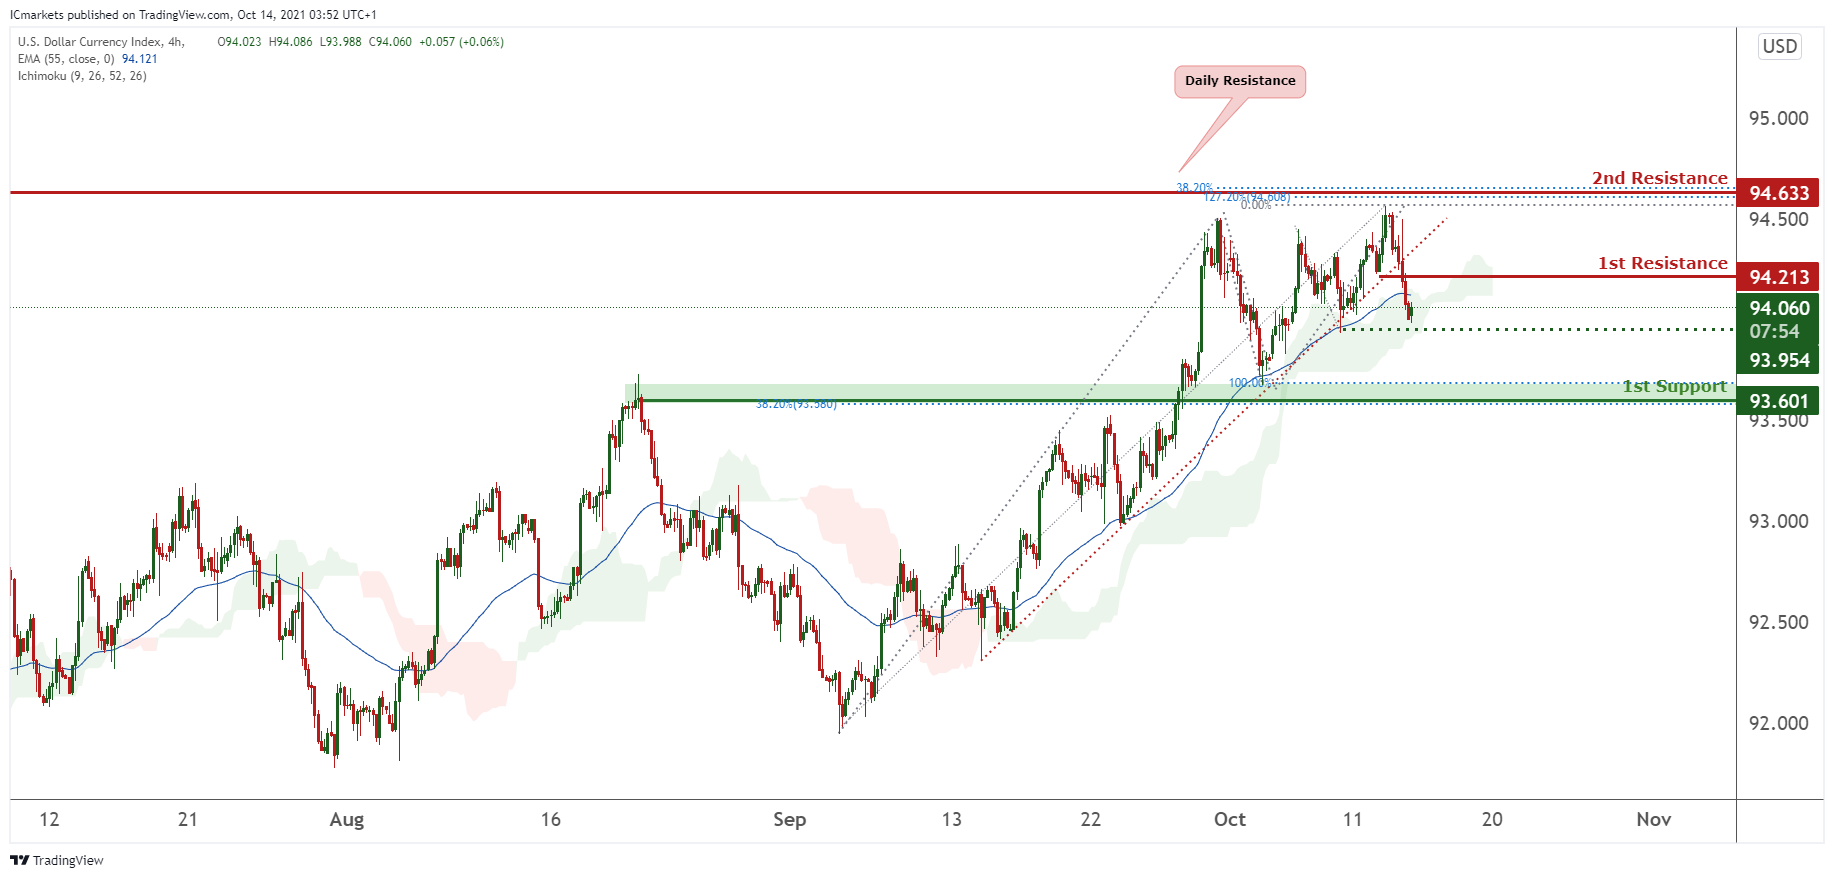
DXY:
On the H4 timeframe, prices have recently broken our bullish trendline and are dipping towards our intermediate support at 93.954. We would expect a high probability of prices to be attracted to our 1st support at 38.2% Fibonacci retracement and 100% Fibonacci extension. Alternatively, prices might climb higher towards our 2nd resistance at 94.633 in line with 38.2% and 127.2% Fibonacci extension, which is also a daily resistance.
Areas of consideration:
- H4 time frame, 2nd resistance at 94.633
- H4 time frame, 1st resistance at 94.213
- H4 time frame 1st support at 93.601
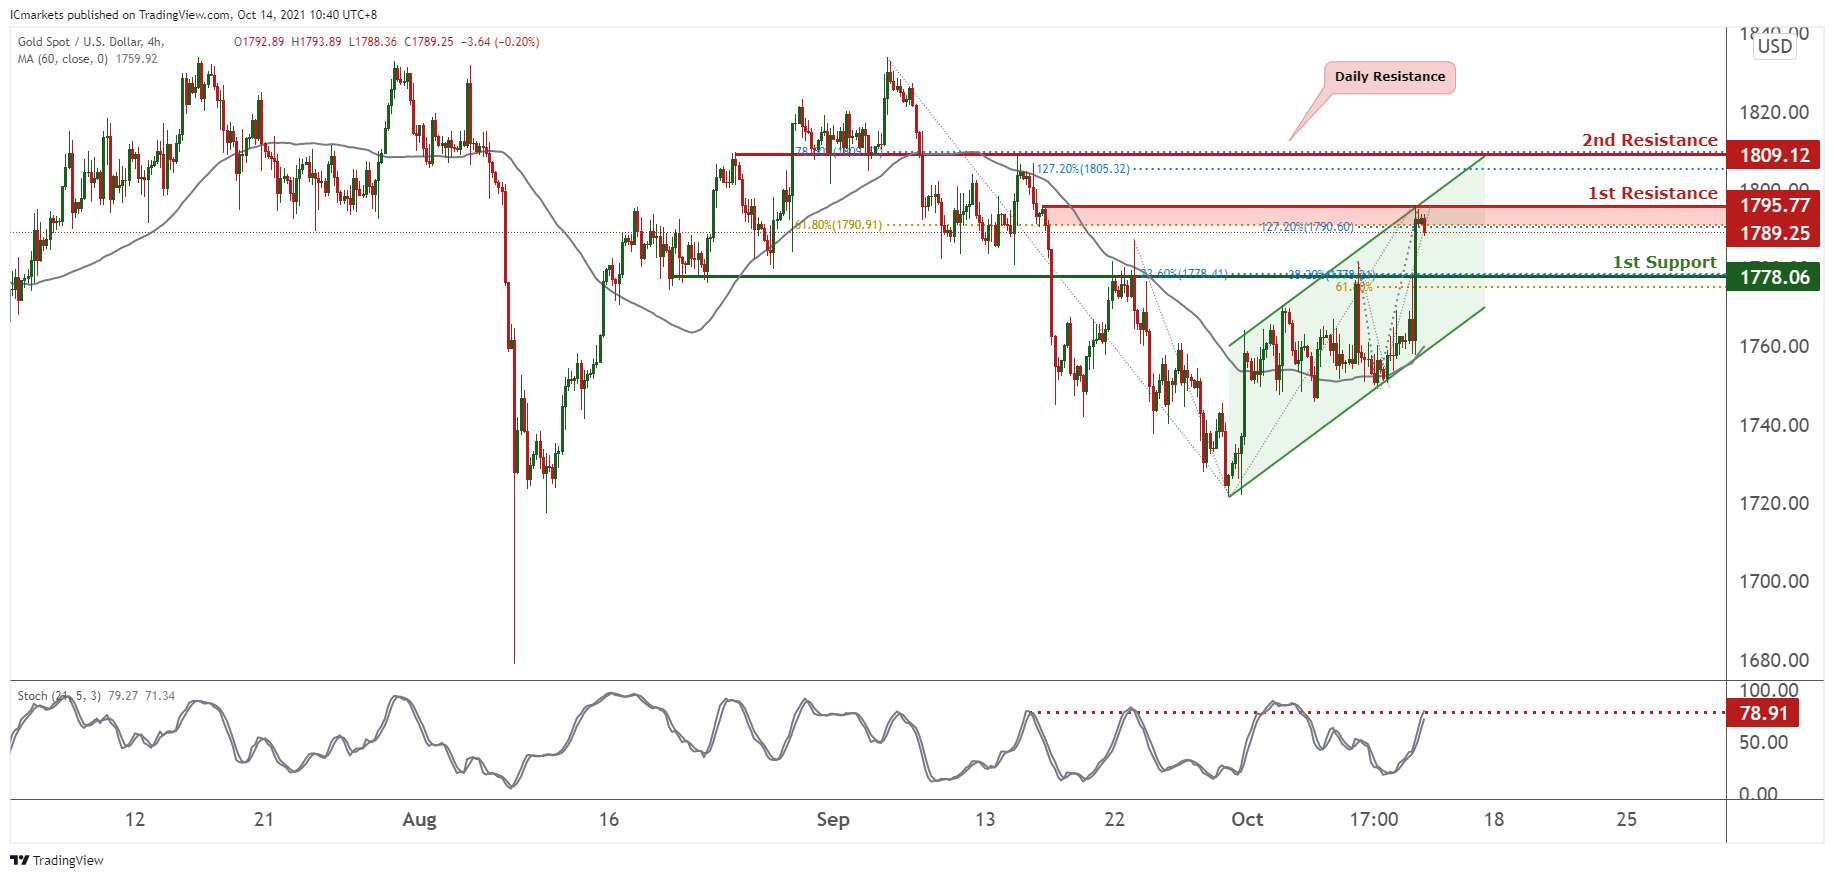
XAU/USD (GOLD):
On the H4 chart, prices appear to be consolidating in a parallel channel. Prices have recently tested the top of our parallel channel and we would expect a drop from our 1st resistance at 1789.25 in line with 127.2% Fibonacci extension and 61.8% Fibonacci retracement towards our 1st support at 17778.06 in line with 61.8%, 78.6% and 38.2% Fibonacci retracement. Stochastics are at a level where dips previously happened. Alternatively, prices break our bullish channel, it might climb towards our 2nd resistance at 1809.12 in line with 78.6% Fibonacci retracement.
Areas of consideration:
- 4h 1st support at 1768.86
- 4h intermediate support at 1776.91
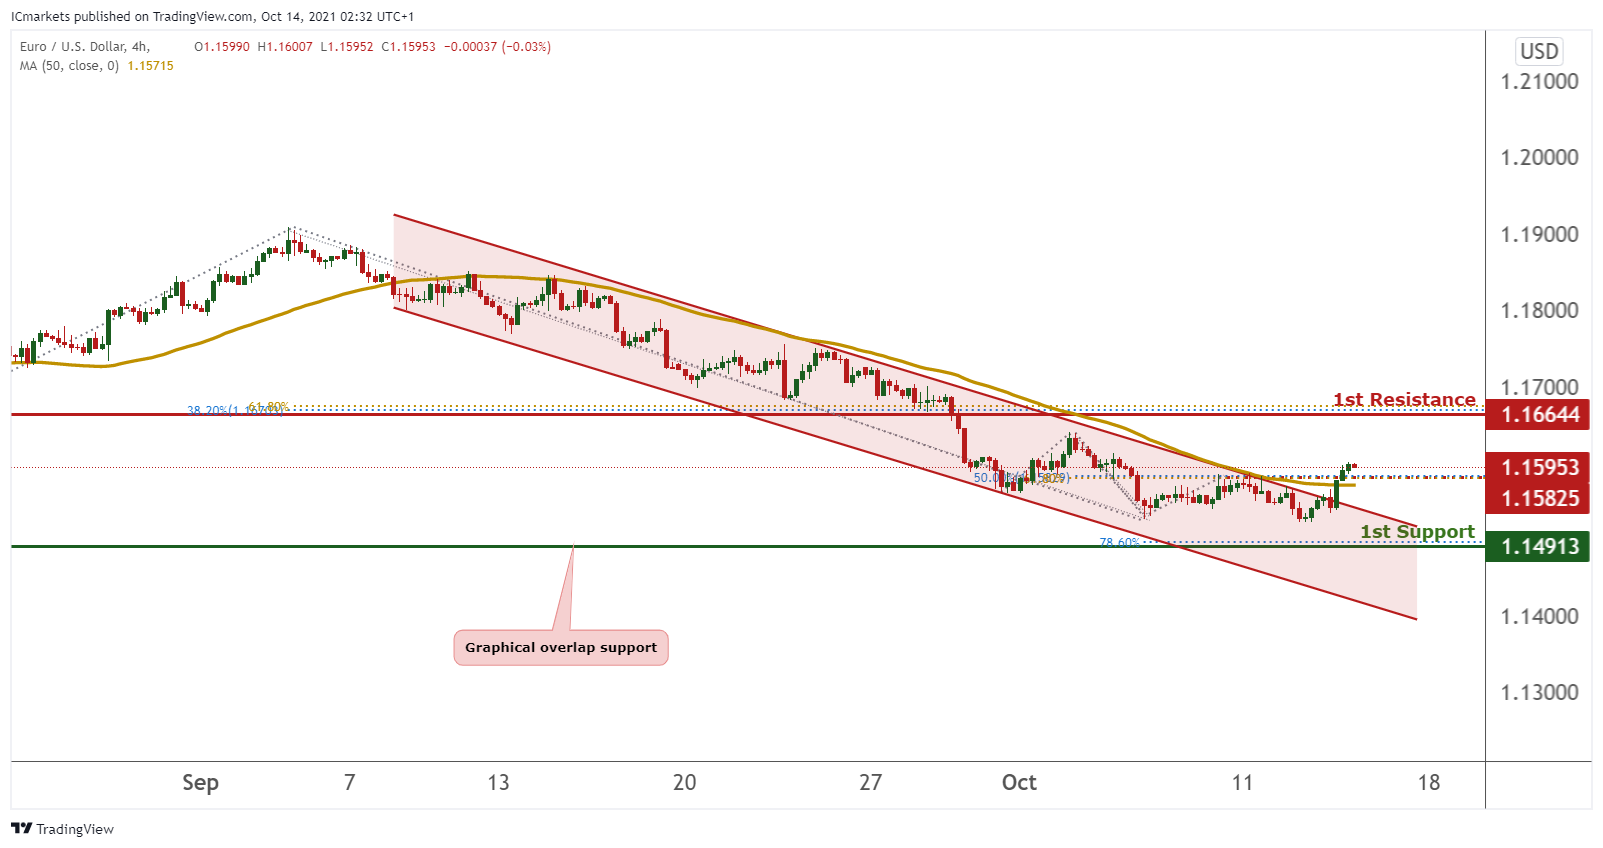
EUR/USD:
On the H4 chart , price has recently broken out of the descending channel and may continue its bullish momentum to our first resistance of 1.16644 which is also our Fibonacci projection level of 61.8% and retracement level of 38.2%. Alternatively if price retest and fail to break our channel, price can potentially go to our first support which is our graphical overlap support and Fibonacci projection level of 78.6%. Our bullish bias is supported by our Natural moving average as price is trading above it.
Key considerations:
1st resistance : 1.16644
1st support : 1.14913
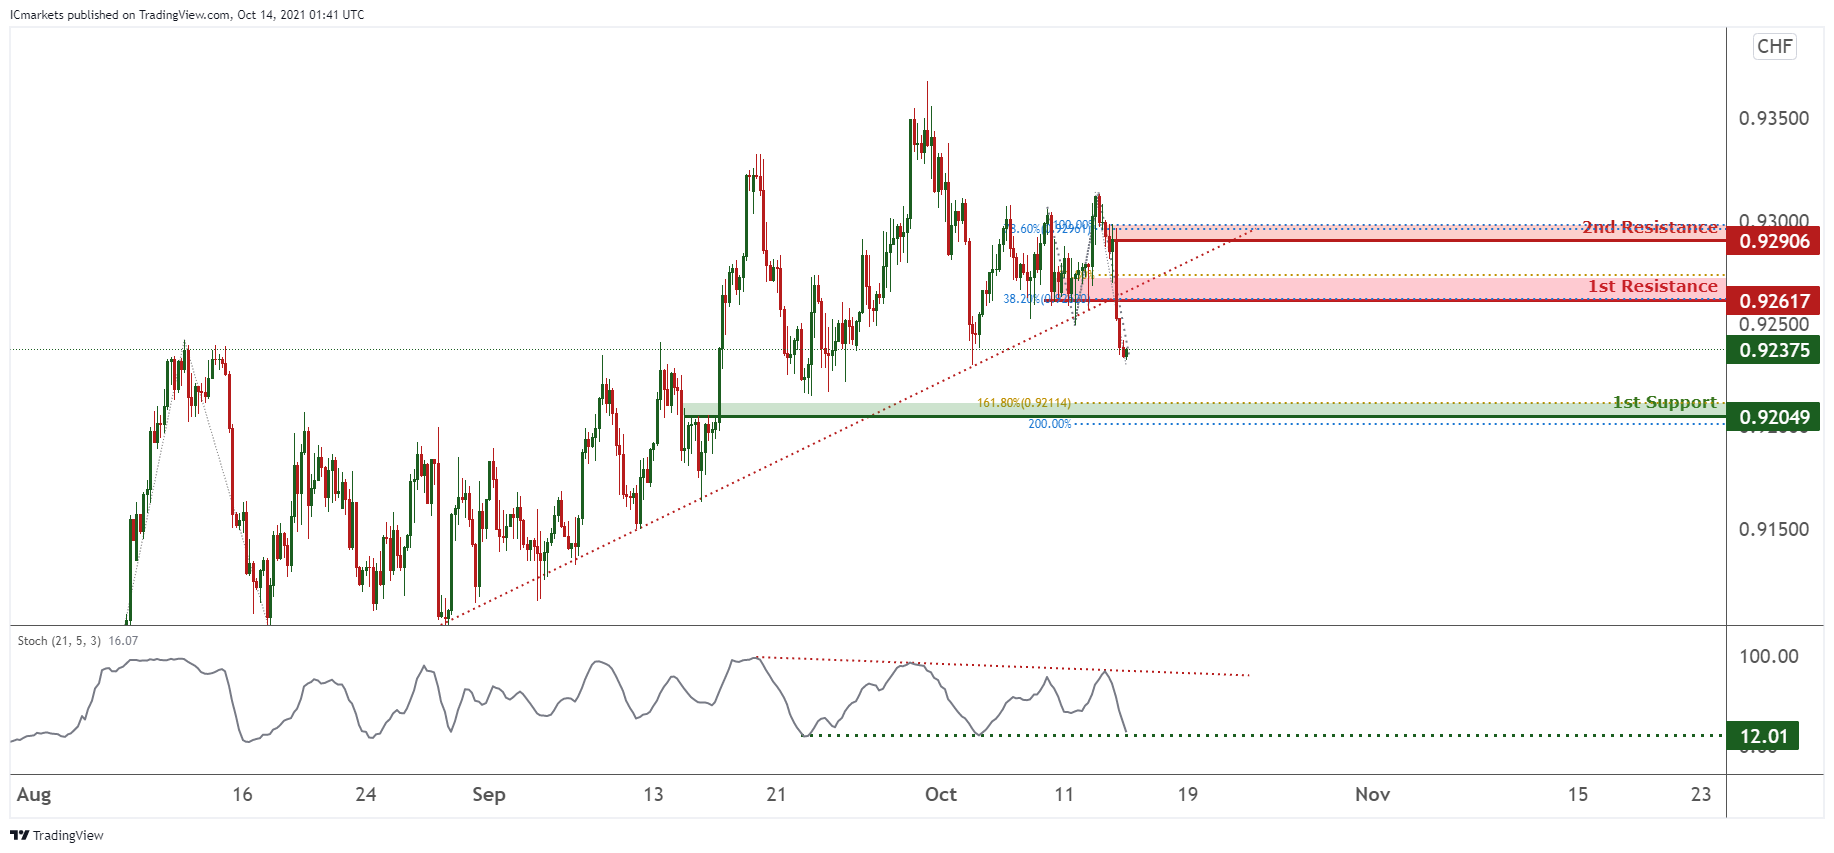
USD/CHF:
On the H4, price is seen to have broken past the ascending trendline support, signifying a bearish momentum. We can expect the price to move all the way down from the 1st resistance in line with 38.2% Fibonacci retracement and 61.8% Fibonacci projection and drop towards the 1st Support in line with 161.8% Fibonacci retracement and 200% Fibonacci projection. Further downside confirmation, if price passes through the intermediate support.
Areas of consideration:
- Watch 1st Support at 0.92028
- Watch 1st Resistance at 0.92617
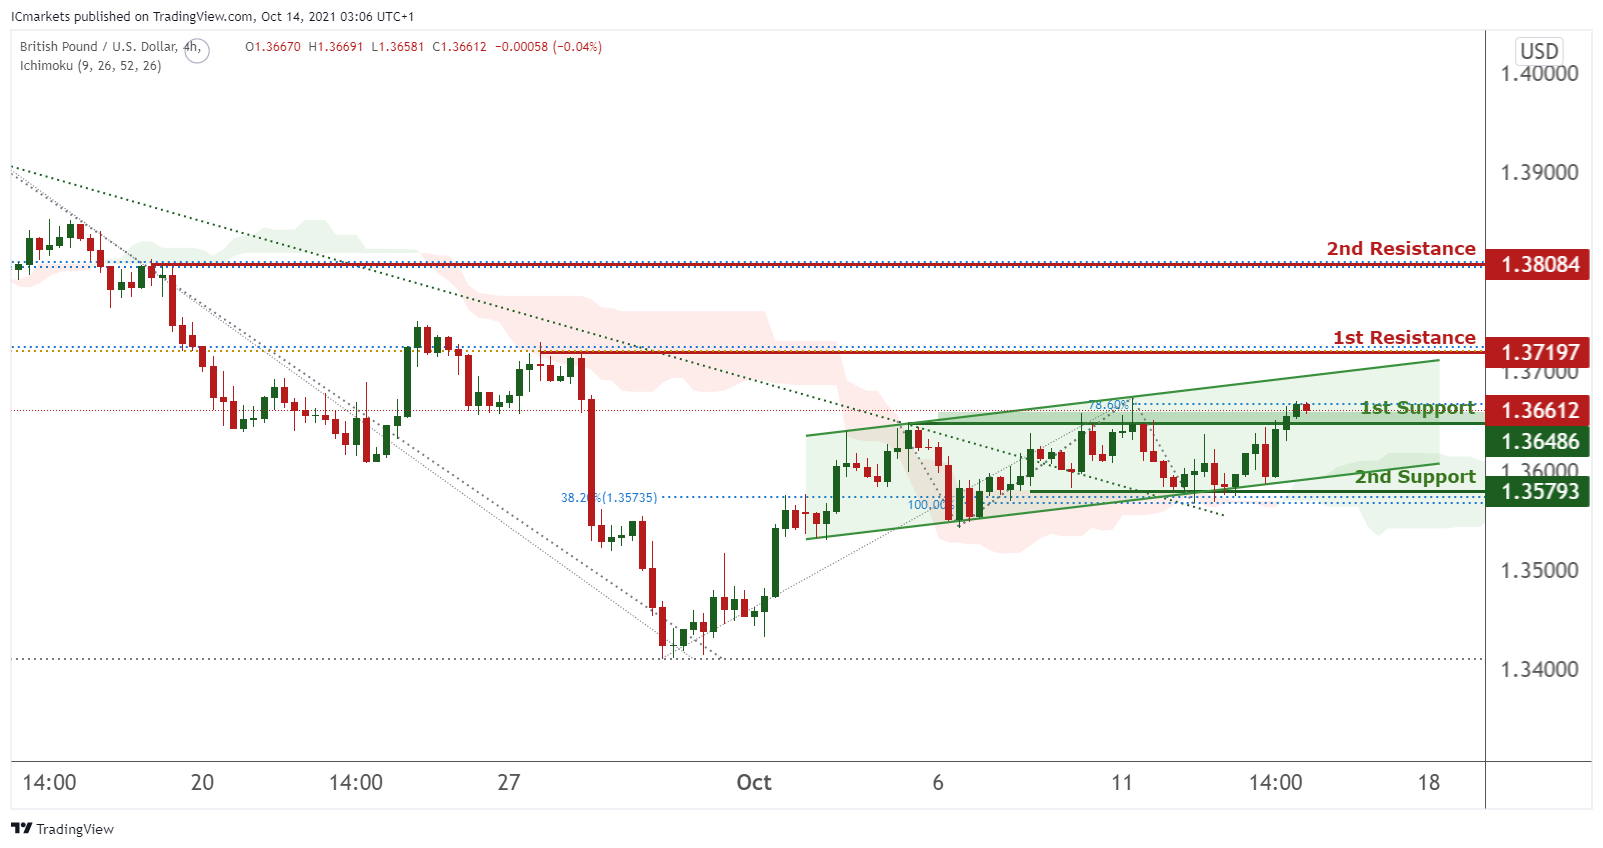
GBP/USD:
On the H4 chart , Price is trading in an ascending channel and can potentially continue its bullish momentum to the first resistance of 1.37197 which is also our Fibonacci projection of 100% and retracement level of 61.8%. Alternatively if price were to break from our first support price can potentially dip back to the 2nd support which is also the support of our ascending channel. Our bullish bias is supported by our Ichimoku indicator as price is trading above it.
Key considerations :
1st resistance – 1.37197
1st support – 1.36486
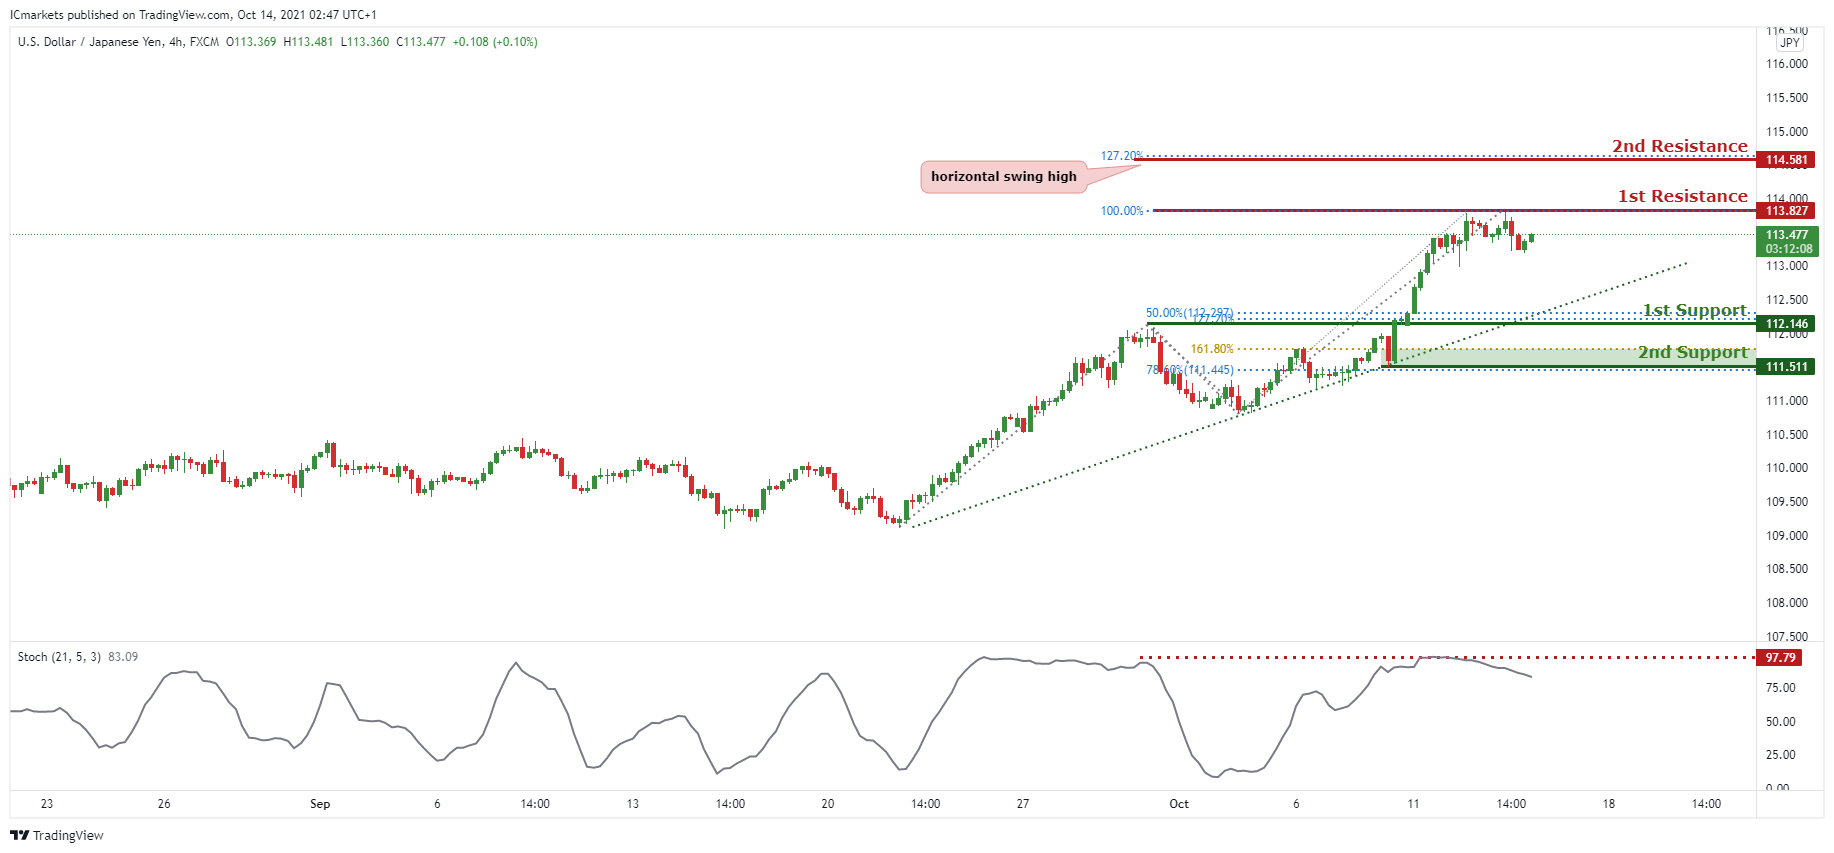
USD/JPY
On the H4 timeframe, we can see that price is abiding by the ascending trendline and we can see price has reached the 1st resistance just as we expected yesterday. Now, we can expect the price to reverse back down to the 1st Support in line with the 50% Fibonacci retracement , 100% Fibonacci projection and ascending trendline support. Our short-term bearish bias is further supported by the stochastic indicator where the %K line touched the resistance level and dropped.
Areas of consideration:
- H4 1st resistance level 114.581
- H4 1st support level 112.146
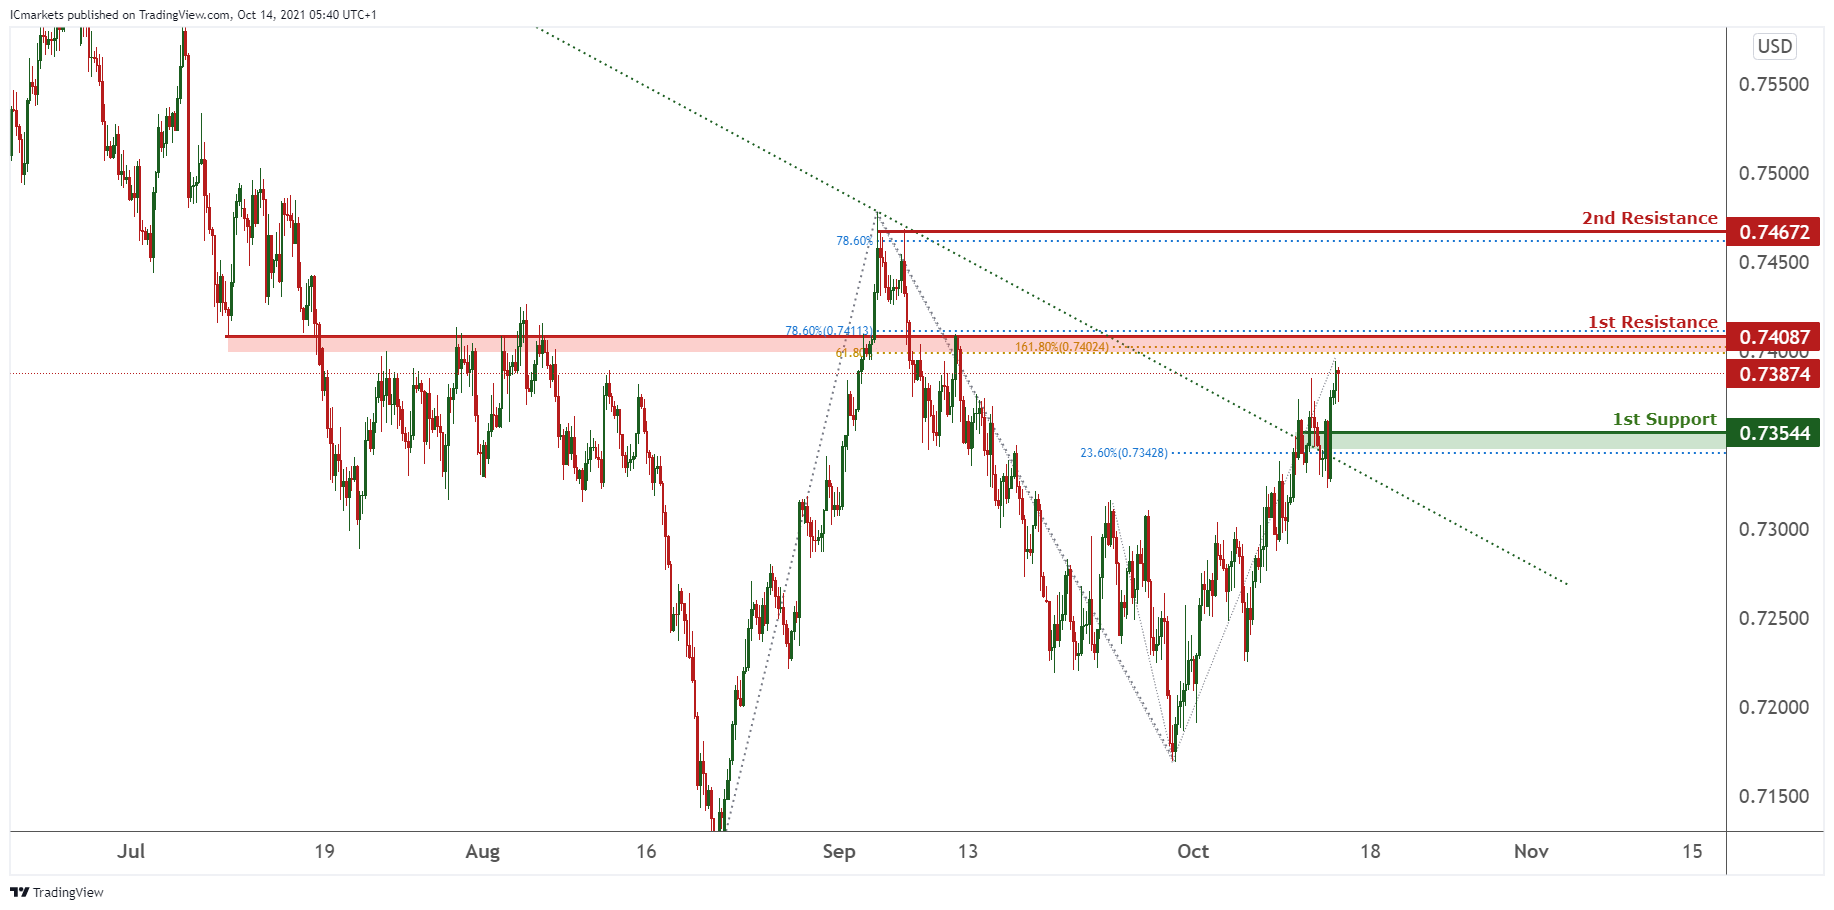
AUD/USD:
On the H4, price is seen to have broken out of the descending trendline resistance, signifying a bullish momentum. Price have bounced off the 1st support, we can expect a short-term bearish momentum from 1st Resistance in line with 161.8% Fibonacci retracement, 78.6% Fibonacci retracement and 61.8% Fibonacci projection.
Areas of consideration:
- H4 1st resistance level 0.74087
- H4 1st support level 0.73254
NZD/USD:
On the H4 timeframe, price was consolidating in a triangle and appears to be on a bullish momentum. We would watch and highlight our intermediate resistance at 0.69750 for a reversal. If prices break the intermediate resistance, it might potentially climb towards our 1st resistance at 0.70138 which is an area of Fibonacci confluences. Alternatively, prices may dip to our 1st support at 0.69547 which is a graphical overlap. Technical indicators are showing bullish momentum.
Areas of consideration:
- H4 time frame, intermediate resistance at 69750
- H4 time frame, 1st resistance at 0.70138

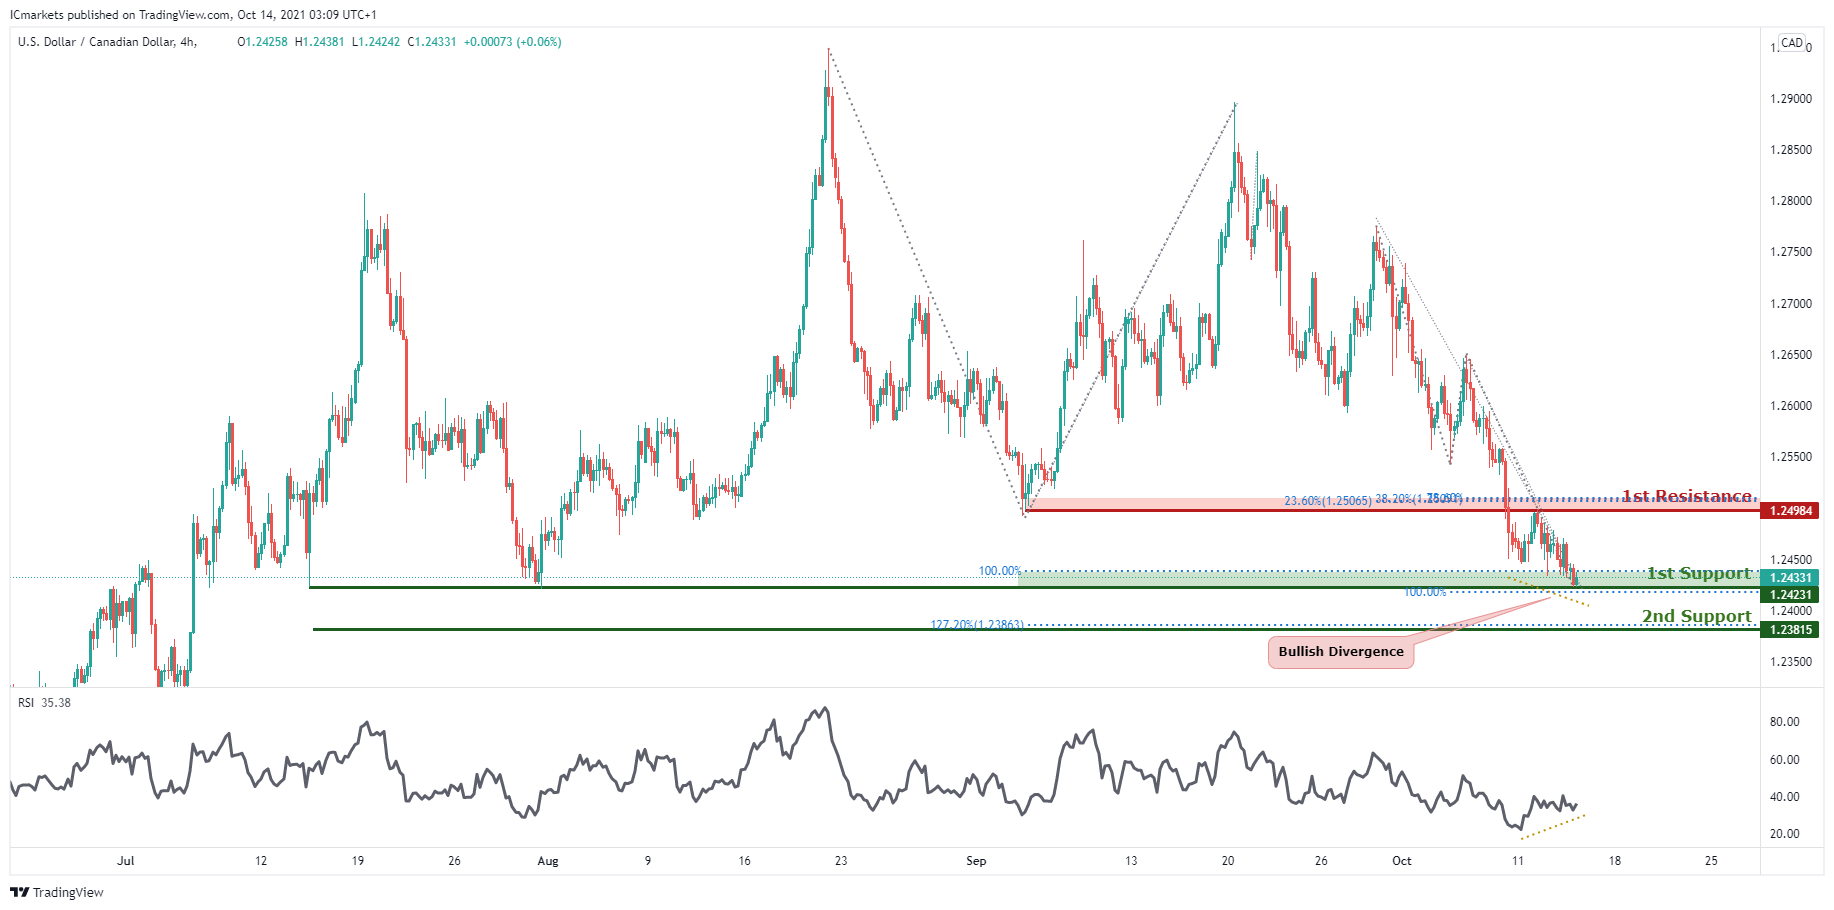
USD/CAD:
On the H4, we are expecting to see price do a bounce from 1st support at 1.24231 in line with two 100% Fibonacci projection levels taken from different points to 1st resistance at 1.24984 in line with the 38.2% and 23.6% Fibonacci retracement and a 78.6% fibonacci projection. Our current bullish bias is supported by the existing bullish divergence where the RSI indicator is showing an uptrend, making higher lows and where price is doing a downtrend, making lower lows. Alternatively, if price breaks structure at 1st support, we may see price head for 2nd support at 1.23815 in line with the 127.2% Fibonacci extension.
Areas of consideration:
- H4 time frame, support at 1.24231
- H4 time frame, resistance at 1.24984
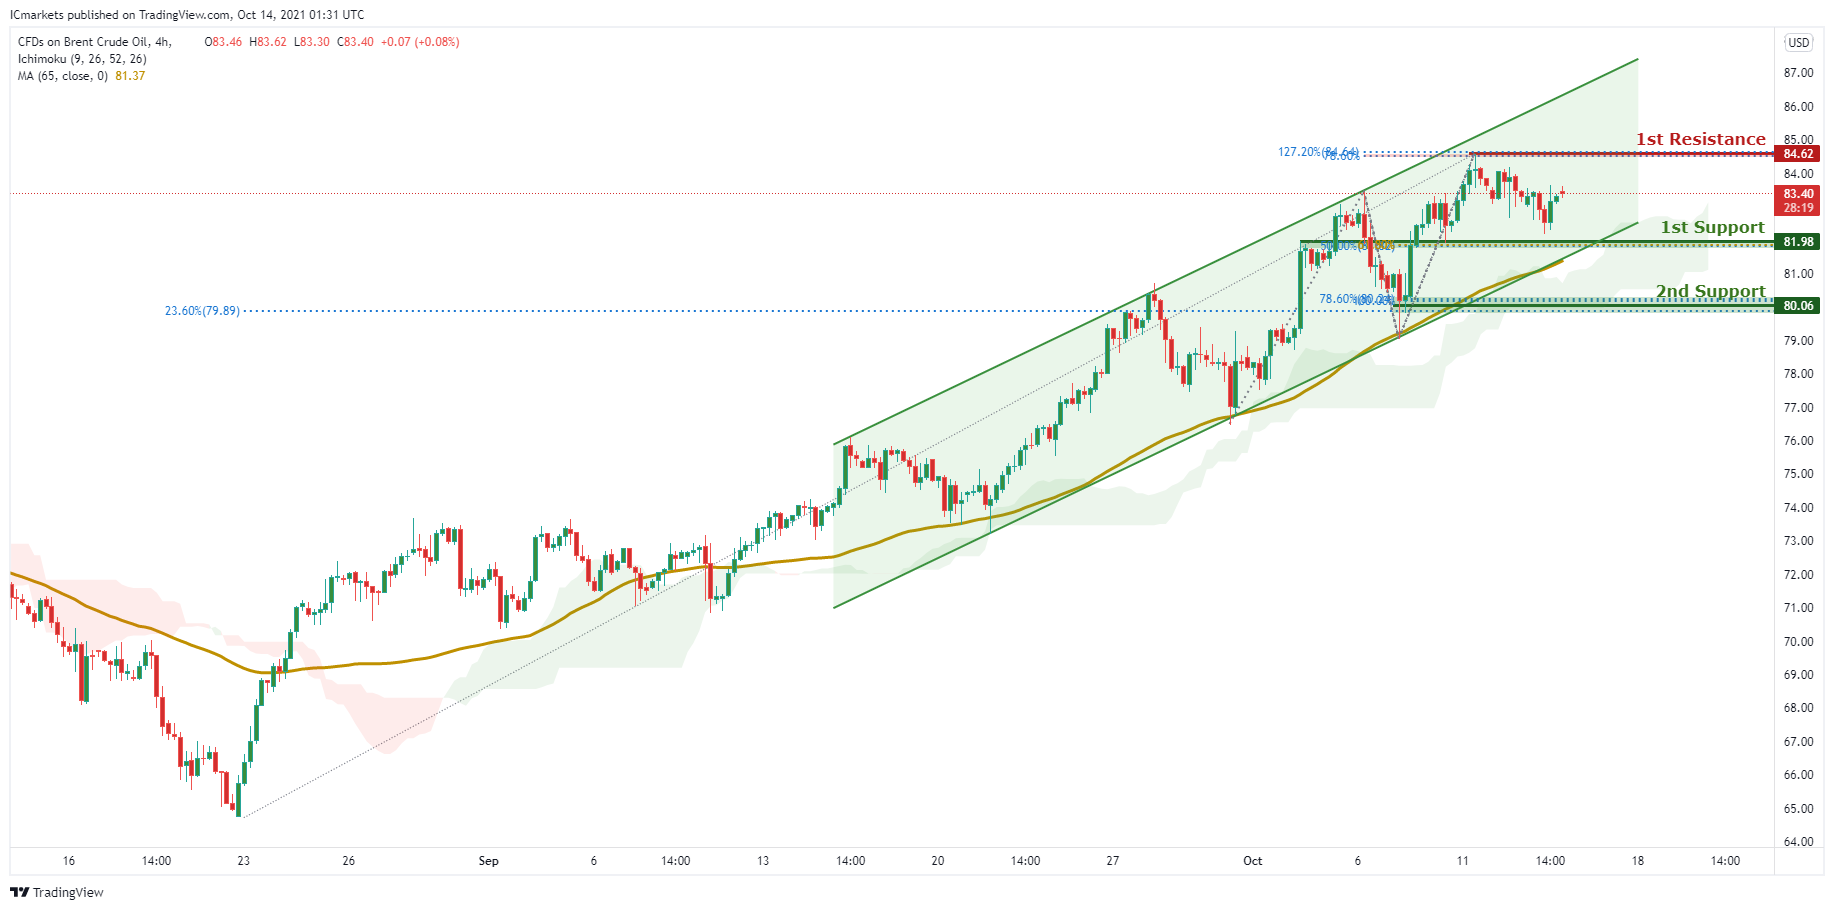
OIL:
On the H4 timeframe, although we have a bullish bias which is supported by the ichimoku indicator and the ascending channel, there may still be room for short term downwards movement as price is at the mid of the channel. Hence, we may see price head for 1st support at 81.98 in line with the 61.8% fibonacci retracement which is closer to the support of the trend line and ichimoku cloud as well before heading for 1st resistance at 84.62 in line with the 78.6% Fibonacci projection and 127.2% Fibonacci retracement. Otherwise, we may see price head straight to 1st resistance from its current position.
Areas of consideration:
- H4 time frame, 1st resistance of 84.62
- H4 time frame, 1st support of 81.98
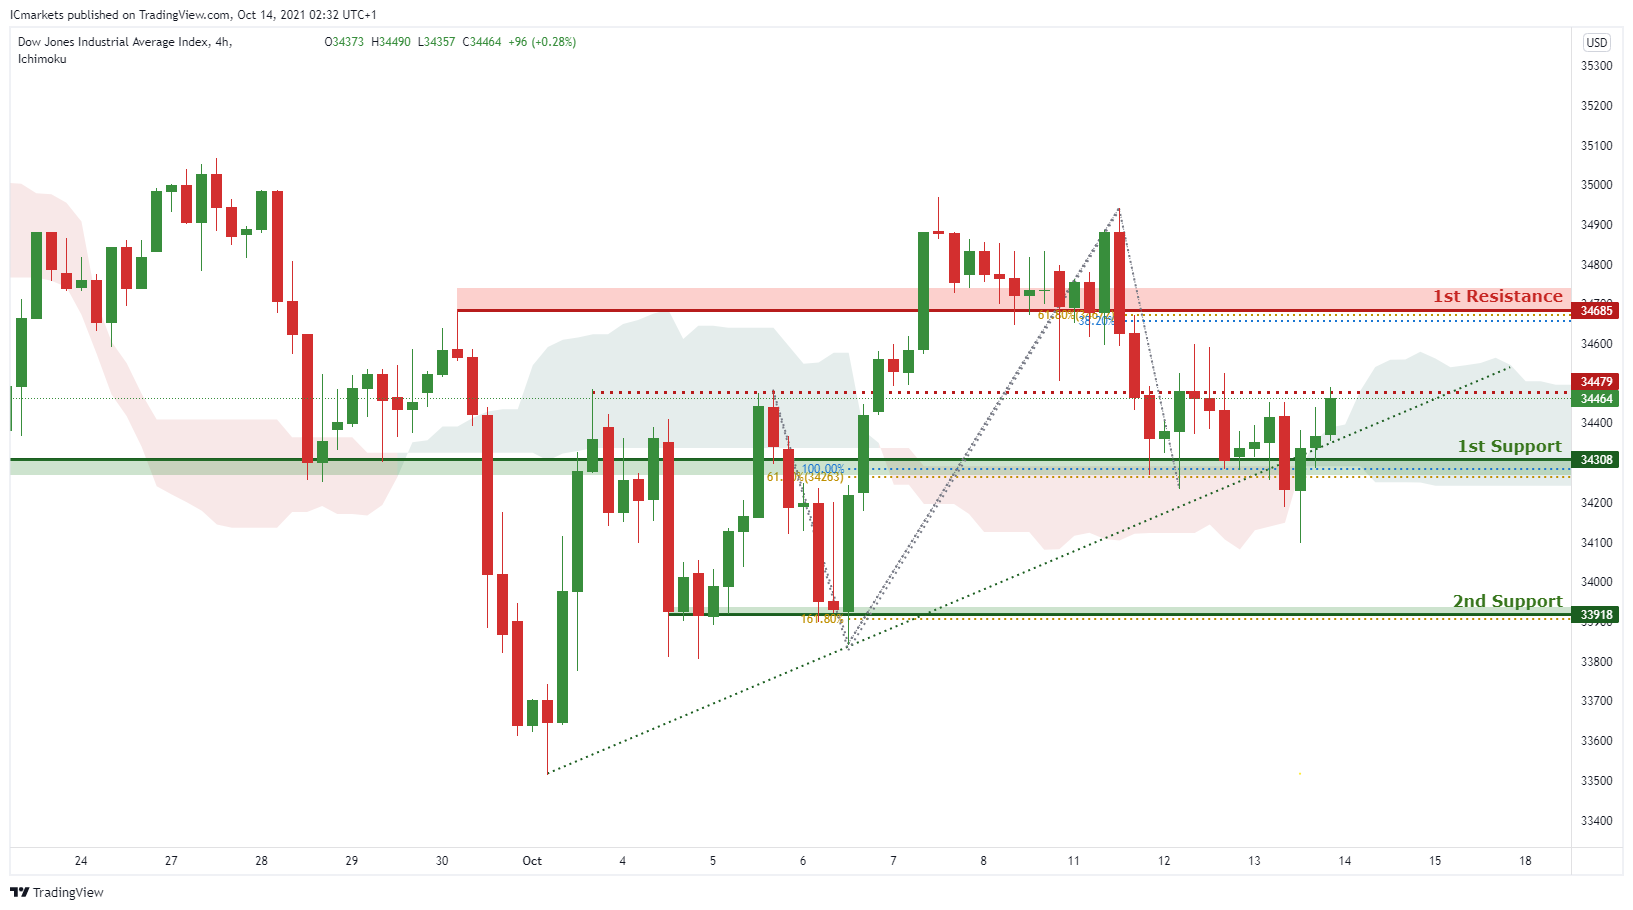
Dow Jones Industrial Average:
On the H4, with a bullish bias, we may expect to see price head to 1st resistance at 34685 in line with the 38.2% Fibonacci retracement and 61.8% Fibonacci projection. Otherwise if price breaks structure at 1st support at 34308 in line with the 61.8% Fibonacci retracement and 100% Fibonacci projection, we may see further bearish movements to 2nd support at 33918 in line with the 161.8% Fibonacci projection. Our bullish bias is supported by the ichimoku where price is moving above it along with the existing ascending trend line.
Areas of consideration:
- 4H resistance at 34685
- 4H support at 34308
The accuracy, completeness and timeliness of the information contained on this site cannot be guaranteed. IC Markets does not warranty, guarantee or make any representations, or assume any liability regarding financial results based on the use of the information in the site.
News, views, opinions, recommendations and other information obtained from sources outside of www.icmarkets.com.au, used in this site are believed to be reliable, but we cannot guarantee their accuracy or completeness. All such information is subject to change at any time without notice. IC Markets assumes no responsibility for the content of any linked site.
The fact that such links may exist does not indicate approval or endorsement of any material contained on any linked site. IC Markets is not liable for any harm caused by the transmission, through accessing the services or information on this site, of a computer virus, or other computer code or programming device that might be used to access, delete, damage, disable, disrupt or otherwise impede in any manner, the operation of the site or of any user’s software, hardware, data or property.