
Key risk events today:
German Prelim GDP q/q; UK Retail Sales m/m; US PPI m/m and Core PPI m/m; Fed Chair Powell Testifies; Crude Oil Inventories; (CHF) Governor Board Member Maechler Speaks.
Market news brief (Wednesday):
The Reserve Bank of New Zealand (RBNZ) left rates on hold, a decision not expected by market forces.
UK Consumer Prices Index (CPI) including owner occupiers’ housing costs (CPIH) 12-month inflation rate, according to the Office for National Statistics, was 1.5% in October 2019, down from 1.7% in September 2019. UK Core CPI, excluding volatile food, energy, alcohol, and tobacco items, came in as expected at 1.7%.
The US Consumer Price Index for All Urban Consumers (CPI-U) rose 0.4% in October on a seasonally adjusted basis after being unchanged in September, the US Bureau of Labour Statistics reported. The index for all items less food and energy rose 0.2% in October after increasing 0.1% in September.
Federal Reserve Chairman Jerome Powell, in his testimony to the Congressional Joint Economic Committee, largely stuck to the script – policy on hold unless there is a meaningful change in the outlook.
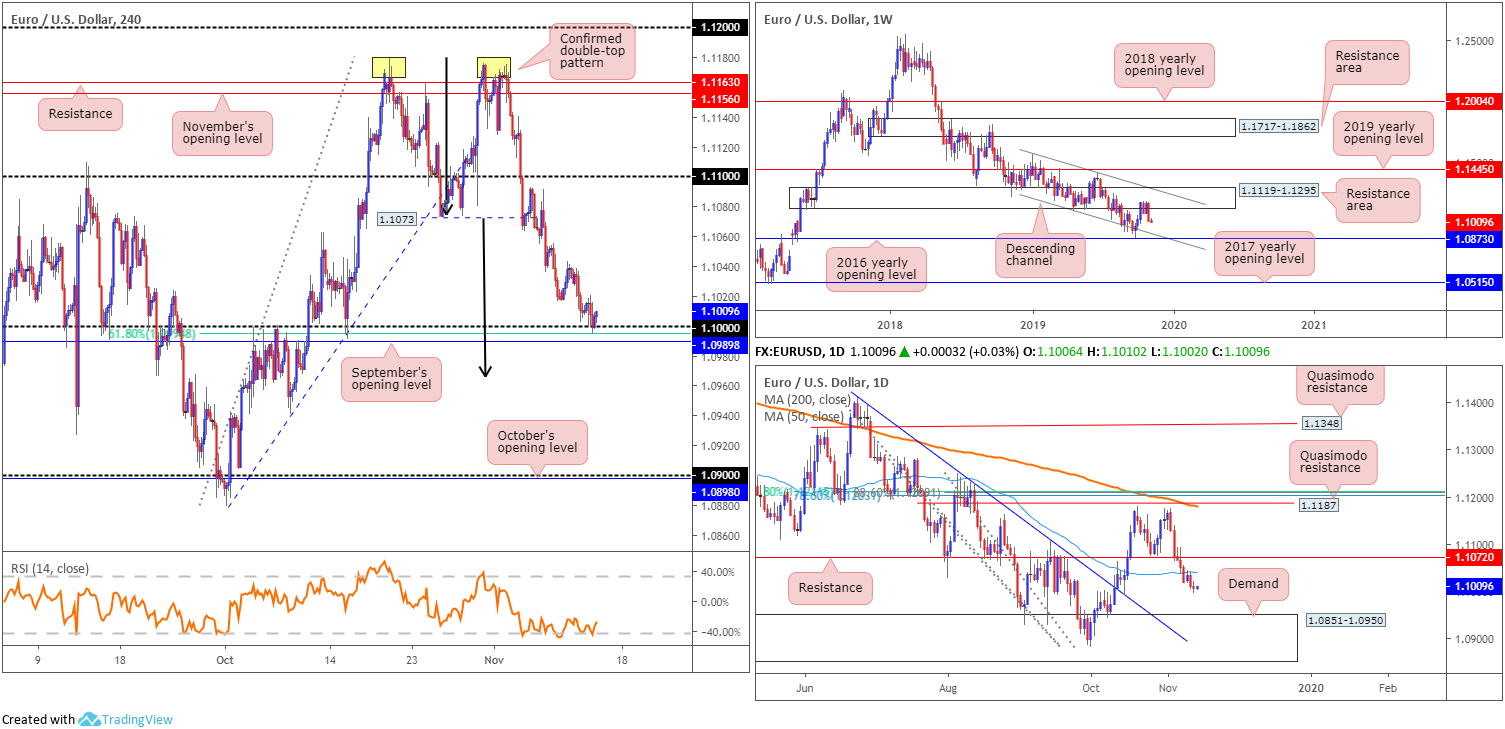
EUR/USD:
Europe’s shared currency finished Wednesday a shade lower vs. the US dollar, drawing price action towards the ‘watched’ 1.10 handle on the H4 timeframe, sited close by September’s opening level at 1.0989 and a 61.8% Fibonacci retracement ratio at 1.0994.
Traders who read recent reports may recall the following pieces:
Chart studies on the H4 timeframe show a distinct double-top pattern formed (peaks plotted at 1.1179/1.1175) after breaking the 1.1073 October 24 low (the confirmation point) on November 5. Some technicians would label the peaks as an ‘eve and eve’ formation, considered to be a higher-probability pattern. The next downside target on this scale can be seen at the 1.10 handle. The double-top’s take-profit target is set beneath this value at 1.0965 (black arrows – measured by taking the value from the tallest peak and adding this to the breakout point).
Weekly flow had sellers marching south from the underside of a long-standing resistance area drawn from 1.1119-1.1295, recording its worst weekly decline since August last week. Increased selling has the lower boundary of a descending channel to target (extended from the low 1.1109), set a few points north of the 2016 yearly opening level at 1.0873. Concerning trend direction, the primary downtrend has been in motion since topping in early 2018 at 1.2555.
Daily movement extended downside from the underside of its 50-day SMA (blue – 1.1039) yesterday, further setting the stage for a potential run towards demand at 1.0851-1.0950 – houses the 2016 yearly opening level mentioned above on the weekly timeframe at 1.0873.
Areas of consideration:
Outlook unchanged.
Traders short the H4 double top pattern likely liquidated a large portion of their position at the 1.10 handle yesterday. Considering its local confluence (sited close by September’s opening level at 1.0989 and a 61.8% Fibonacci retracement ratio at 1.0994), active buying is evident from here, as expected. However, with higher-timeframe structure suggesting a move to as low as the top edge of daily demand plotted at 1.0950, which happens to converge closely with the H4 double-top’s take-profit target – the second take-profit zone, it’s unlikely the buying will be anything to get excited about.
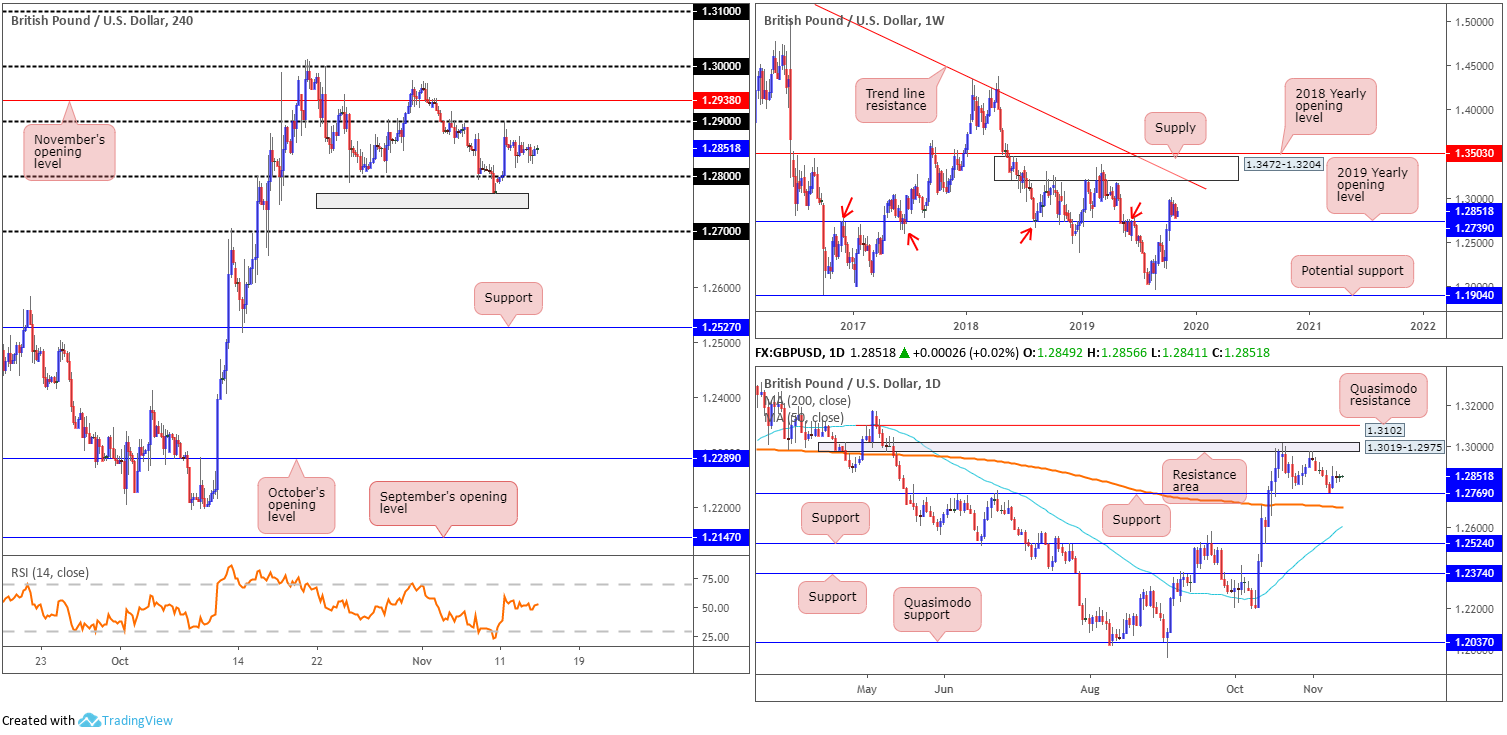
GBP/USD:
Despite somewhat subdued UK inflation and mildly upbeat US inflation figures (see above), GBP/USD movement remained confined to Tuesday’s range between 1.2873/1.2815.
Technically, the H4 candles continue to hover mid-range between 1.29/1.28. Outside of this range, November’s opening level resides at 1.2938, whereas beneath 1.28 we have weekly support at 1.2739 and daily support coming in at 1.2769 (grey zone on the H4 scale).
Upside on the daily timeframe could rally as far north as a resistance area plotted at 1.3019-1.2975, followed closely by Quasimodo resistance at 1.3102, while a break of support mentioned above at 1.2769 has immediate support by way of the 200-day SMA (orange – 1.2699) in sight.
Weekly price, as highlighted above, has support at 1.2739, with a run north from here likely to be capped by supply coming in at 1.3472-1.3204, as well as a long-term trend line resistance extended from the high 1.5930.
Areas of consideration:
An upside break of 1.29 today could draw in November’s opening level at 1.2938, followed closely by the daily resistance area at 1.3019-1.2975 and the key figure 1.30. As you can see, fresh longs above 1.29 may prove problematic. Therefore, bearish scenarios could be an option as we close in on 1.2975/1.30.
Additional longs may also be a worthy contender should the market retest the 1.28 region, or the noted weekly and daily supports (grey area) sited a touch lower.
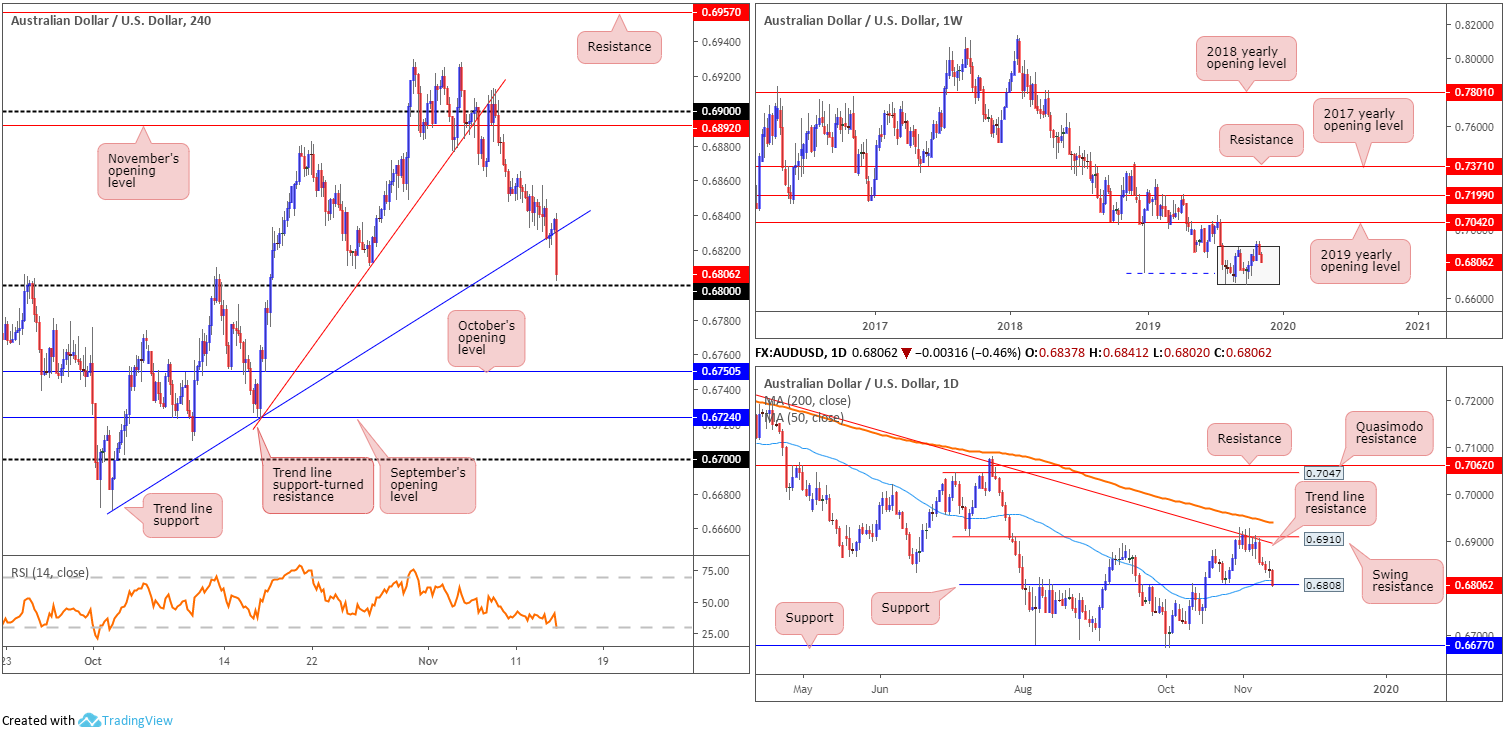
AUD/USD:
In recent hours, the market witnessed a wave of selling, guided by lower-than-expected job’s data out of Australia. The move, according to H4 structure, brushed aside trend line support taken from the low 0.6670, and is currently poised to shake hands with the 0.68 handle. Should 0.68 give way, limited support is visible until connecting with October’s opening level priced in at 0.6750, followed by September’s opening level at 0.6724.
With reference to the bigger picture, the recent two-candle fakeout on the weekly timeframe at the top edge of a 3-month long consolidation zone between 0.6894/0.6677 (light grey) is seen forcing price back into its range. The primary downtrend in this market also clearly remains bearish.
In conjunction with weekly flow, daily price is seen challenging support at 0.6808 after crossing below its 50-day SMA (blue – 0.6817). A break of 0.6808 may find support off 0.6758, though the more visible ‘floor’ falls in around 0.6677.
Areas of consideration:
Seeing weekly price forming a descent back into its range, sellers may have the upper hand. A H4 close beneath 0.68, therefore, would be considered a bearish indicator, targeting 0.6750ish as the initial port of call. Traders interested in selling sub 0.68 may find use in waiting and seeing if a retest forms at the underside of 0.68 before pulling the trigger, preferably by way of a H4 bearish candlestick formation (entry and risk can be set according to the candle pattern structure). This is simply due to psychological levels often falling victim to whipsaws, or ‘stop-runs’.
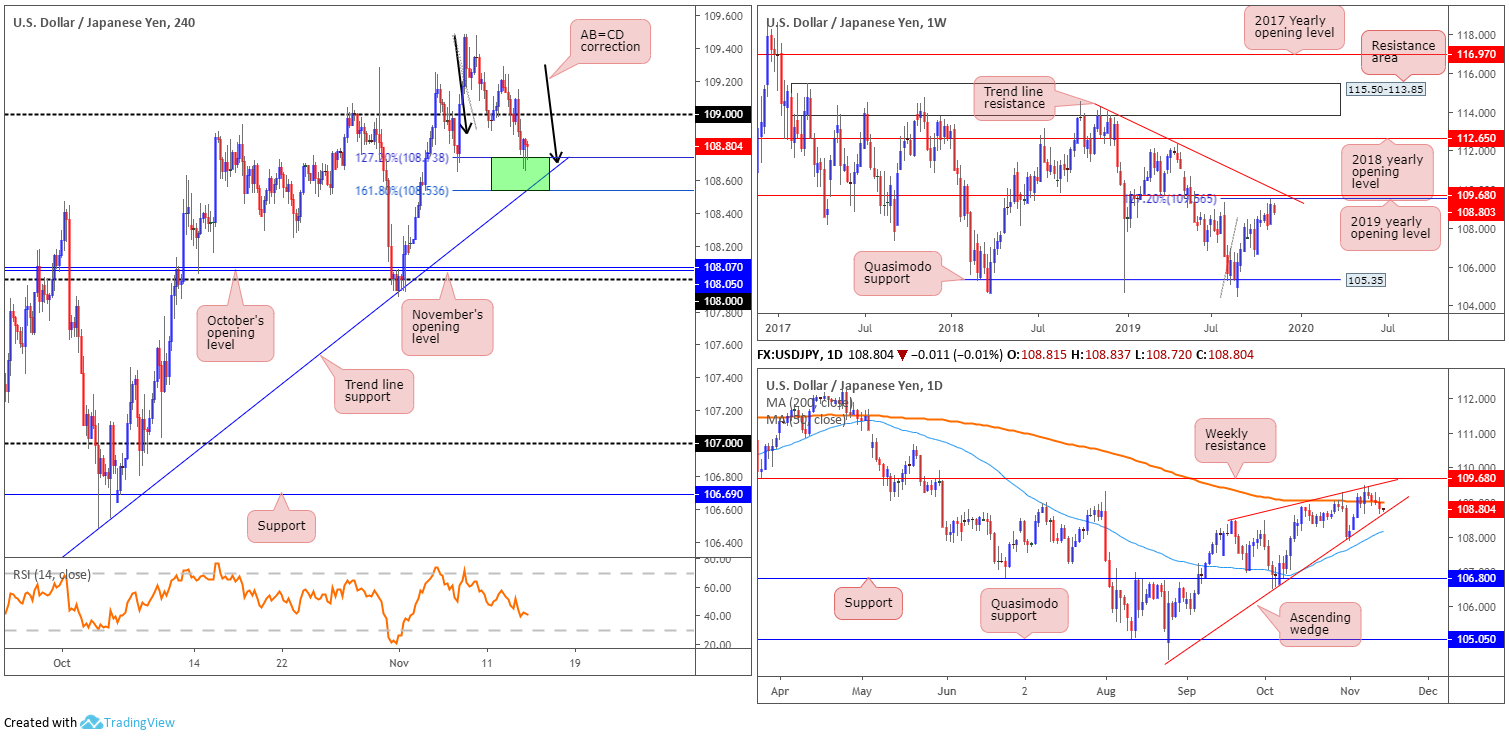
USD/JPY:
USD/JPY continued to navigate lower ground Wednesday, consequently erasing more than 18 points and recording its fourth successive decline. Now firmly positioned beneath the 200-day SMA (orange), price action on the daily timeframe eyes the lower edge of a nearby ascending wedge formation (104.44), which has been unfolding since early September.
H4 price action, thanks to yesterday’s decline, is toying with an AB=CD (black arrows) completion between the 161.8/127.2% Fibonacci extension points (green) at 108.53/108.73. Also sited close by is trend line resistance extended from the high 114.23. Activity on the weekly timeframe has resistance is plotted nearby at 109.68, as well as a 127.2% Fibonacci ext. at 109.56.
Areas of consideration:
A bounce from 108.53/108.73 to at least 109 is certainly a possibility today. The danger, of course, comes with knowing the unit is trading close to resistance on the higher timeframes.
In the event we reclaim 109 back to the upside, however, and cross swords with H4 Quasimodo resistance at 109.74 (not visible on the screen), selling this market is then an option. Knowing the Quasimodo resistance boasts additional backing from weekly structure is certainly appealing.
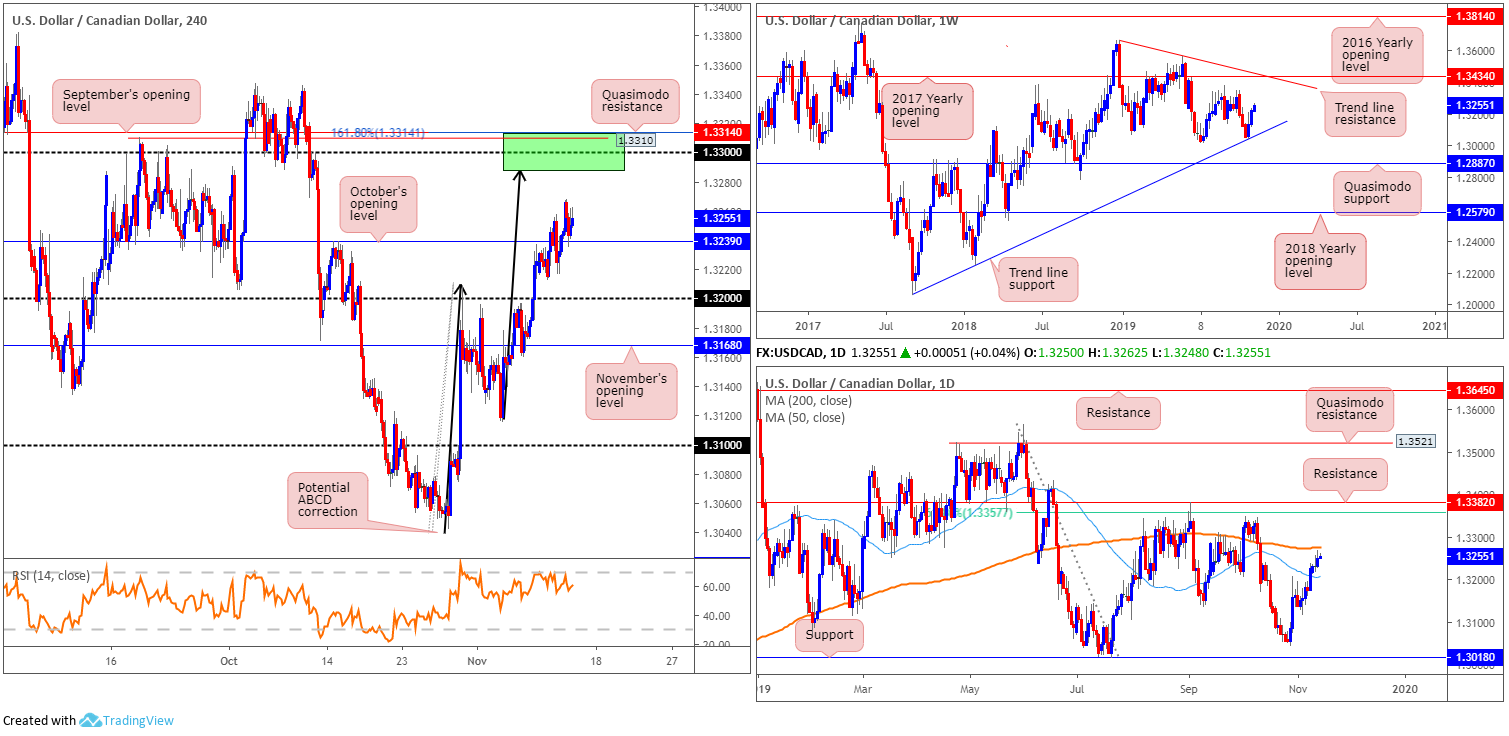
USD/CAD:
The USD/CAD extended gains Wednesday, reaching highs of 1.3268. Upside was somewhat limited, however, as the Canadian dollar gathered momentum on the back of recovering crude oil prices, which ended back above $57.00/bbl.
Interestingly, H4 action retested the top edge of October’s opening level at 1.3239 and, as of current price, appears to be holding firm. As underlined in recent reports, limited resistance is visible until reaching 1.33 from here. Supporting 1.33 as a resistance area, we have a potential ABCD correction (black arrows) terminating at 1.3287, a 161.8% Fibonacci ext. point at 1.3314, Quasimodo resistance at 1.3310 and September’s opening level at 1.3314 (green). In addition, the 200-day SMA (orange – 1.3275) is seen lurking just south of this zone.
Technical research on the weekly timeframe remains unchanged, exhibiting a bullish presence as buyers extend the recovery off trend line support (taken from the low 1.2061). Additional upside from this point has tops around 1.3342 in sight, closely followed by the 2017 yearly opening level at 1.3434 and trend line resistance taken from the peak at 1.3661. Overall, the immediate trend faces north since bottoming in September 2017, though this move could also be considered a deep pullback in a larger downtrend from the 1.4689 peak in early January 2016.
Areas of consideration:
With 1.3239 holding ground as support, an intraday long from here is possible, targeting 1.3314/1.3287 on the H4 timeframe.
Not only is 1.3314/1.3287 a possible target zone for longs, it also forms an area of resistance for potential shorts. With weekly buyers threatening a move higher, though, traders may wish to wait and see how H4 action behaves before committing funds to a position. This could be something as simple as waiting for a bearish candlestick pattern to emerge, or a lower-timeframe trend line break, for example.
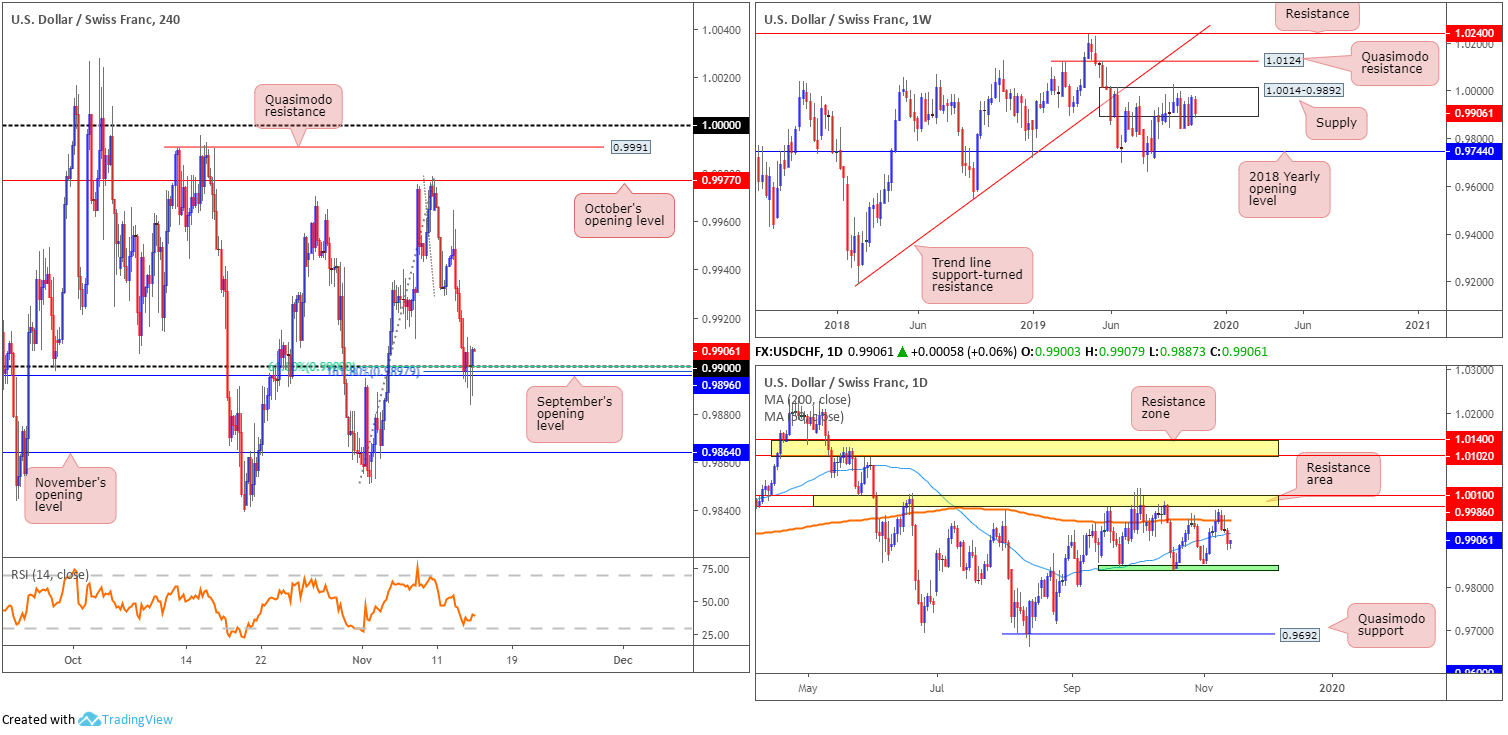
USD/CHF:
USD/CHF eased Wednesday for a third successive close, concluding the session down 0.30%, and testing the 0.99 handle applied to the H4 scale. Aligning closely with September’s opening level at 0.9896, a 61.8% Fibonacci retracement at 0.9900 and a 161.8% Fibonacci ext. point at 0.9897, the pair appears to be establishing some form of ‘floor’ off this barrier.
Although H4 action suggests a recovery play may be on the menu, daily price is establishing itself beneath both the 200/50-day SMAs (orange – 0.9952 and blue – 0.9923). Continued selling from this point could lead to a test of 0.9845ish (green).
Supply at 1.0014-0.9892 sited on the weekly timeframe remains in play. As mentioned in previous reports, the beginning of October witnessed a penetration to the outer edge of the supply area’s limit, possibly tripping a portion of buy stops and weakening sellers. An upside move out of the said supply may draw in Quasimodo resistance at 1.0124, while downside has the 2018 yearly opening level at 0.9744 in sight. According to the primary trend, price also reflects a slightly bullish tone; however, do remain aware we have been rangebound since the later part of 2015 (0.9444/1.0240).
Areas of consideration:
Although boasting limited support from the higher timeframes, the 0.99 handle, along with its supporting confluence on the H4 timeframe (see above), is clearly of interest for buyers today. Wednesday’s analysis stated that if a H4 bullish candlestick configuration formed from 0.99, entry/risk levels can be determined according to the H4 bull candle pattern. The recently closed H4 candle emphasises a strong bullish tone, closing not too far off its high point at 0.9908. This, therefore, is likely viewed as a valid buy signal, targeting the underside of the 50-day SMA on the daily scale at 0.9923 as the initial upside hurdle.
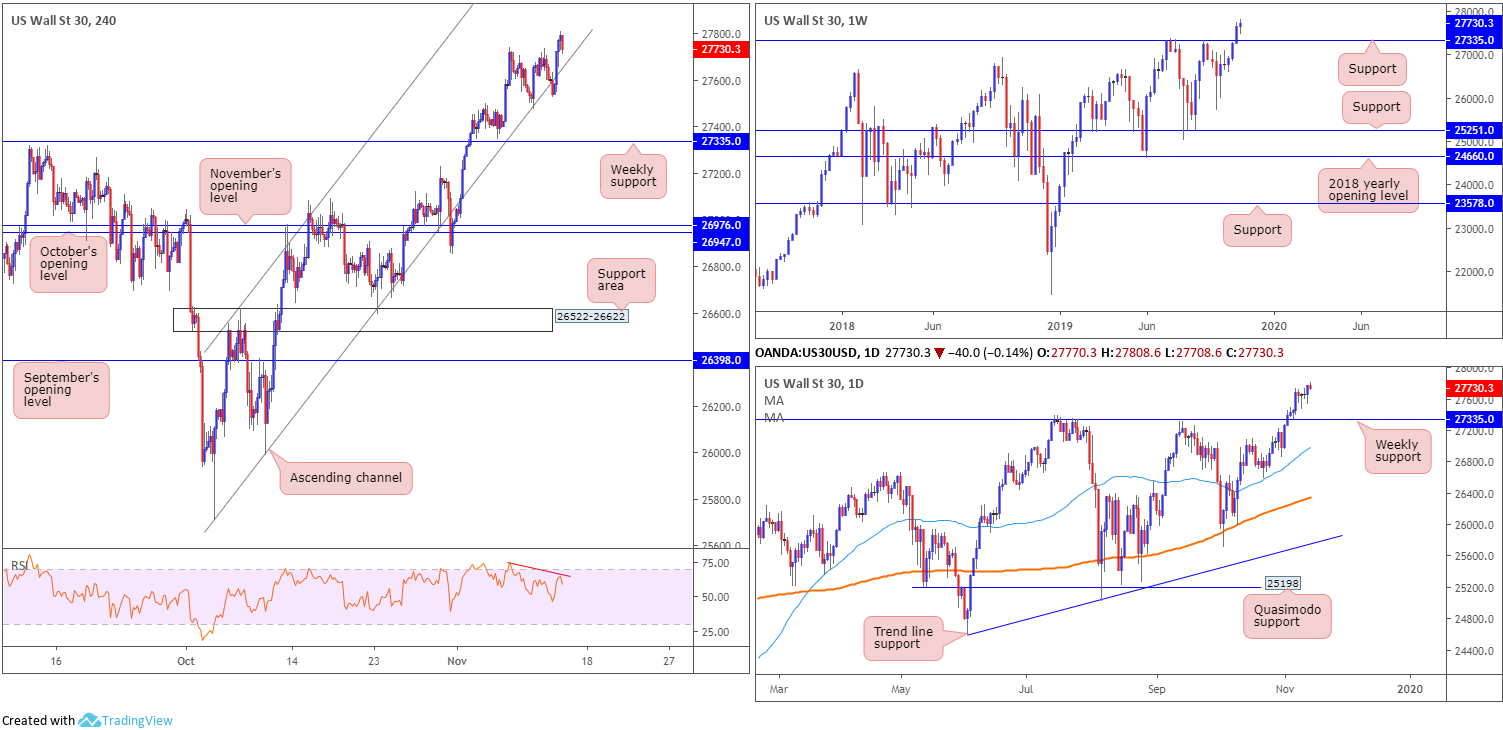
Dow Jones Industrial Average:
US equities finished mostly higher Wednesday; both the Dow Jones Industrial Average and S&P 500 index closed at fresh records. The Dow Jones added 92.10 points, or 0.33%; the S&P 500 advanced 2.20 points, or 0.07% and the tech-heavy Nasdaq 100 declined 3.98 points, or 0.05%.
The Dow’s technical picture reveals the H4 candles respected channel support extended from the low of 25710, despite a brief spell at lows around 27770. As of current price on this scale, price is turning lower from all-time highs at 27808 and is poised to revisit the said channel support. Indicator-based traders may also wish to note the relative strength index (RSI) is producing bearish divergence (red line).
Should the noted H4 channel support eventually give way, this unlocks the pathway south for a retest of weekly support plotted at 27335. This is assuming the support points on the H4 scale at 27526 and 27474 also give way.
Areas of consideration:
Another retest of the H4 channel support today, preferably in the shape of a H4 bullish candlestick pattern, will be of interest to buyers, given the recent all-time high.
A decisive H4 close beneath the current H4 channel support, nonetheless, may offer sellers a chance to short back to weekly support at 27335. However, do remain cognisant the primary trend has been in motion for several years.
In the event we do cross paths with weekly support, waiting for either a H4 or daily bullish candlestick signal to develop is recommended before pulling the buy lever, as this could be a pivotal location to join the current trend (entry and risk can be set according to the selected candlestick pattern).
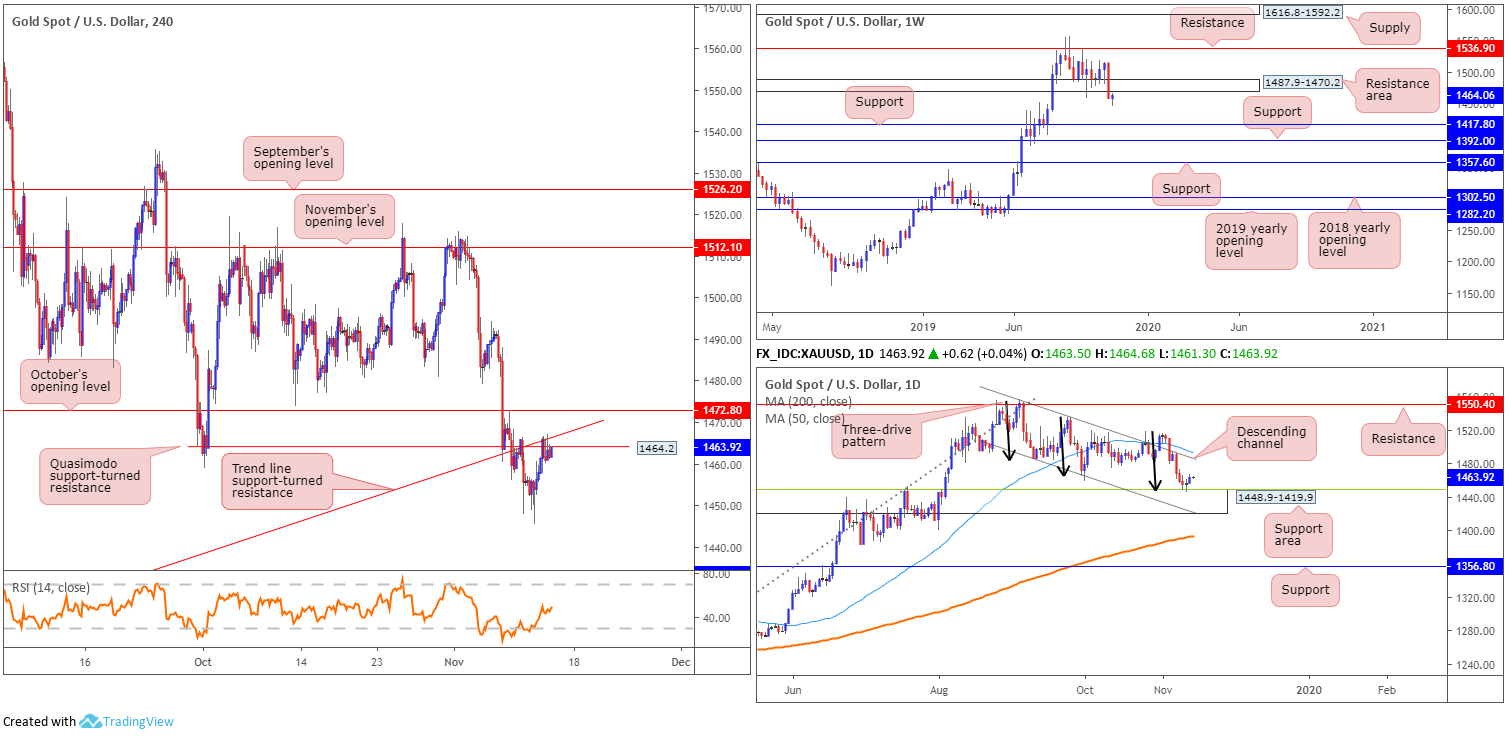
XAU/USD (GOLD):
The price of gold, in dollar terms, climbed Wednesday, adding more than $7, or 0.48%. This, according to technical research on the daily timeframe, was expected. In recent sessions, daily price crossed swords with the top edge of a support area coming in at 1448.9-1419.9 (aligns closely with a 38.2% Fibonacci retracement ratio at 1448.5). What’s also interesting here is the completion of a three-drive pattern around the top edge of the said support zone (black arrows).
Higher up on the curve, nevertheless, price action remains languishing south of a significant resistance area at 1487.9-1470.2, suggesting a continuation to supports coming in at 1392.0 and 1417.8 could be in store. A retest at the underside of this area, however, is also a likely theme.
Across the page on the H4 timeframe, as expected, the candles retested Quasimodo support-turned resistance at 1464.2 (closely trailed by a trend line support-turned resistance etched from the low 1381.9) yesterday and held form. Note directly above here, October’s opening level resides at 1472.8, and the relative strength index (RSI) is seen nearing its mid-point 50.0 value.
Areas of consideration:
With the underside of the weekly resistance area at 1470.2 closing in fast, the recovery off the daily support area mentioned above at 1448.9-1419.9 may exhibit difficulty. October’s opening level on the H4 timeframe at 1472.8 is likely of interest today for possible bearish scenarios, given its alignment with the underside of the weekly resistance zone. The theory behind this setup is weekly price typically overrides lower-timeframe structure.
Conservative sellers off 1472.8 threatened by the said daily support area may opt to wait and see if a H4 bearish candlestick setting forms before getting involved. Although not guaranteeing a winning trade, it does help identify seller intent and provides entry/risk levels to work with.
The accuracy, completeness and timeliness of the information contained on this site cannot be guaranteed. IC Markets does not warranty, guarantee or make any representations, or assume any liability regarding financial results based on the use of the information in the site.
News, views, opinions, recommendations and other information obtained from sources outside of www.icmarkets.com.au, used in this site are believed to be reliable, but we cannot guarantee their accuracy or completeness. All such information is subject to change at any time without notice. IC Markets assumes no responsibility for the content of any linked site.
The fact that such links may exist does not indicate approval or endorsement of any material contained on any linked site. IC Markets is not liable for any harm caused by the transmission, through accessing the services or information on this site, of a computer virus, or other computer code or programming device that might be used to access, delete, damage, disable, disrupt or otherwise impede in any manner, the operation of the site or of any user’s software, hardware, data or property.


