
DXY:
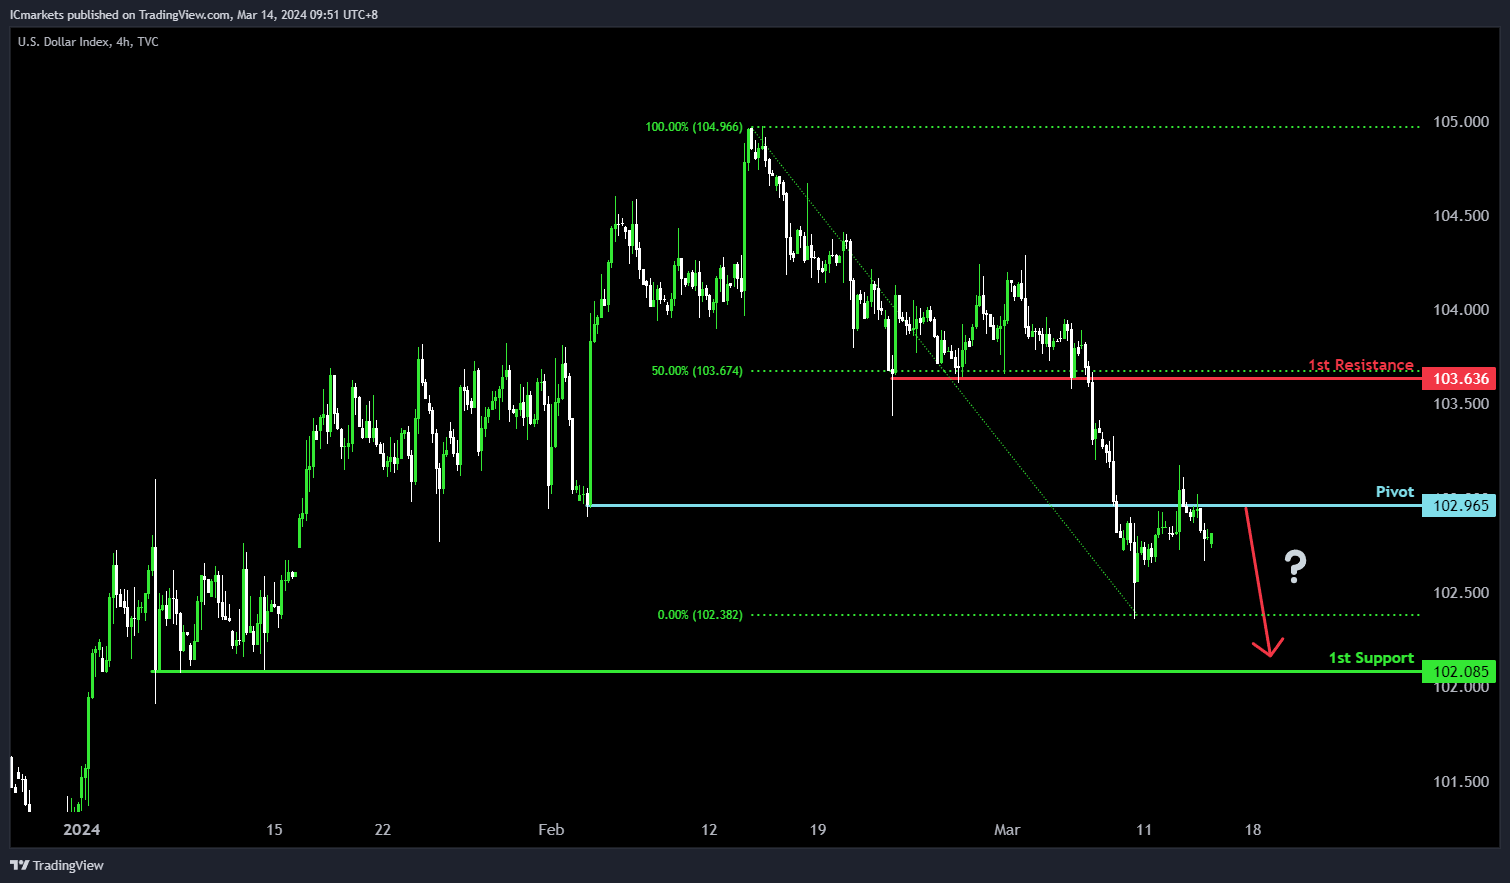
For DXY, the potential direction is bearish, aligning with the overall momentum of the chart. There’s a likelihood of a bearish continuation towards the 1st support level. The pivot at 103.44 acts as a significant overlap resistance, indicating a potential barrier where selling pressure may intensify.
On the support side, the 1st support at 102.08 is identified as a multi-swing low support, suggesting its significance as a level where buying interest has historically emerged. Conversely, the 1st resistance at 103.63 serves as a pullback resistance, potentially limiting further upward movement in the price, particularly reinforced by the 50% Fibonacci Retracement level.
EUR/USD:
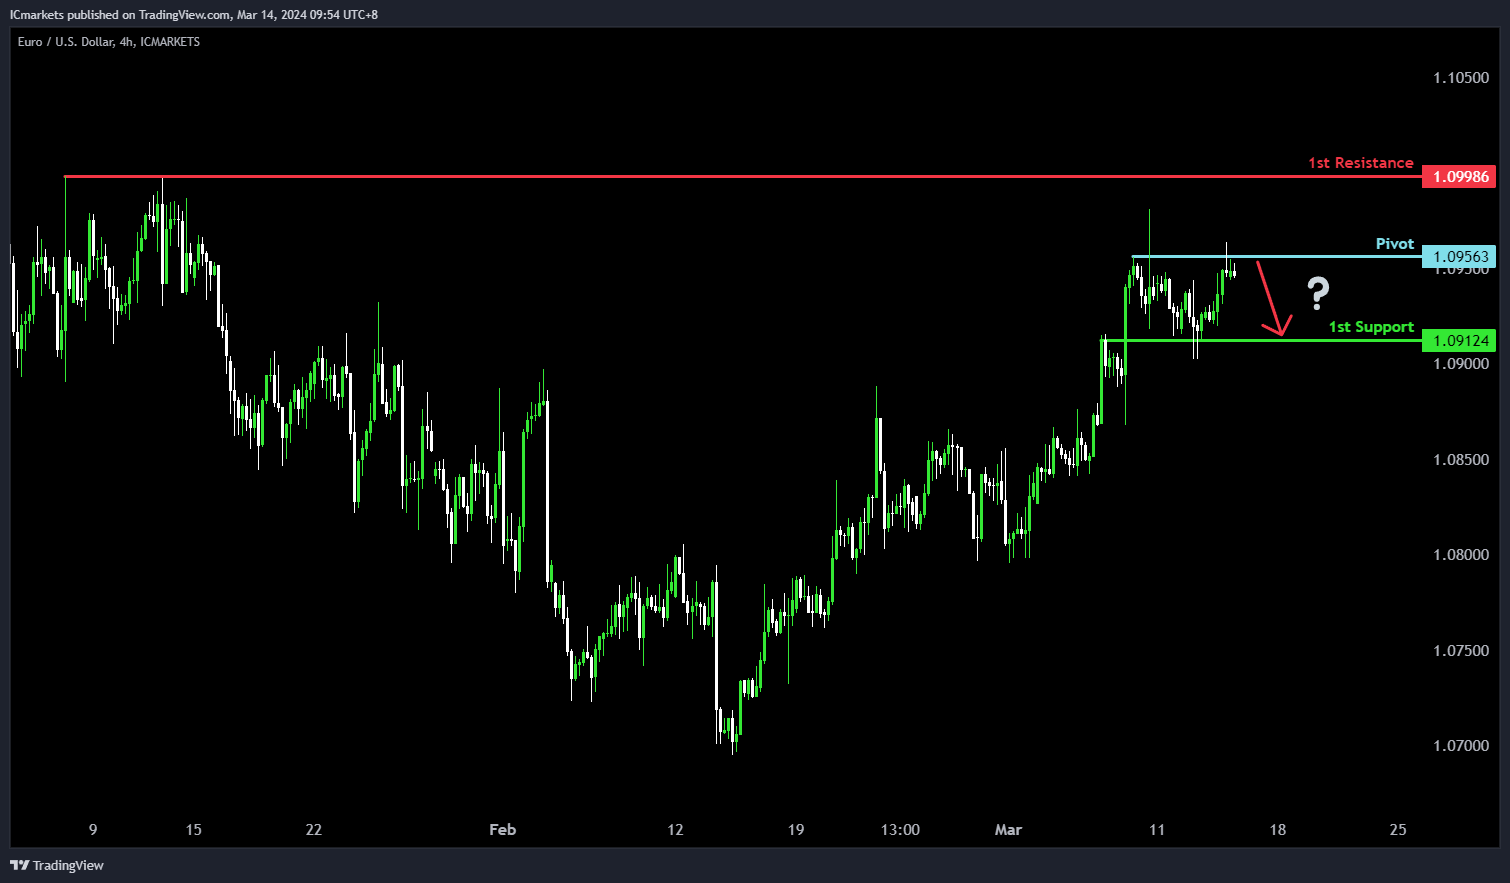
For EUR/USD, the potential direction is bearish, despite the overall bullish momentum of the chart. There’s a possibility of a bearish reaction off the pivot level, leading to a drop towards the 1st support.
The pivot at 1.0956 is significant as multi-swing high resistance, suggesting a potential barrier where selling pressure might increase. The 1st support at 1.0912, on the other hand, is identified as an overlap support, indicating its historical significance as a level where buying interest has emerged.
Conversely, the 1st resistance at 1.0998 serves as swing high resistance, potentially limiting further upward movement in the price
EUR/JPY:
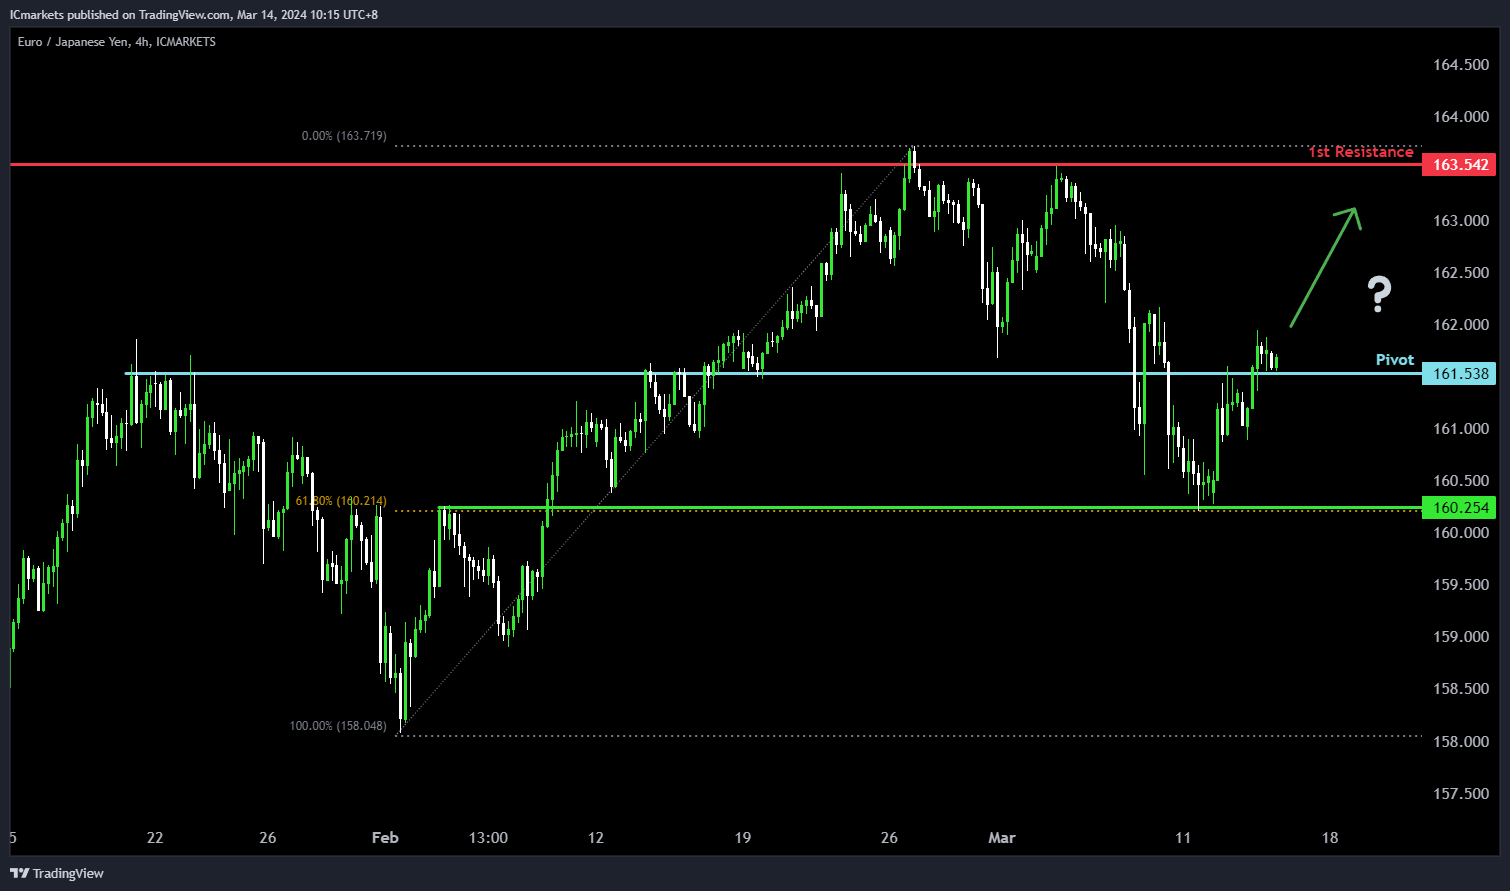
The EUR/JPY chart suggests a potential bullish direction despite the prevailing bearish momentum. Several factors contribute to this analysis.
The pivot level at 161.538 is notable as it coincides with pullback support, indicating a significant historical level where buying interest may emerge.
Additionally, the 1st support level at 160.254 aligns with an overlap support and the 61.80% Fibonacci Retracement level, further reinforcing its significance as a potential area of support.
On the resistance side, the 1st resistance level at 163.542 is identified as a swing high resistance, representing a historical barrier to upward movement.
EUR/GBP:
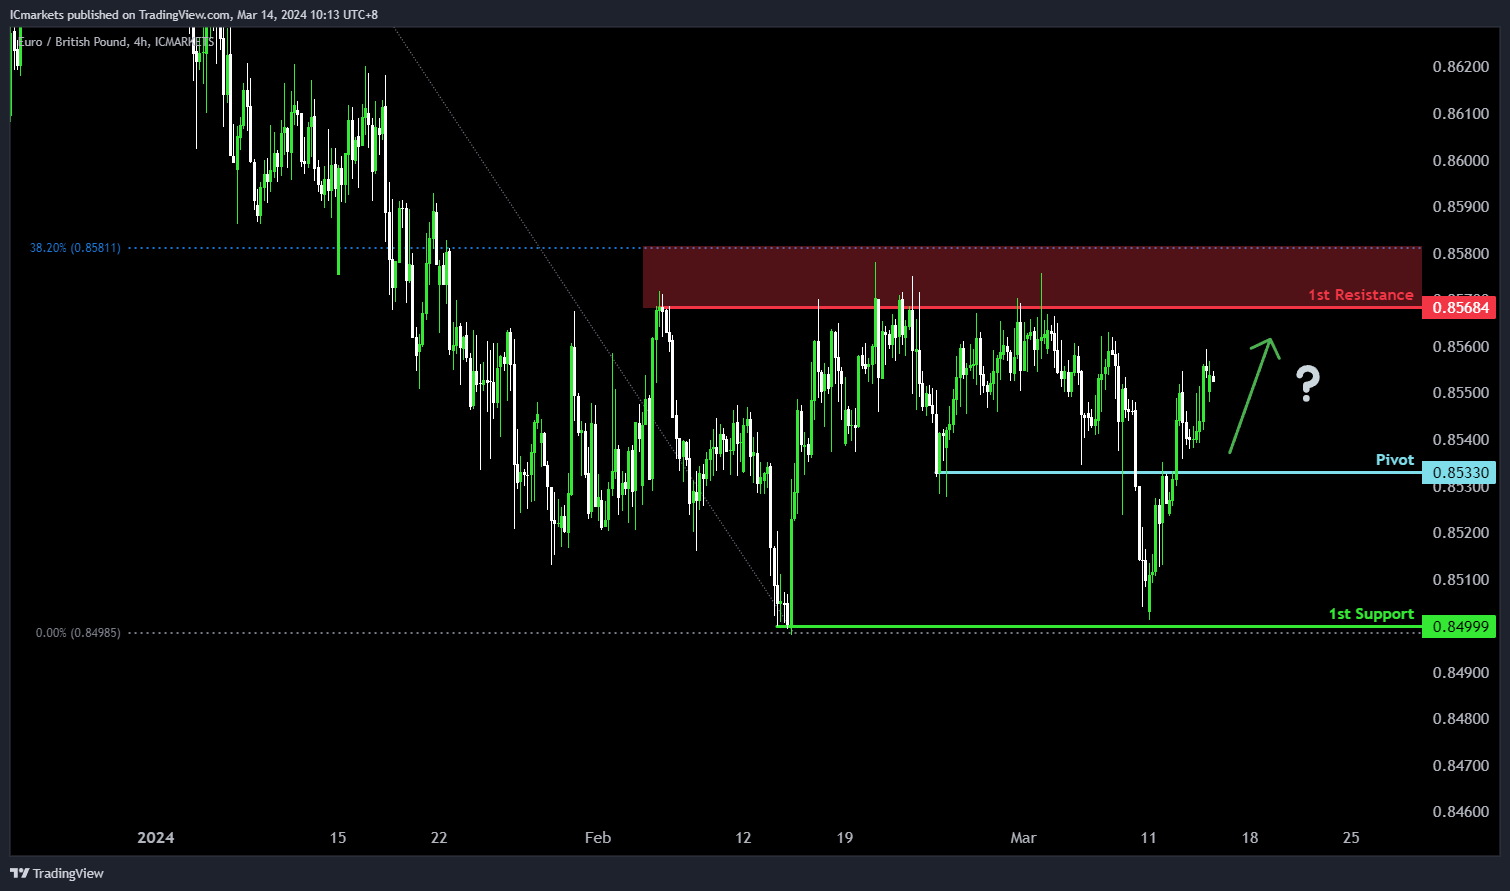
The EUR/GBP chart suggests a potential bullish direction despite the prevailing bearish momentum. Several factors contribute to this analysis.
The pivot level at 0.85330 is significant as it serves as pullback support, indicating a historical level where buying interest may emerge.
Furthermore, the 1st support level at 0.84999 aligns with a swing low support, further reinforcing its significance as a potential area where buyers might enter the market.
On the resistance side, the 1st resistance level at 0.85684 is identified as a swing high resistance and coincides with the 38.20% Fibonacci Retracement level, suggesting a historical barrier to upward movement.
GBP/USD:
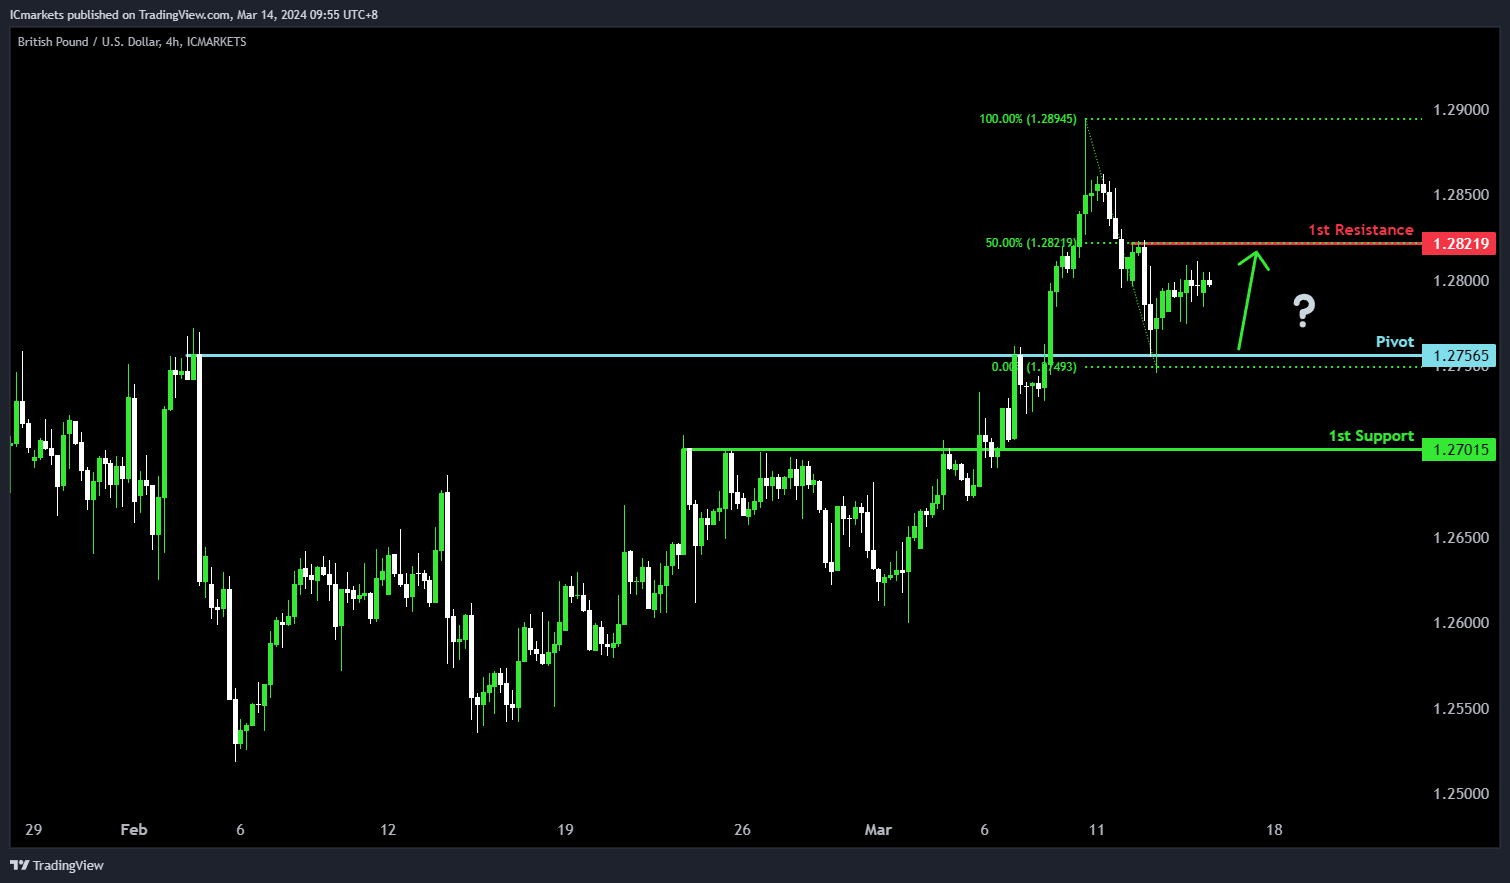
For GBP/USD, the potential direction is bullish, aligning with the overall bullish momentum of the chart. There’s a likelihood of a bullish bounce off the pivot level, signaling a move towards the 1st resistance.
The pivot at 1.2756 acts as an overlap support, suggesting its significance as a level where buyers may intervene to support the price. Additionally, the 1st support at 1.2701 reinforces this pattern as another overlap support, further indicating its historical importance.
On the resistance side, the 1st resistance at 1.2821 is identified as swing high resistance, potentially impeding further upward movement. The presence of the 50% Fibonacci Retracement adds to its significance as a potential barrier where selling pressure could increase.
.
GBP/JPY:
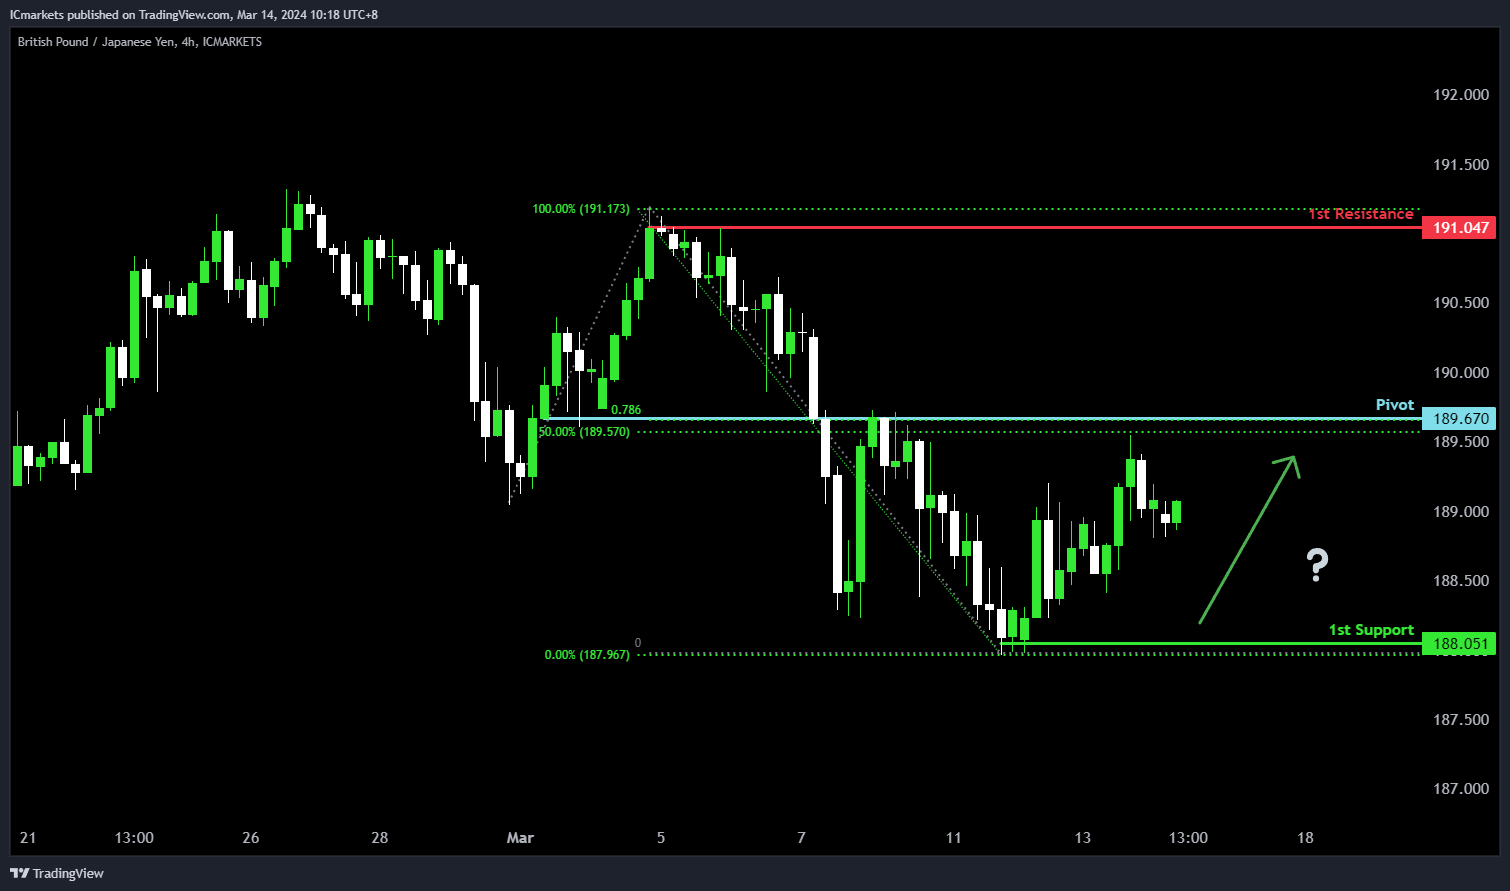
The GBP/JPY chart suggests a potential bullish direction despite the prevailing bearish momentum. Several factors contribute to this analysis.
The pivot level at 189.670 is significant as it coincides with pullback resistance, the 50% Fibonacci Retracement level, and the 78.60% Fibonacci Projection. This convergence of indicators highlights a crucial area where price might find resistance but could also serve as a potential turning point for a bullish reversal.
Additionally, the 1st support level at 188.051 corresponds to a swing low support, indicating historical buying interest in this region.
On the resistance side, the 1st resistance level at 191.047 is identified as a swing high resistance, representing a historical barrier to upward movement.
USD/CHF:
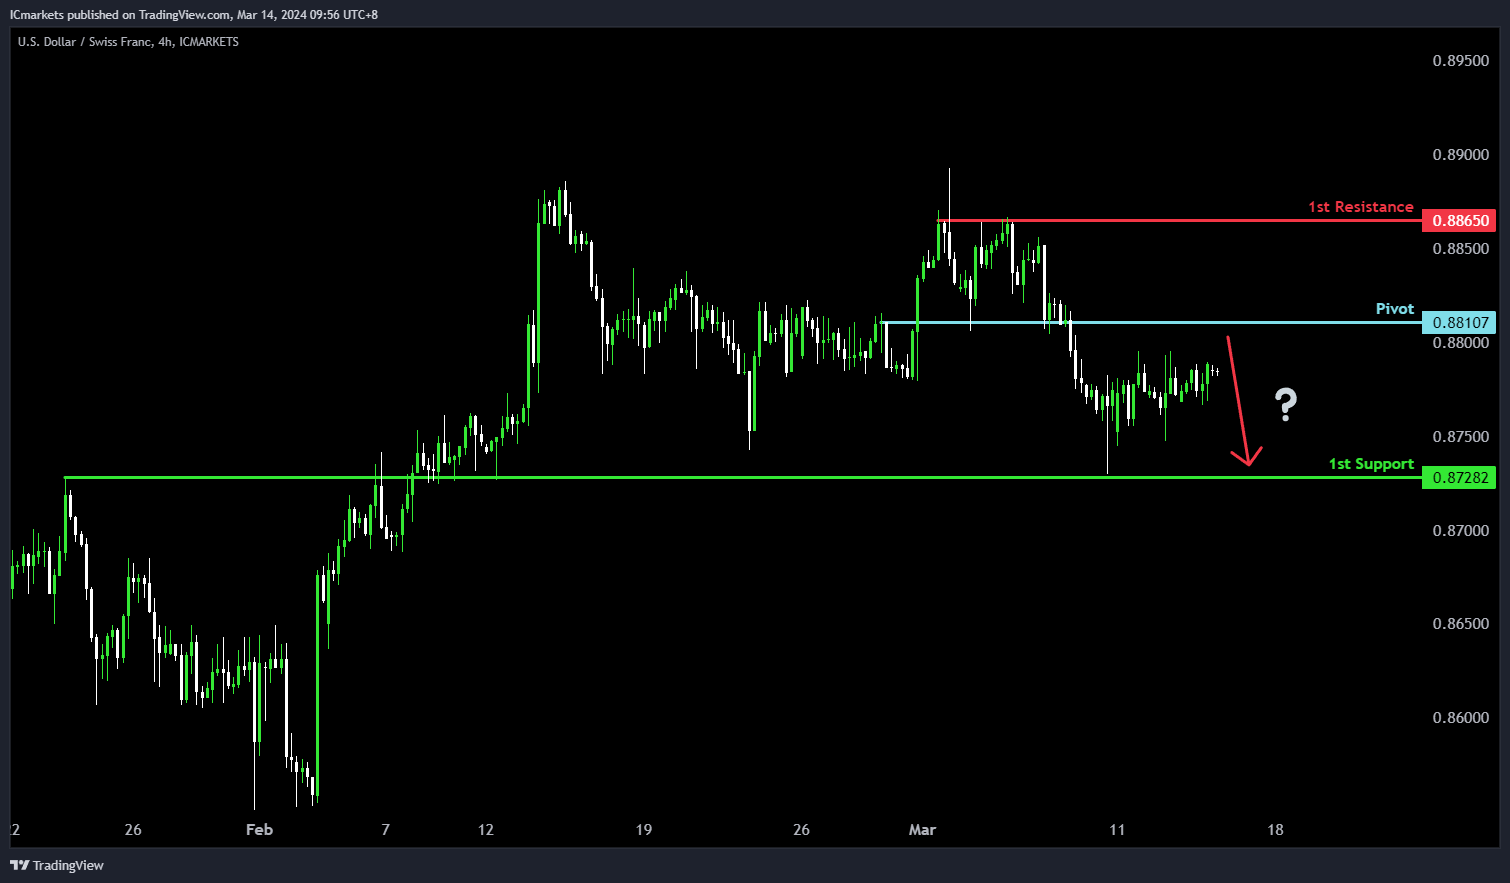
For USD/CHF, the potential direction is bearish, aligning with the overall bearish momentum of the chart. There’s a possibility of a bearish reaction off the pivot level, leading to a drop towards the 1st support.
The pivot at 0.8810 serves as a point of pullback resistance, indicating its significance as a level where selling pressure may increase. In contrast, the 1st support at 0.8728 acts as an overlap support, suggesting historical buying interest in that area.
On the resistance side, the 1st resistance at 0.8865 is identified as multi-swing high resistance, potentially hindering further upward movement.
USD/JPY:
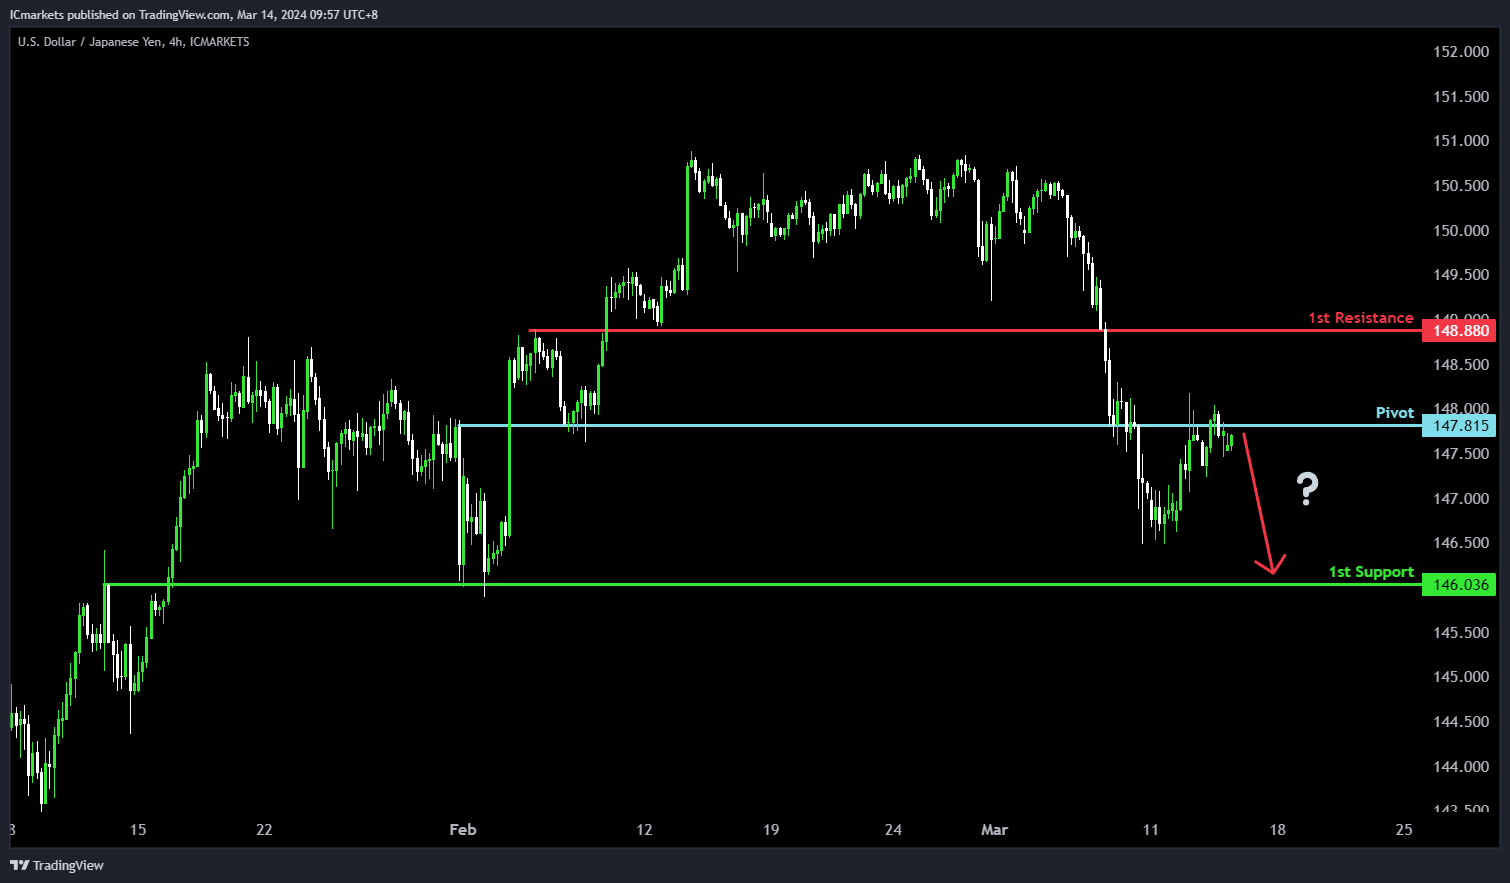
For USD/JPY, the potential direction is bearish, reflecting the overall bearish momentum of the chart. There’s a likelihood of a bearish reaction off the pivot level, leading to a decline towards the 1st support.
The pivot at 147.81 acts as an overlap resistance, indicating its historical significance as a level where selling pressure may intensify. Conversely, the 1st support at 146.03 serves as an overlap support, suggesting a historical area where buying interest has emerged.
On the resistance side, the 1st resistance at 148.88 is identified as a pullback resistance, potentially limiting further upward movement
USD/CAD:
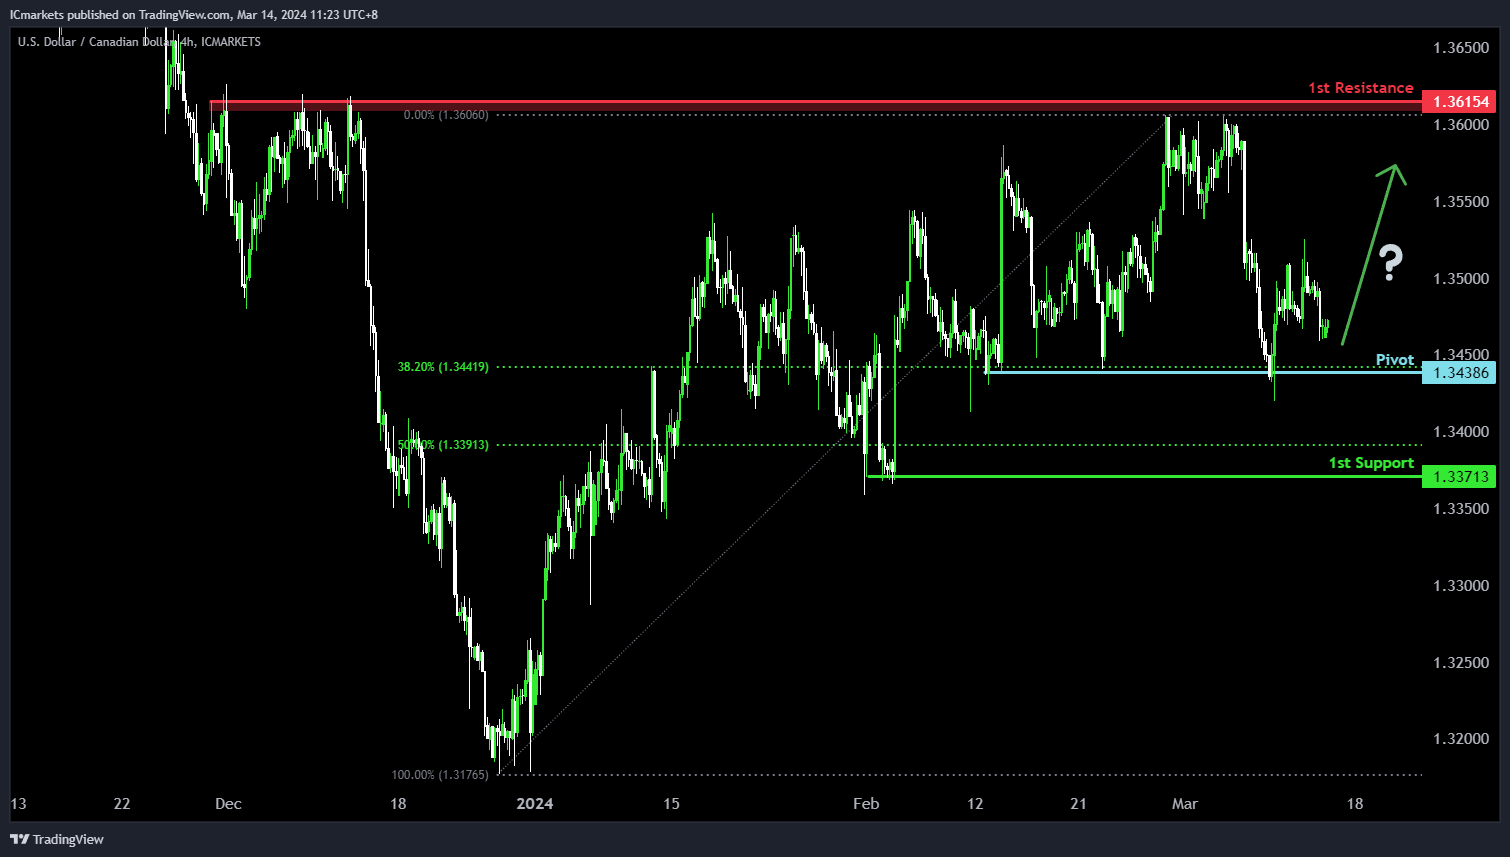
The USD/CAD chart currently demonstrates a neutral bias. In this context, there is a potential scenario for price to fluctuate between the pivot and the 1st resistance.
The pivot level at 1.3438 is identified as a pullback support that aligns with the 38.20% Fibonacci Retracement level where price could potentially bounce off to climb higher. Higher up, the 1st resistance level at 1.3615 is noted as a pullback resistance, further highlighting its importance as a potential resistance zone.
To the downside, the 1st support level at 1.3371 is marked as a pullback support that aligns close to the 50.00% Fibonacci Retracement level, reinforcing its significance as a key support level.
AUD/USD:
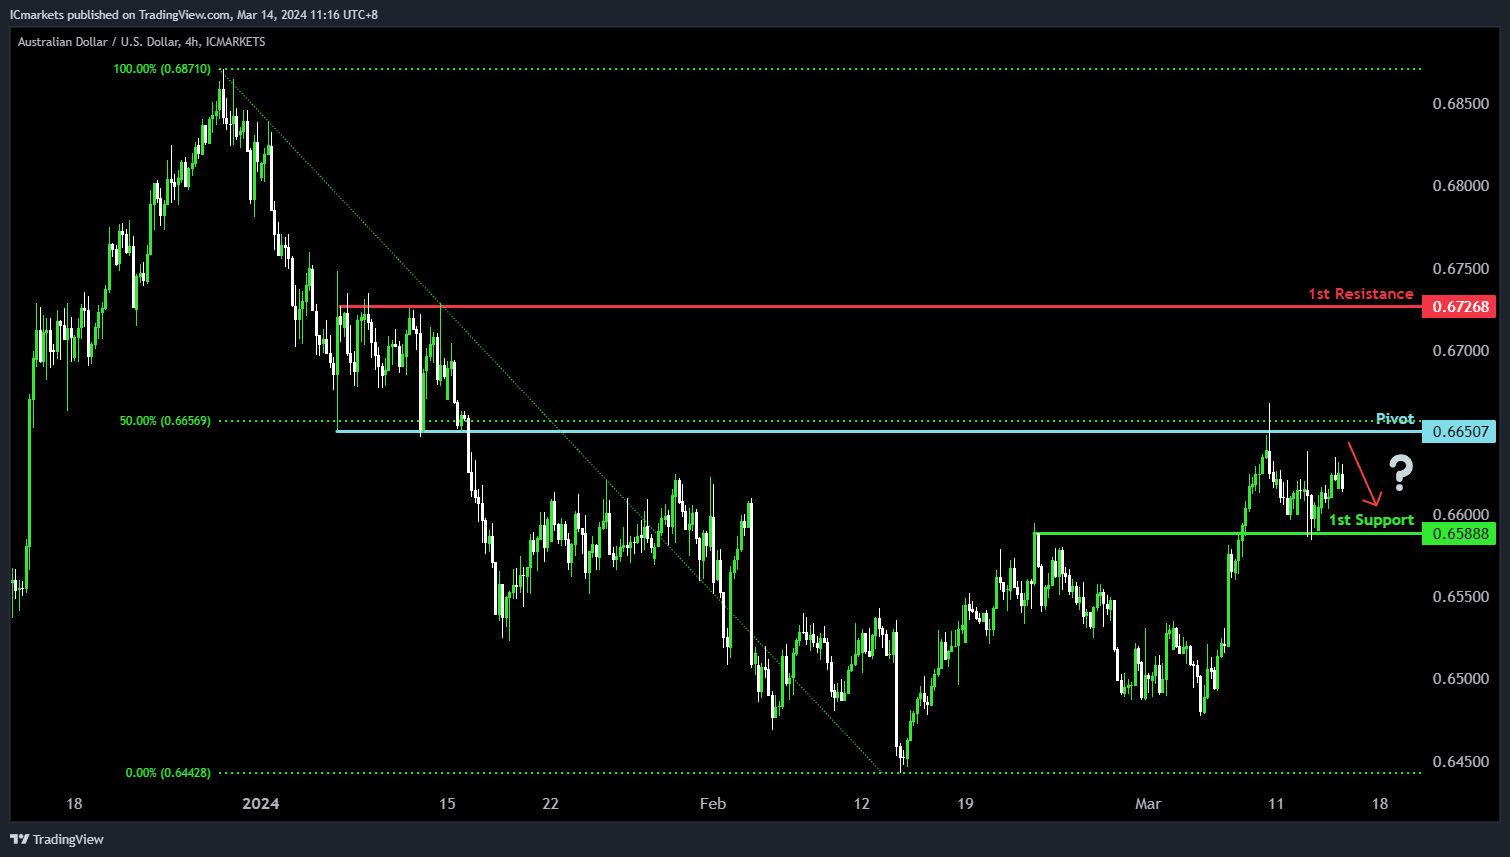
The AUD/USD chart currently demonstrates a neutral bias. In this context, there is a potential scenario for price to fluctuate between the pivot and the 1st support.
The pivot level at 0.6650 is identified as an overlap resistance that aligns with the 50.00% Fibonacci Retracement level where price could potentially reverse from to drop lower. The 1st support level at 0.6588 is marked as an overlap support, reinforcing its significance as a key support level.
On the resistance side, the 1st resistance level at 0.6726 is noted as a pullback resistance, potentially limiting any further upward movement.
NZD/USD
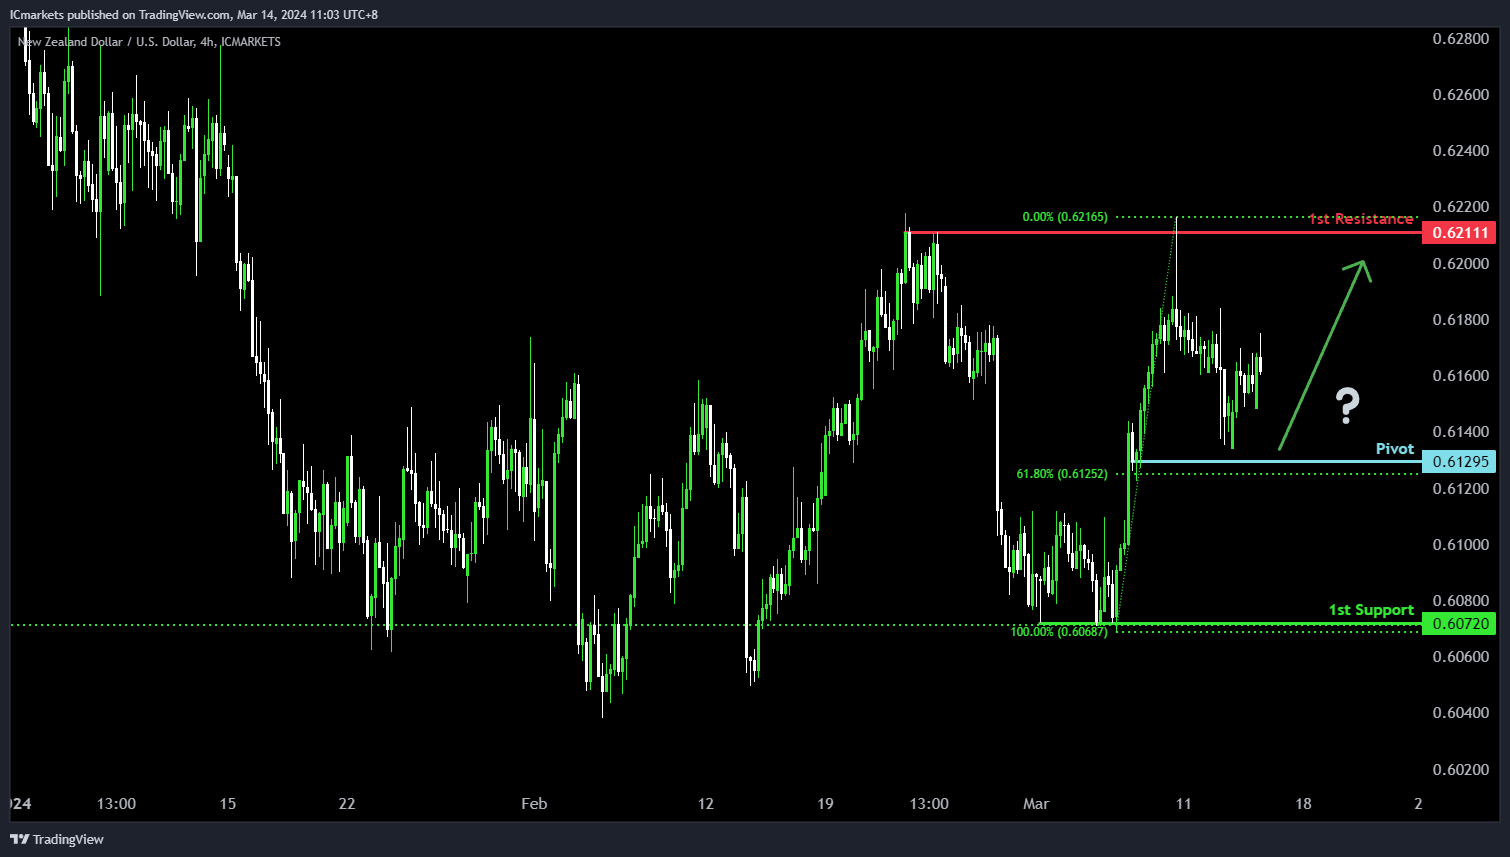
The NZD/USD chart currently demonstrates a neutral bias. In this context, there is a potential scenario for price to fluctuate between the pivot and the 1st resistance.
The pivot level at 0.6129 is identified as a pullback support that aligns close to the 61.80% Fibonacci Retracement level where price could potentially reverse from to climb higher. The 1st resistance level at 0.6211 is identified as a multi-swing-high resistance, potentially limiting any further upward movement.
On the support side, the 1st support level at 0.6072 is marked as a pullback support, reinforcing its significance as a key support level.
DJ30:
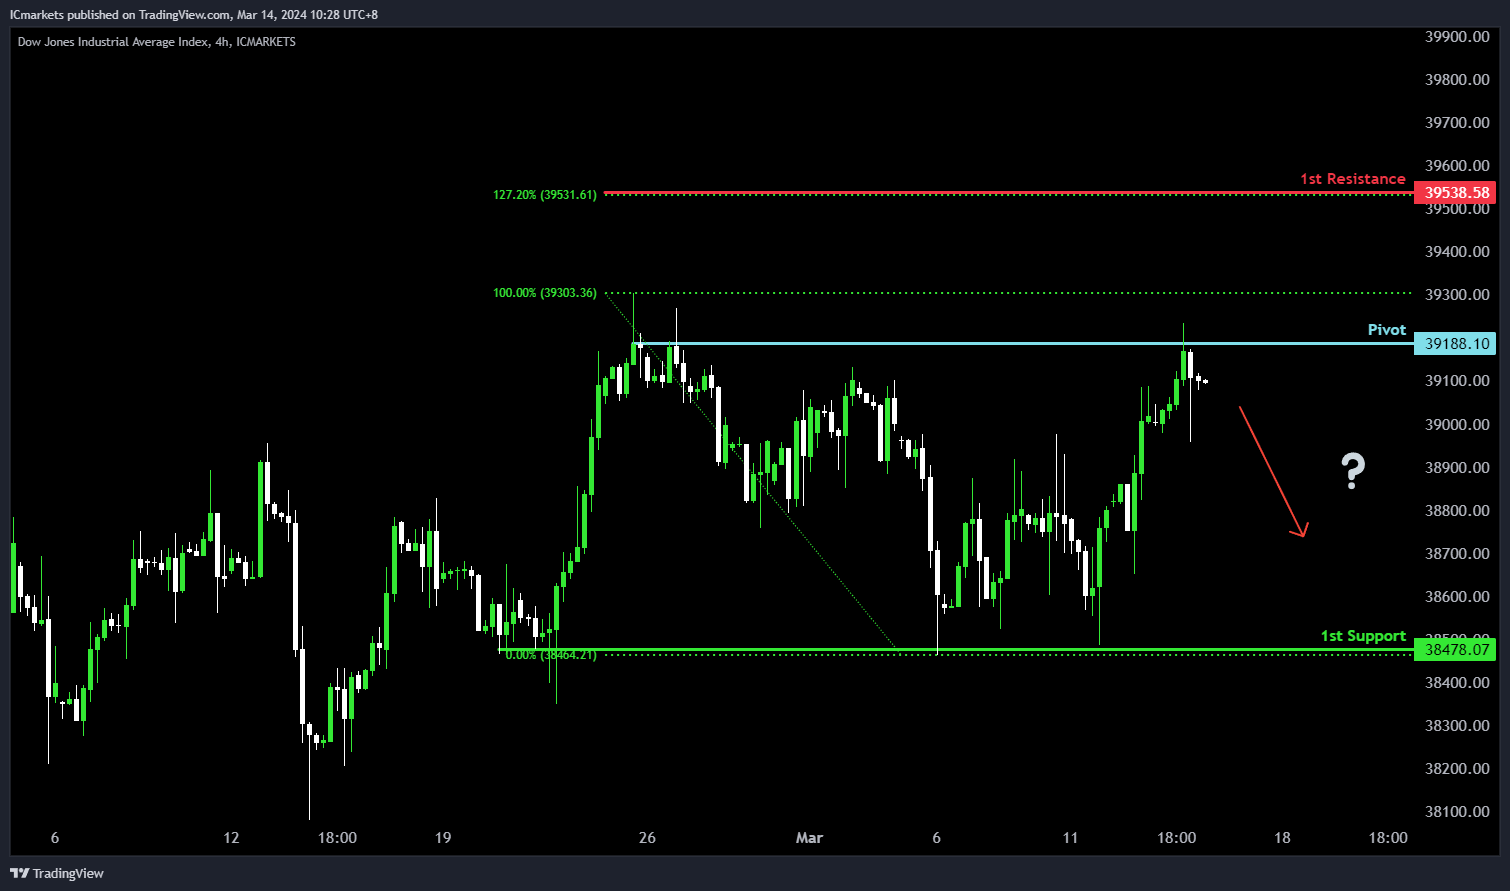
The DJ30 chart currently indicates a potential bearish direction, despite the prevailing bullish momentum. Several factors contribute to this analysis.
The pivot level at 39178.61 is significant as it serves as a swing high resistance, suggesting a historical level where selling pressure may emerge.
Furthermore, the 1st support level at 38478.07 aligns with a swing low support, reinforcing its significance as a potential area where buyers might step in.
On the resistance side, the 1st resistance level at 39538.58 is identified as a significant level, marked by the 127.20% Fibonacci Extension, indicating a potential barrier to further bullish movement.
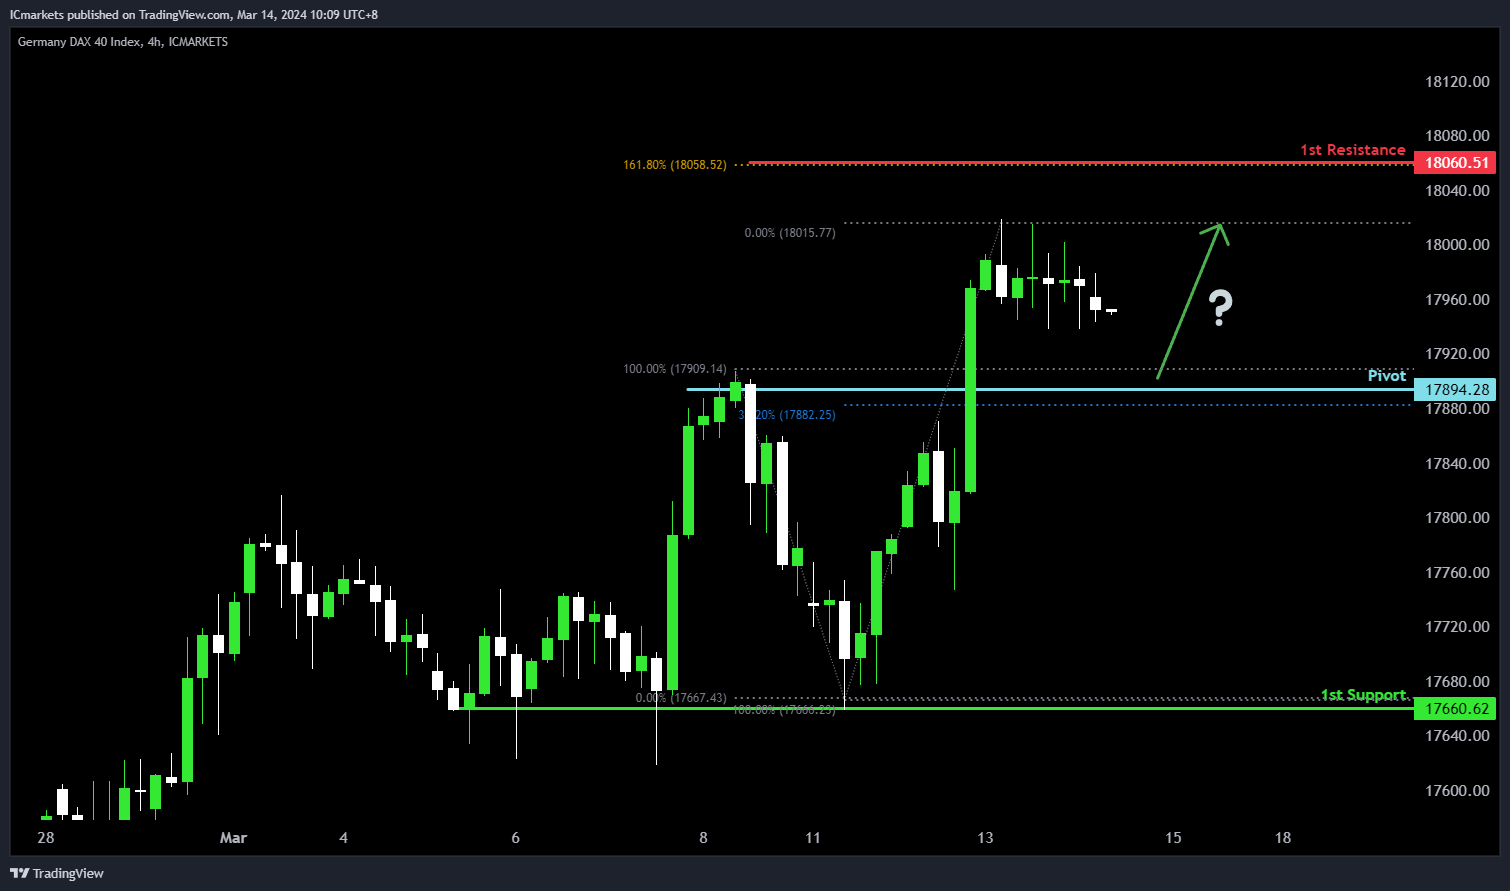
GER40:
The GER40 chart indicates a potential bullish direction, aligning with the overall bullish momentum. Several factors contribute to this analysis.
The pivot level at 17894.28 serves as a pullback support and coincides with the 38.20% Fibonacci Retracement, indicating a significant historical level where buying interest may emerge.
Furthermore, the 1st support level at 17660.62 aligns with a swing low support, reinforcing its significance as a potential area where buyers might enter the market.
On the resistance side, the 1st resistance level at 18060.51 is identified as significant, marked by the 161.80% Fibonacci Extension, suggesting a potential barrier to further bullish movement.
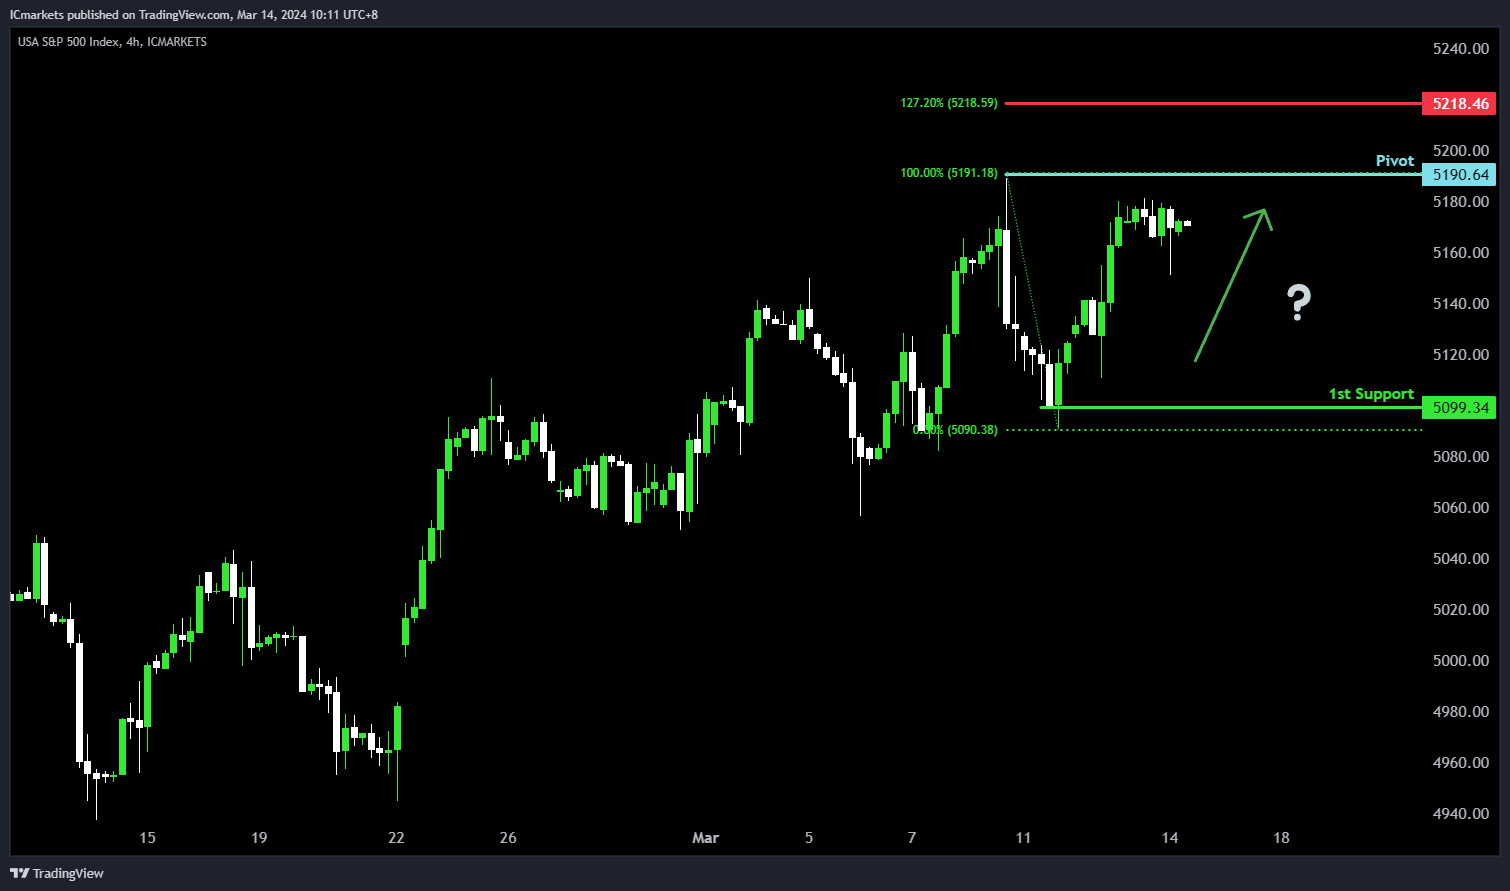
US500:
The US500 chart indicates a potential bullish direction, consistent with the overall bullish momentum. Several factors contribute to this analysis.
The pivot level at 5190.64 is significant as it represents a swing high resistance, suggesting a historical barrier to upward movement.
Additionally, the 1st support level at 5099.34 corresponds to a swing low support, indicating a significant historical level where buying interest has previously emerged.
On the resistance side, the 1st resistance level at 5218.46 is marked by the 127.20% Fibonacci Extension, further reinforcing its significance as a potential barrier to further bullish movement.
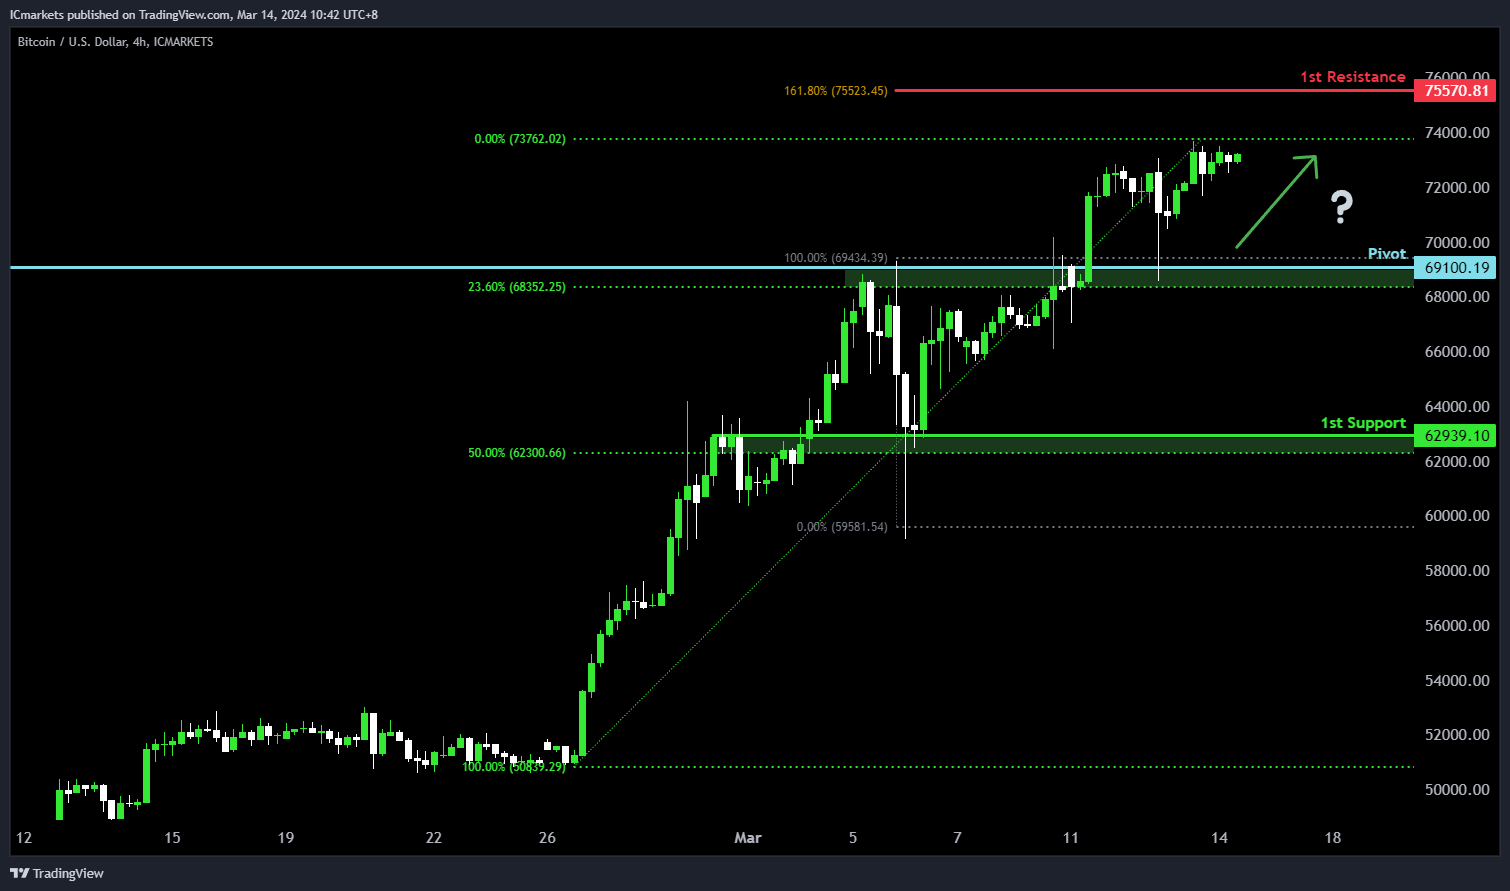
BTC/USD:
The BTC/USD chart indicates a potential bullish direction, in line with the overall bullish momentum. Several factors contribute to this analysis.
The pivot level at 69100.19 serves as a pullback support and coincides with the 23.60% Fibonacci Retracement, highlighting its significance as a potential area where buying interest might emerge.
Furthermore, the 1st support at 62939.10 aligns with a swing low support and corresponds to the 50% Fibonacci Retracement level, further reinforcing its importance as a potential area where buyers could enter the market.
On the resistance side, the 1st resistance level at 75570.81 is identified by the 161.80% Fibonacci Extension, indicating a significant barrier to further bullish movement.
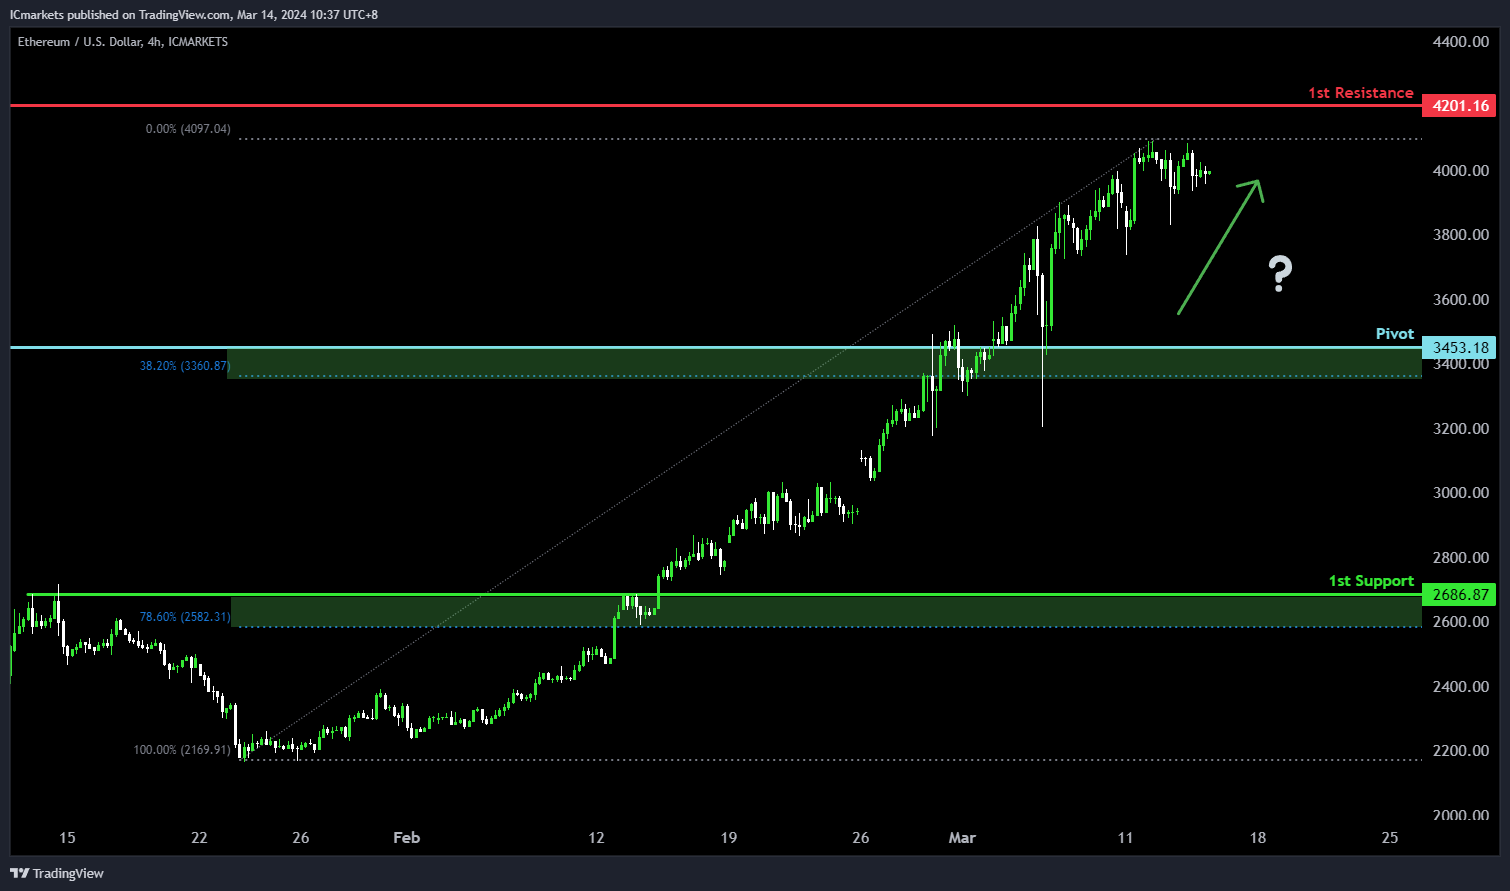
ETH/USD:
The ETH/USD chart suggests a bullish potential direction, reflecting the overall bullish momentum. Several factors contribute to this analysis.
The pivot level at 3453.18 serves as a pullback support and coincides with the 38.20% Fibonacci Retracement, indicating a significant historical level where buying interest may emerge.
Furthermore, the 1st support at 2686.87 aligns with a swing low support and corresponds to the 78.60% Fibonacci Retracement level, further reinforcing its significance as a potential area where buyers might enter the market.
On the resistance side, the 1st resistance level at 4201.16 is identified as an overlap resistance, suggesting a historical barrier to further upward movement.
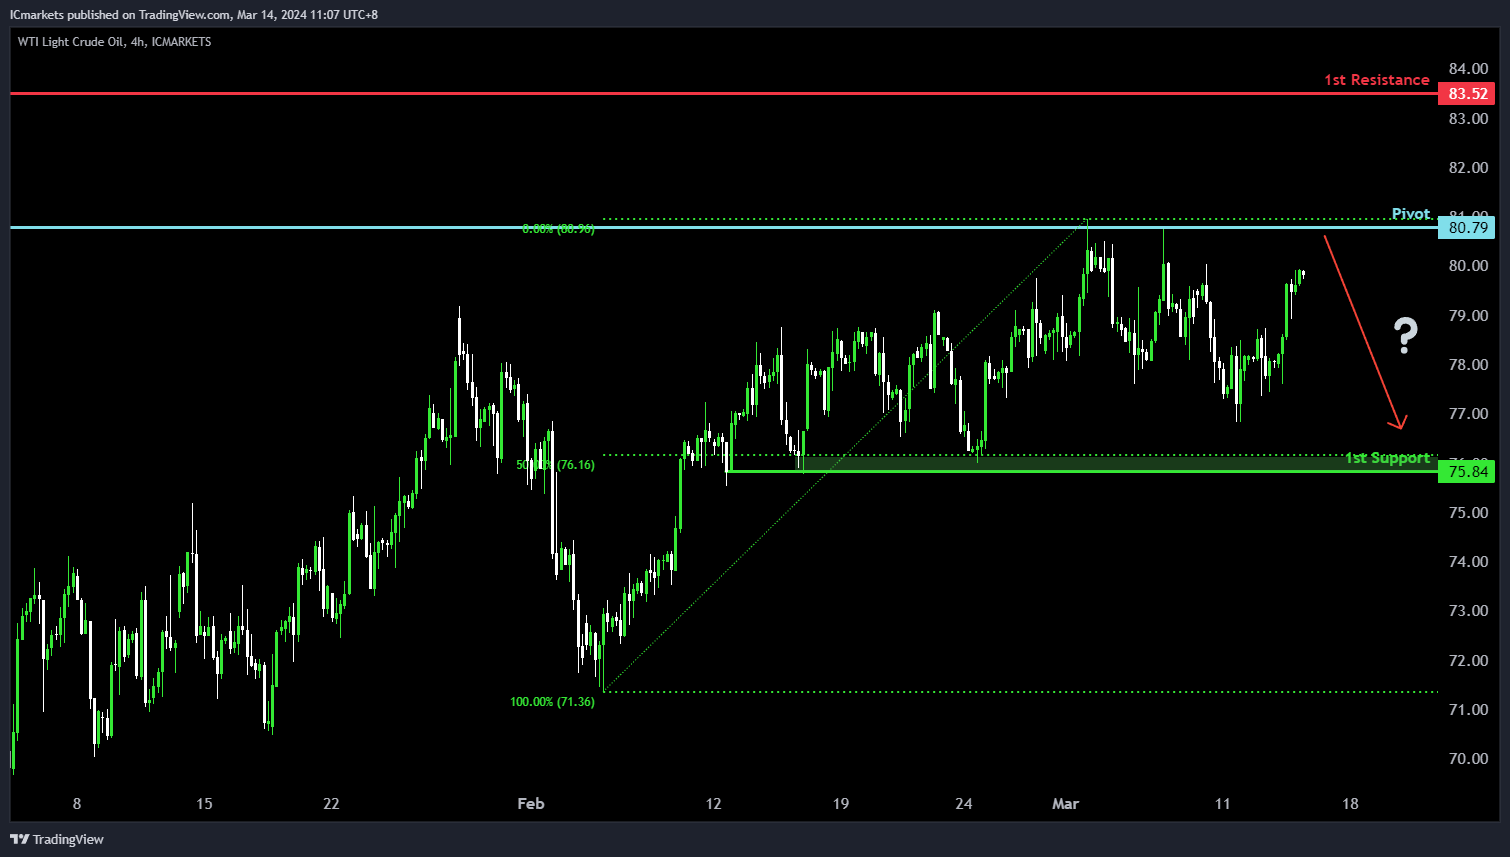
WTI/USD:
The WTI (West Texas Intermediate) chart currently demonstrates a neutral bias. In this context, there is a potential scenario for price to fluctuate between the pivot and the 1st support.
The pivot level at 80.79 is identified as an overlap resistance where price could potentially reverse from to drop lower. Further below, the 1st support level at 75.84 is marked as a pullback support that aligns close to the 50.00% Fibonacci Retracement level, reinforcing its significance as a key support level.
To the upside, the 1st resistance level at 83.52 is noted as a pullback, further reinforcing its significance as a potential barrier to further bullish movement.
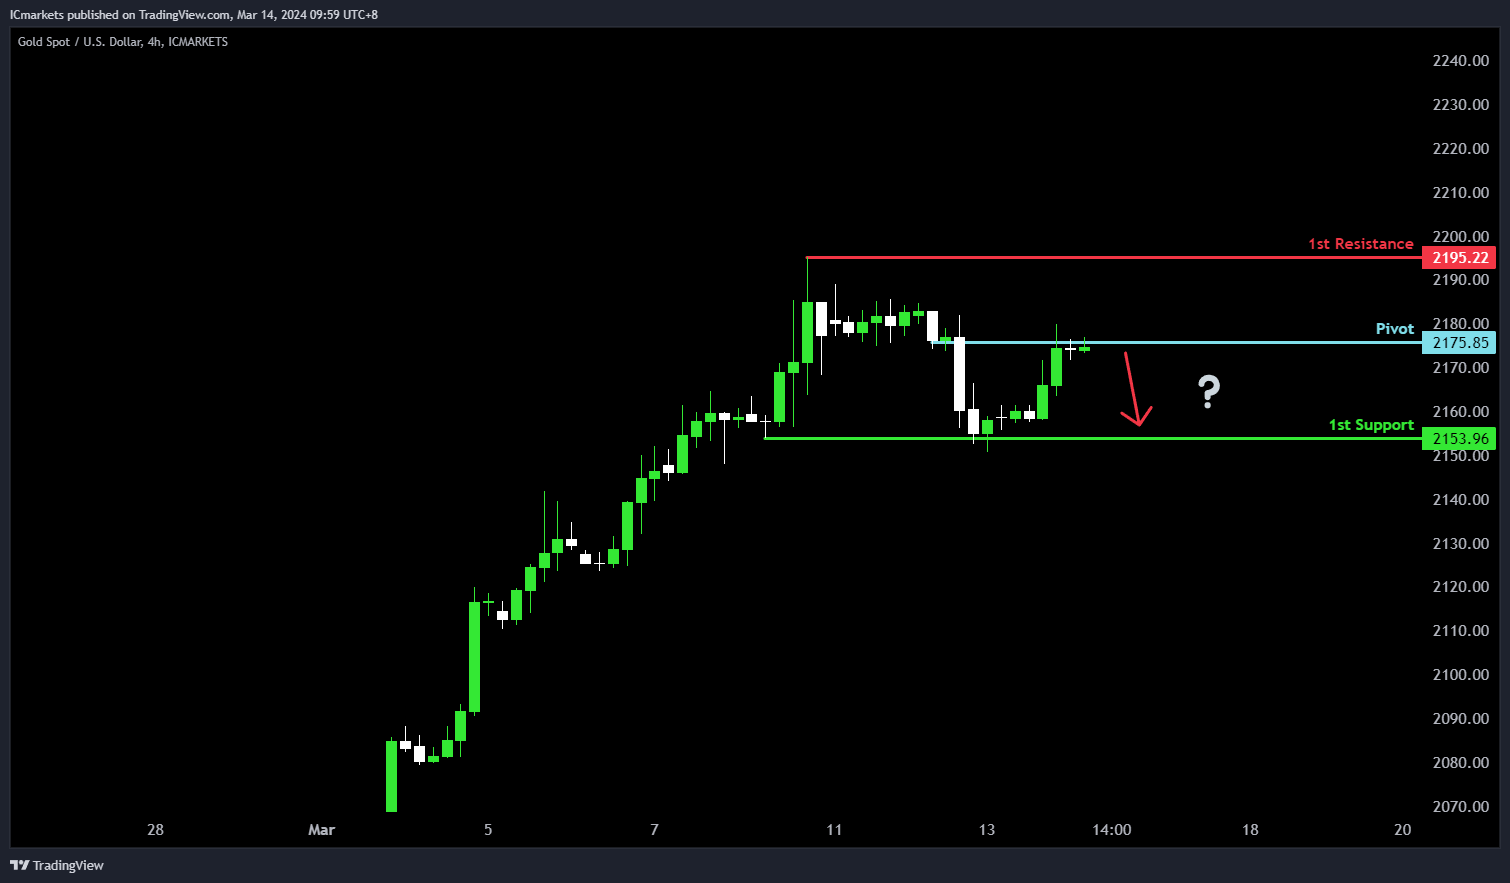
XAU/USD (GOLD):
For XAU/USD, the potential direction is bearish, despite the overall bullish momentum of the chart. There’s a possibility of a bearish reaction off the pivot level, leading to a decline towards the 1st support.
The pivot at 2175.85 is considered an overlap resistance, indicating its historical significance as a level where selling pressure may increase. Conversely, the 1st support at 2153.96 is identified as a multi-swing low support, suggesting it could attract buying interest and potentially halt the downward movement.
On the resistance side, the 1st resistance at 2195.22 is noted as a swing high resistance, indicating its historical significance as a level where selling pressure has previously emerged, potentially limiting further upward movement.
The accuracy, completeness and timeliness of the information contained on this site cannot be guaranteed. IC Markets does not warranty, guarantee or make any representations, or assume any liability regarding financial results based on the use of the information in the site.
News, views, opinions, recommendations and other information obtained from sources outside of www.icmarkets.com, used in this site are believed to be reliable, but we cannot guarantee their accuracy or completeness. All such information is subject to change at any time without notice. IC Markets assumes no responsibility for the content of any linked site.
The fact that such links may exist does not indicate approval or endorsement of any material contained on any linked site. IC Markets is not liable for any harm caused by the transmission, through accessing the services or information on this site, of a computer virus, or other computer code or programming device that might be used to access, delete, damage, disable, disrupt or otherwise impede in any manner, the operation of the site or of any user’s software, hardware, data or property.


