
EUR/USD:
Over the course of Wednesday’s segment, the greenback staged an impressive comeback. A blend of reasonably encouraging US macroeconomic data along with second-rate European and British numbers, specifically UK inflation, weighed on the single currency.
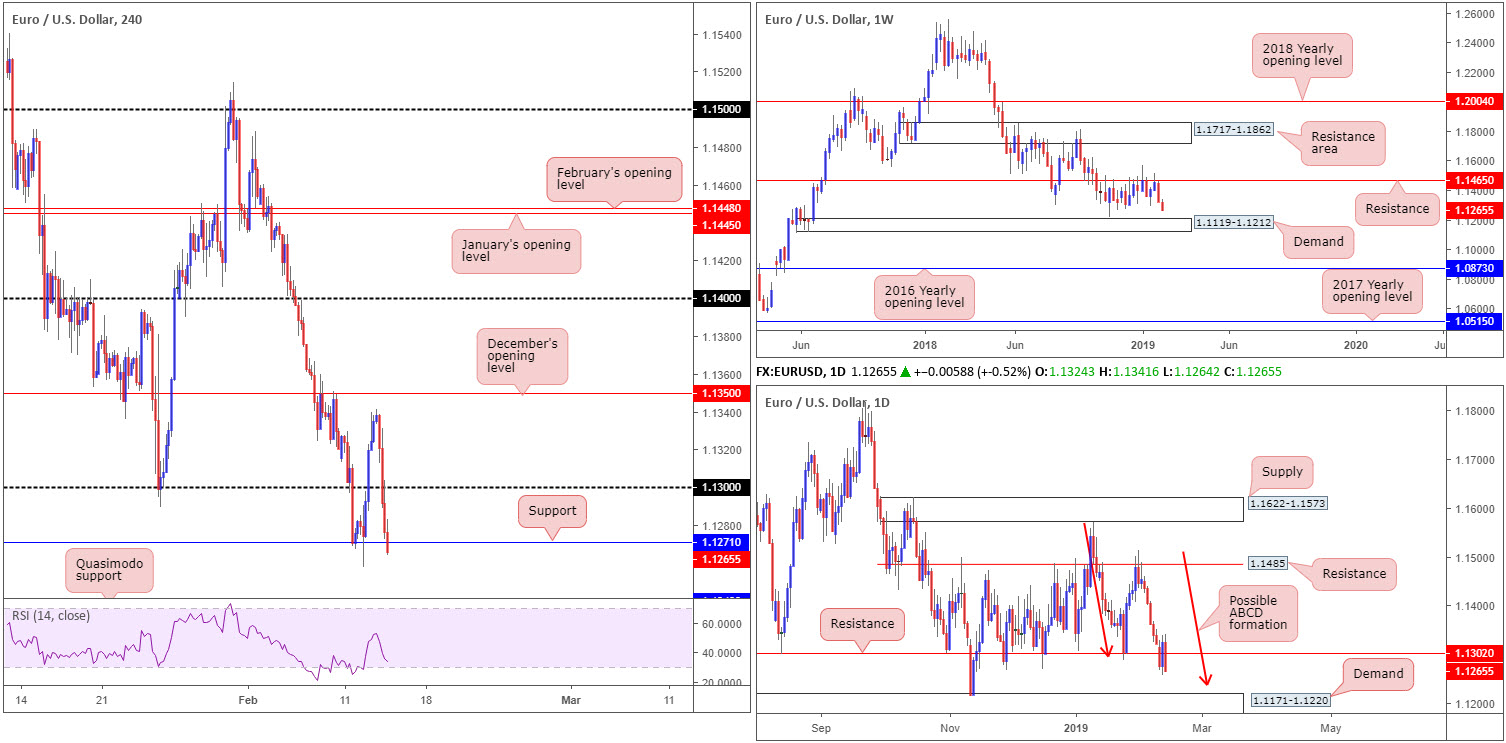
Leaving December’s opening level at 1.1350 unopposed on the H4 timeframe, the H4 candles overthrew its 1.13 barrier and, in recent hours, also reclaimed support at 1.1271. This, assuming we close the day beyond this base, exposes Quasimodo support plotted at 1.1240.
Boasting historical significance as far back as early February 2015 and capping upside action since late October 2018, long standing weekly support/resistance at 1.1465 remains firmly in the frame. The next downside target on the weekly scale has demand at 1.1119-1.1212 in sight this week.
By way of another strong bearish candle, recent trade tunnelled through daily support at 1.1302 (now acting resistance). A continual push to lower ground, as the weekly timeframe suggests, has daily demand at 1.1171-1.1220 next in the firing range (glued to the top edge of the current weekly demand area). It might also be worth noting a possible daily ABCD bullish correction (red arrows) is in the process of forming that completes a few pips north of the aforementioned demand zone around 1.1240ish.
Areas of consideration:
Between 1.1240/1.1220: the H4 Quasimodo support at 1.1240 and the daily ABCD bullish completion also at 1.1240, as well as the top edge of demand printed at 1.1220, offers strong confluence to work with.
For conservative traders concerned regarding the dimensions of the buy zone: 20 pips, waiting for a H4 bullish candlestick formation to take shape is an option. That way, not only is there modest confirmation buyers are involved, traders have entry and stop parameters to work with as well.
Today’s data points: German Prelim GDP q/q; EUR Flash GDP q/q; US Core Retail Sales; US PPI m/m; US Retail Sales m/m; US Core PPI m/m.
GBP/USD:
Pound sterling ceded ground to its US counterpart Wednesday amid a disappointing UK CPI reading, and a robust greenback. The UK Consumer Prices Index (CPI) 12-month rate was 1.8% in January 2019, down from 2.1% in December 2018 (ONS).
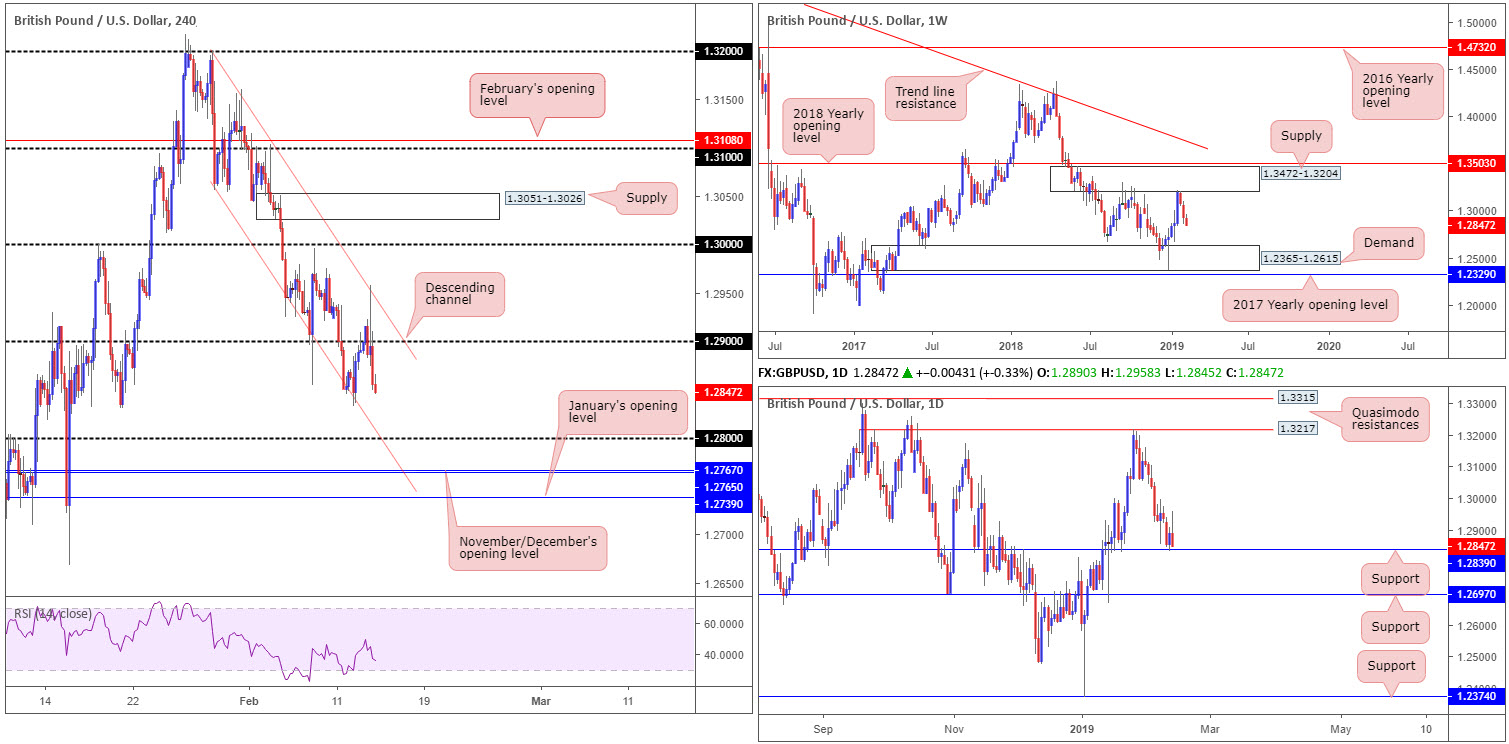
Prior to yesterday’s descent, the pair reclaimed 1.29 on the H4 to the upside and touched gloves with a descending H4 channel resistance (etched from the high 1.3199). For those who read Wednesday’s briefing you may recall this channel resistance was a noted level for sellers, therefore well done to any of our readers who took advantage of the recent move. In terms of H4 structure, the 1.2832 Feb 12 low is next in line, followed closely by the round number 1.28.
On a wider perspective, weekly movement continues to reflect a bearish stance after connecting with the underside of supply at 1.3472-1.3204 a couple of weeks ago. Further selling from current price could potentially stretch as far south as demand pencilled in at 1.2365-1.2615. Daily support, on the other hand, is visible nearby at 1.2839.
Areas of consideration:
From a technical standpoint, the pendulum appears to be swinging in more of a southerly direction.
For folks who remain short, the next area of concern, as briefly discussed above, is the 1.2832 Feb 12 low on the H4 and daily support primed at 1.2839. With this being the case, for sellers looking to get involved, consider waiting and seeing if H4 price prints a close beyond daily support. This, assuming traders are looking to enter on a retest play at the underside of 1.2839, leaves around 30-35 pips to play with until reaching the first potential support: 1.28. It may, therefore, be an idea to drill down to the lower timeframes and search for an entry there. An example is a bearish candlestick pattern on the M30 timeframe. By employing lower-timeframe structure, risk/reward towards 1.28 will increase.
Today’s data points: MPC Member Vlieghe Speaks; US Core Retail Sales; US PPI m/m; US Retail Sales m/m; US Core PPI m/m.
AUD/USD:
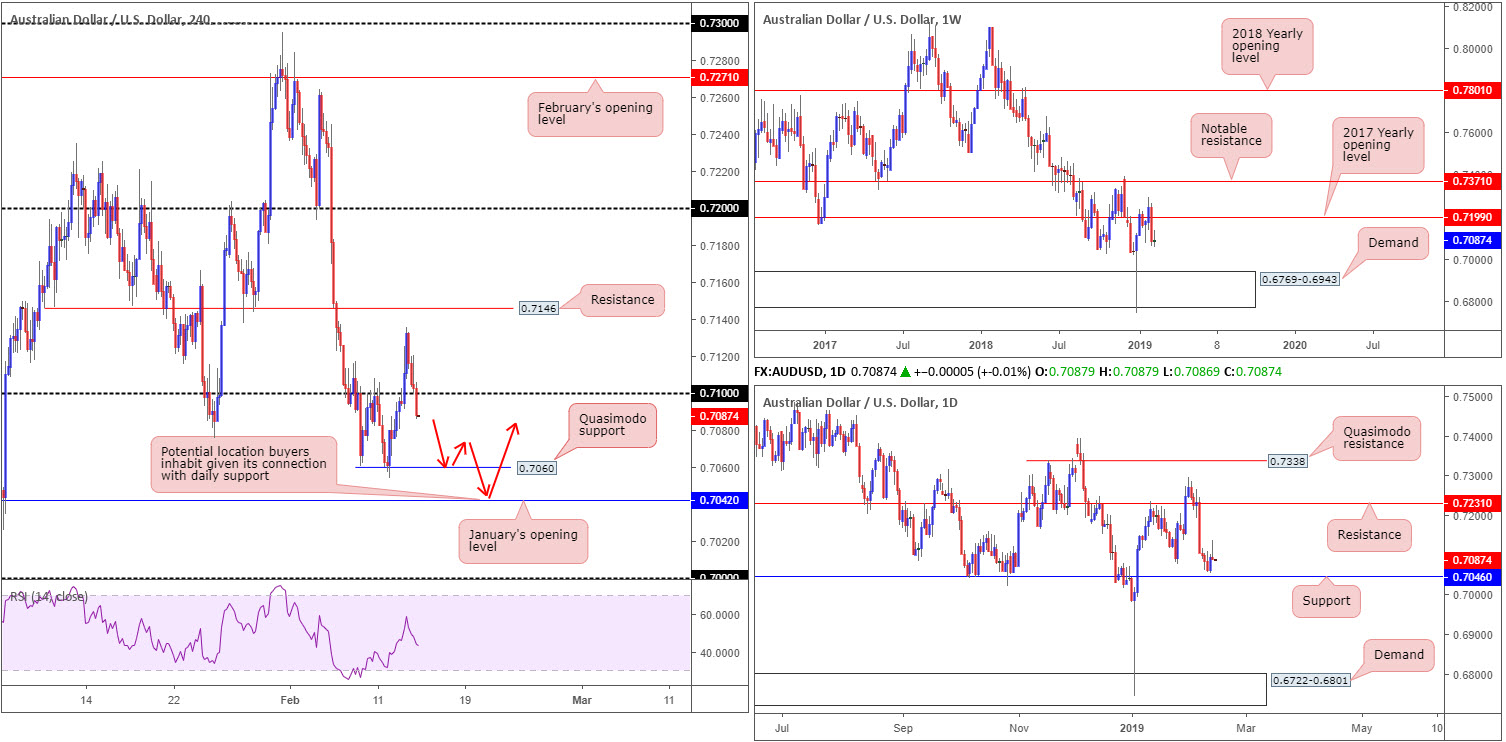
Despite a reasonably robust day for the greenback, demand increased for the commodity-linked currency in the early hours of Asia Wednesday, dragging the H4 candles through its 0.71 psychological mark to highs of 0.7135. It was only as the doors began unlocking in Europe did we observe price action turn south, which, as you can see, ended with the piece recapturing 0.71 at the closing stages of the day.
With 0.71 potentially in the rear view mirror as support, H4 Quasimodo support at 0.7060 is in sight, tailed closely by January’s opening level at 0.7042. Although the H4 Quasimodo may ‘bounce’ price, the real support, according to our technical studies, rests at 0.7042, given it coincides with daily support at 0.7046. While the combination of these two levels may appear high probability, traders need to remind themselves weekly price displays room to press lower. After recapturing its 2017 yearly opening level at 0.7199, scope to press as far south as demand at 0.6769-0.6943 is visible.
Areas of consideration:
Although weekly price appears poised to discover lower levels this week, a reaction from January’s opening level mentioned above on the H4 timeframe at 0.7042, knowing it aligns closely with daily support at 0.7046, remains a possible level for the watchlist today. On the whole, it is trader dependent on what entry method is used to confirm 0.7042 as support, if any. Some traders may prefer to drill down to the lower timeframes and search for a resistance-turned support setup to trade. Others may opt to wait for candlestick confirmation off the H4 timeframe. Irrespective of the method employed, both provide entry/stop parameters to work with and, by extension, confirm buyer intent.
Today’s data points: China Trade Balance; RBA Assist Gov. Kent Speaks; US Core Retail Sales; US PPI m/m; US Retail Sales m/m; US Core PPI m/m.
USD/JPY:
USD/JPY bulls went on the offensive Wednesday, reinforced by notable moves in US equity markets, rising US Treasury yields and the US dollar index pulling itself above the 97.00 mark.
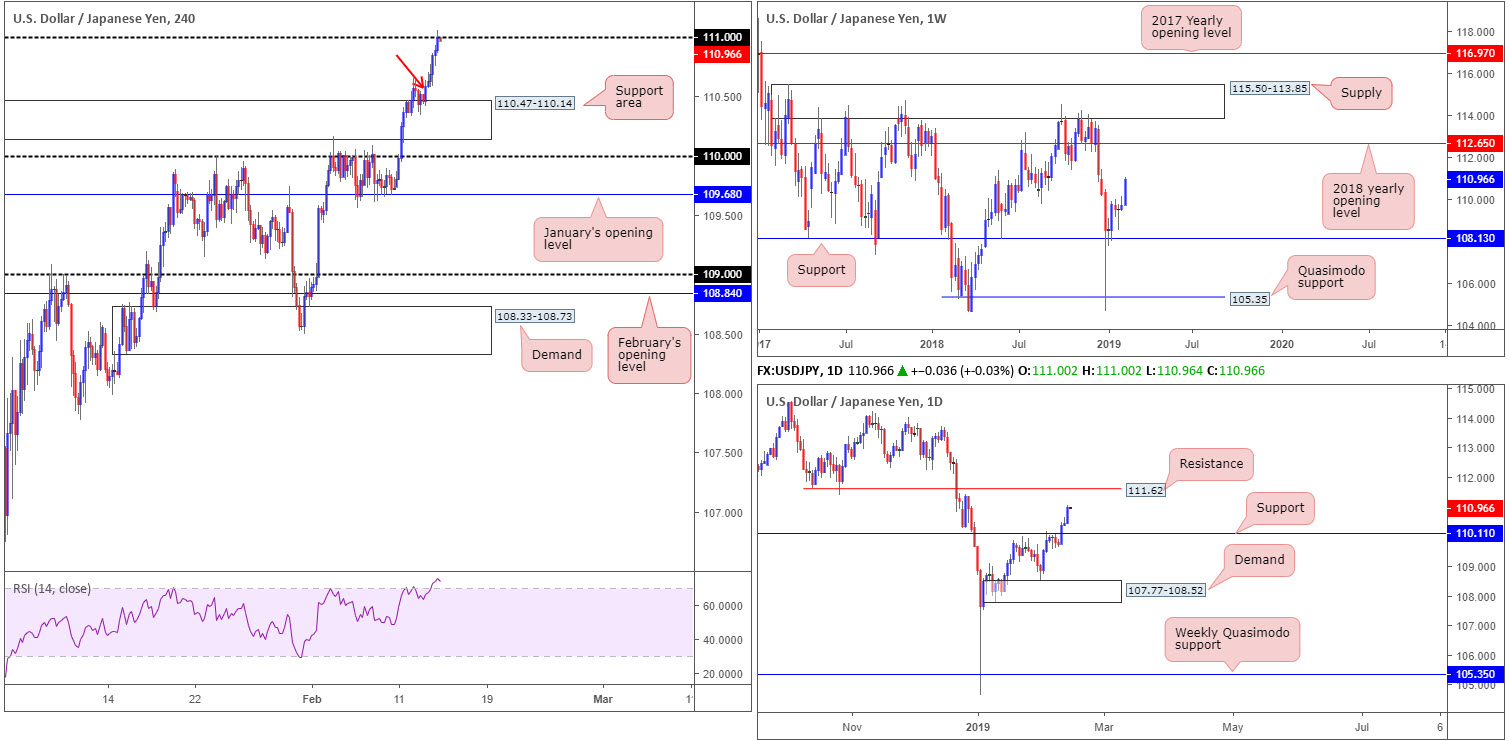
For those who read Wednesday’s briefing you may recall the piece underscored a possible buying opportunity around the top edge of H4 supply at 110.47-110.14, now an acting support area. The idea was to enter on the back of a H4 bullish candlestick formation out of the said zone. This, as you can see, took shape in the early hours of Asia yesterday (red arrow) and continued to press north until shaking hands with the 111 handle: the first upside target.
In addition to the H4 support area and aligning bullish candlestick pattern, both weekly and daily timeframes demonstrate interest in higher ground. Weekly movement is eyeing further upside towards the 2018 yearly opening level at 112.65. Supporting this we have daily price recently clawing its way above resistance at 110.11 (now acting support), with the next upside target resting around 111.62.
Areas of consideration:
For those currently long this market, reducing risk to breakeven and taking partial profits off the table is an option now. According to the higher-timeframe picture, though, a push through orders at 111 is high probability, with the possibility of striking daily resistance at 111.62 and then eventually, with a little bit of oomph from the buyers, 112.65 on the weekly timeframe.
For traders who missed the initial long, entering long above 111 is an option. A retest of 111 as support following a move higher (preferably in the shape of a H4 bullish candlestick formation) is sufficient evidence to consider buying this market (entry/stop parameters can be defined according to the candlestick’s rules of engagement).
Today’s data points: US Core Retail Sales; US PPI m/m; US Retail Sales m/m; US Core PPI m/m.
USD/CAD:
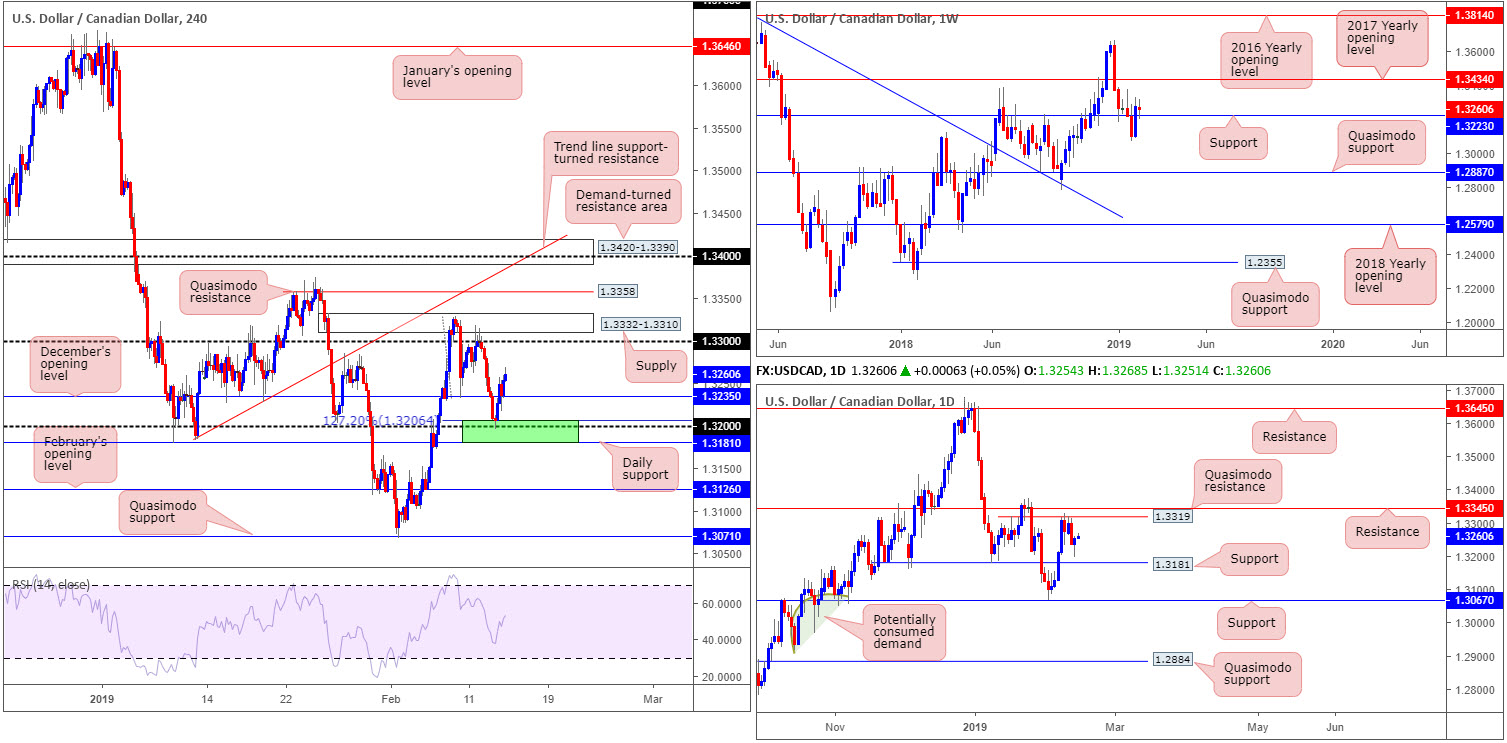
In Wednesday’s briefing the research team highlighted a possible buy zone at 1.3181/1.3206, marked in green on the H4 timeframe. The area was favoured due to nearby weekly support fixed at 1.3223, and also because the area’s base is formed by daily support coming in at 1.3181.
Bolstered by broad-based USD buying, the H4 candles hit the brakes around the top edge of the said H4 zone and reversed higher. The move conquered December’s opening level nearby at 1.3235 and is now poised to tackle the 1.33 handle. Well done to any of our readers who managed to take advantage of this area. Stop-loss orders should be firmly at breakeven by now, with a portion of the position nicely tucked away in the account.
Areas of consideration:
Around 1.33 there’s an awful lot of wood to chop through in terms of resistance. Circulating above 1.33, we have H4 supply at 1.3332-1.3310, and not too far above that there’s H4 Quasimodo resistance at 1.3358. Further adding to this, a daily Quasimodo resistance is seen at 1.3319, followed closely by 1.3345. Therefore, although weekly price displays room to press north towards the 2017 yearly opening level at 1.3434, the noted H4 and daily resistances are likely to hamper upside. As such, liquidating the majority of any long positions around 1.33ish is certainly something to consider.
Traders who missed the long out of 1.3181/1.3206 may be offered a second chance to buy this market should the unit pullback towards December’s opening level mentioned above on the H4 timeframe at 1.3235, without testing 1.33. A bounce off 1.3235 by way of a H4 or H1 bullish candlestick structure (entry and stop parameters can be drawn from this pattern), is, in view of the overall surroundings, a high-probability buying opportunity for either newer traders to enter the market, or for those already long, to pyramid their position.
Today’s data points: US Core Retail Sales; US PPI m/m; US Retail Sales m/m; US Core PPI m/m; CAD Manufacturing Sales m/m.
USD/CHF:
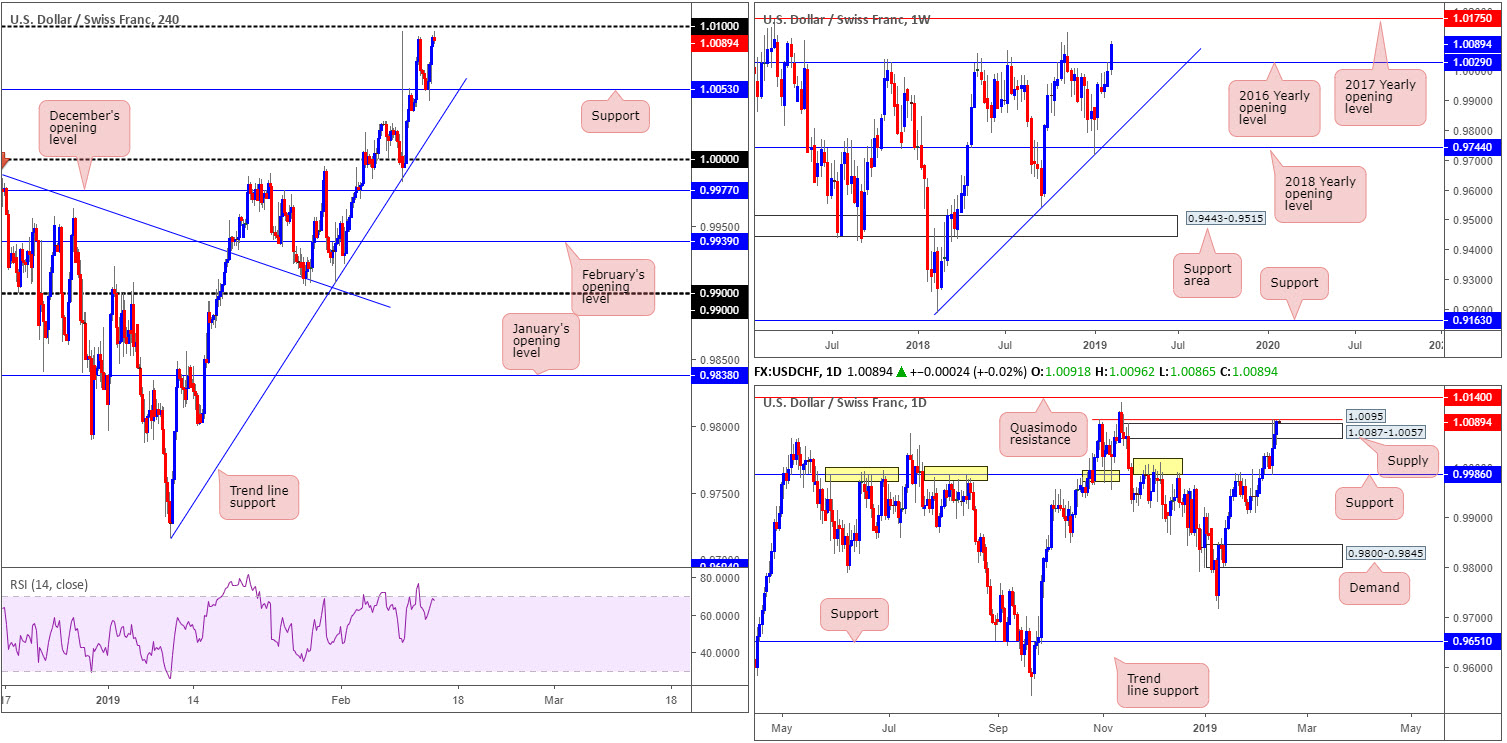
Up nearly 1.00% on the week so far, weekly price is visibly establishing firm ground after tunnelling above its 2016 yearly opening level at 1.0029. The next area of concern to the upside from here is seen at 1.0175: the 2017 yearly opening level.
Against the backdrop of weekly flow, daily action breached the top edge of a supply area coming in at 1.0087-1.0057 yesterday, likely filling a large portion of stop-loss orders. While this may be the case, the move almost immediately brought Quasimodo resistance at 1.0095 into the mix.
Bridging over to the H4 candles, however, the unit is seen hovering a few pips south of its 1.01 handle following a modest rotation north off support at 1.0053. The important thing to consider here is 1.01 has capped upside on a number of occasions since April 2017, therefore a response is expected.
Areas of consideration:
The 1.01 handle’s history, alongside the current daily Quasimodo resistance at 1.0095, is likely enough of a ceiling to hinder upside movement, despite weekly flow eyeing higher levels.
In the event H4 action strikes 1.01 and rejects the base in the form of a notable H4 bearish candlestick pattern, this is considered a reasonably healthy sell signal, targeting H4 support at 1.0053 as the initial take-profit zone. Of course, some traders may feel having a daily Quasimodo resistance positioned nearby is sufficient evidence to execute a sell from 1.01, while others may prefer to drill down to lower timeframes and search for a support-turned resistance setup to trade.
It is trader dependent as to how one confirms 1.01.
Today’s data points: US Core Retail Sales; US PPI m/m; US Retail Sales m/m; US Core PPI m/m.
Dow Jones Industrial Average (DOW 30):
US equities built on Tuesday’s advance during Wednesday’s segment, up 0.33% on the day. News of US President Trump stating the 1 March deadline to reach a trade deal with China could slide back a little if talks are progressing, introduced positive risk sentiment.
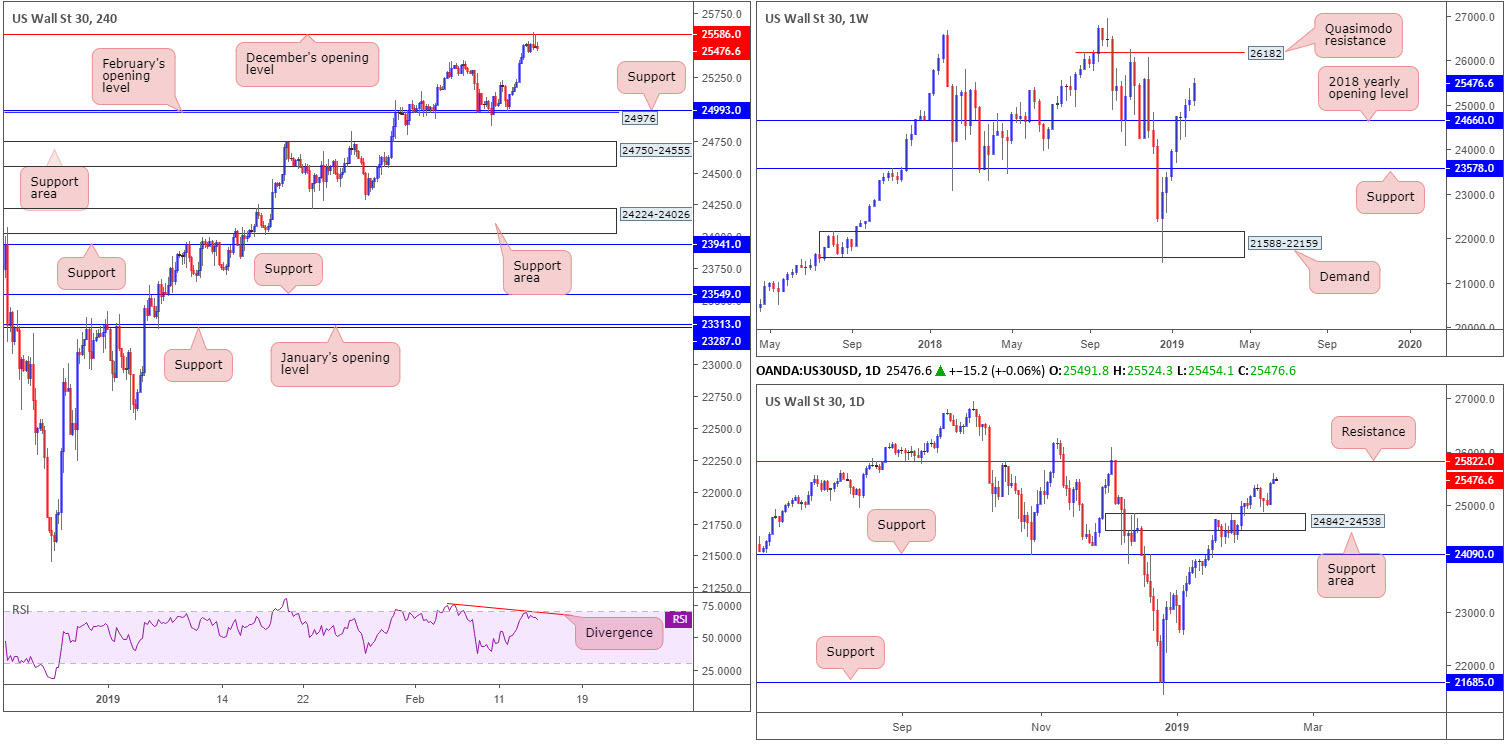
Weekly price continues to explore higher ground, with its next upside target not entering the fold until Quasimodo resistance at 26182. Despite this, daily flow could potentially throw a spanner in the works for weekly buyers as price is seen nearing resistance plotted at 25822. Meanwhile, over on the H4 chart, the candles are struggling to overthrow December’s opening level at 25586. Note yesterday’s movement chalked up two back-to-back bearish pin-bar candlestick patterns off of this barrier into the close. It is also worth noting the H4 RSI indicator is seen displaying a divergence reading.
Areas of consideration:
Having seen two H4 bearish candlestick patterns emerge from December’s opening level at 25586, candlestick traders will certainly be showing interest around this neighbourhood. Nevertheless, for those who take into account what the bigger picture is showing, you may, like our research team, have come to the conclusion the buyers’ work is not finished.
With the daily resistance level at 25822 seen as the next upside target, there’s little room to manoeuvre beyond 25586, in terms of reasonable risk to reward.
In light of the above reading, neither a long nor short seems attractive.
Today’s data points: US Core Retail Sales; US PPI m/m; US Retail Sales m/m; US Core PPI m/m.
XAU/USD (GOLD):
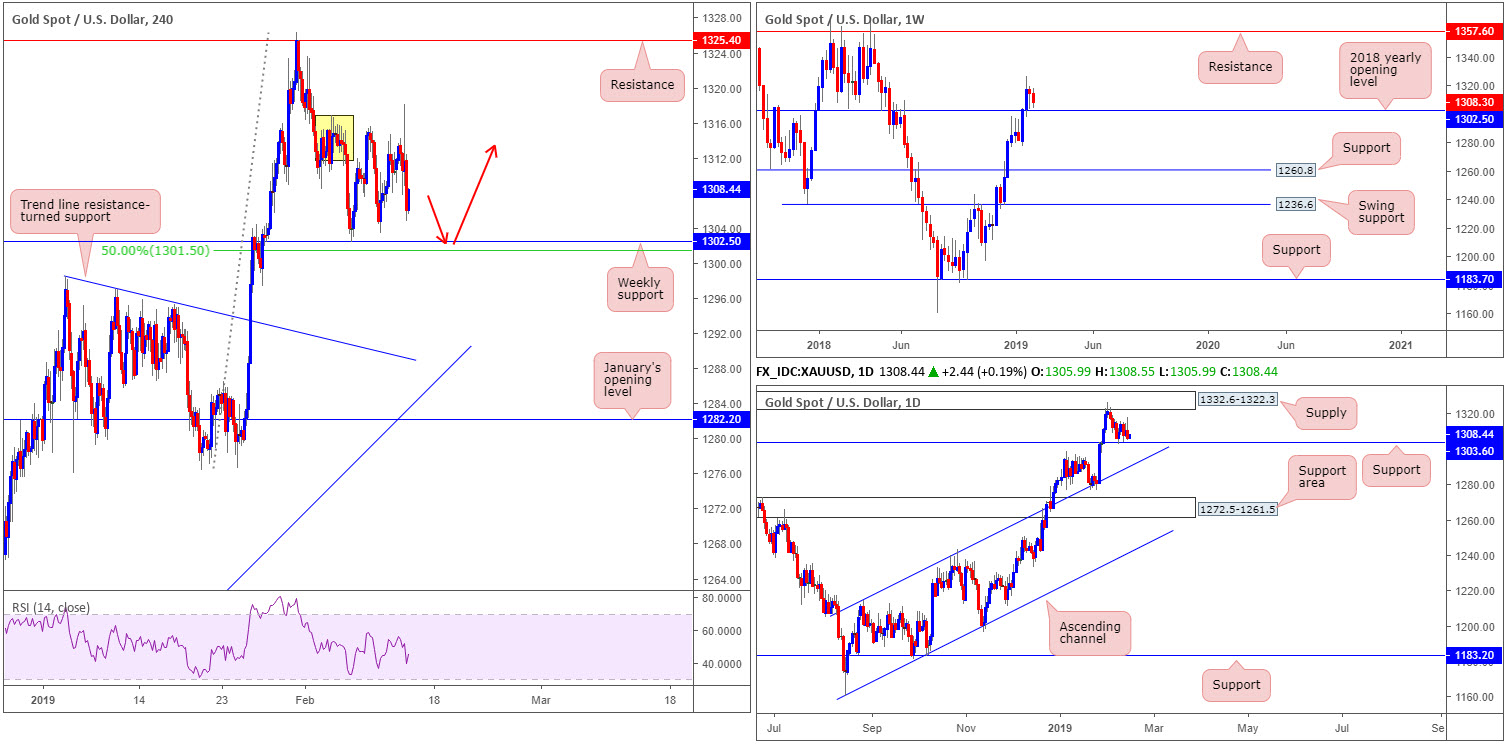
Using a top-down approach this morning, traders will likely acknowledge weekly movement struggled to generate much follow-through action to the upside after tunnelling above the 2018 yearly opening level at 1302.5. The yellow metal is seen hovering just north of this level which could act as potential support going forward.
The story on the daily timeframe, however, reveals we have support in play around the 1303.6 region (a Quasimodo resistance-turned support), following a modest rejection out of supply coming in at 1332.6-1322.3. Beyond the current support, it may be an idea to note the channel resistance-turned support (extended from the high 1214.3) as the next downside target in the event we push lower.
Things over on the H4 timeframe point to a resurgence of bidding. Supply, marked in yellow around 1316.9/1311.7, suffered a breach to the upside amid the early hours of US trade Wednesday, possibly unlocking the door towards resistance at 1325.4. Note this level is planted within the walls of the aforementioned daily supply. On the H4 timeframe, the current weekly support has been applied, which, as you can see, is positioned close by a 50.0% support value at 1301.5.
Areas of consideration:
All three timeframes point to a possible upside move today/this week from the weekly support mentioned above at 1302.5. Should the H4 candles connect with the support level and chalk up some form of additional confirmation (this can be anything from a simple H4 bullish candlestick pattern to drilling down to the lower timeframes and trading more complex local structure), a long in this market is high probability, targeting the H4 supply zone as an initial upside point, followed then by the underside of daily supply at 1322.3.
The use of the site is agreement that the site is for informational and educational purposes only and does not constitute advice in any form in the furtherance of any trade or trading decisions.
The accuracy, completeness and timeliness of the information contained on this site cannot be guaranteed. IC Markets does not warranty, guarantee or make any representations, or assume any liability with regard to financial results based on the use of the information in the site.
News, views, opinions, recommendations and other information obtained from sources outside of www.icmarkets.com.au, used in this site are believed to be reliable, but we cannot guarantee their accuracy or completeness. All such information is subject to change at any time without notice. IC Markets assumes no responsibility for the content of any linked site. The fact that such links may exist does not indicate approval or endorsement of any material contained on any linked site.
IC Markets is not liable for any harm caused by the transmission, through accessing the services or information on this site, of a computer virus, or other computer code or programming device that might be used to access, delete, damage, disable, disrupt or otherwise impede in any manner, the operation of the site or of any user’s software, hardware, data or property.


