
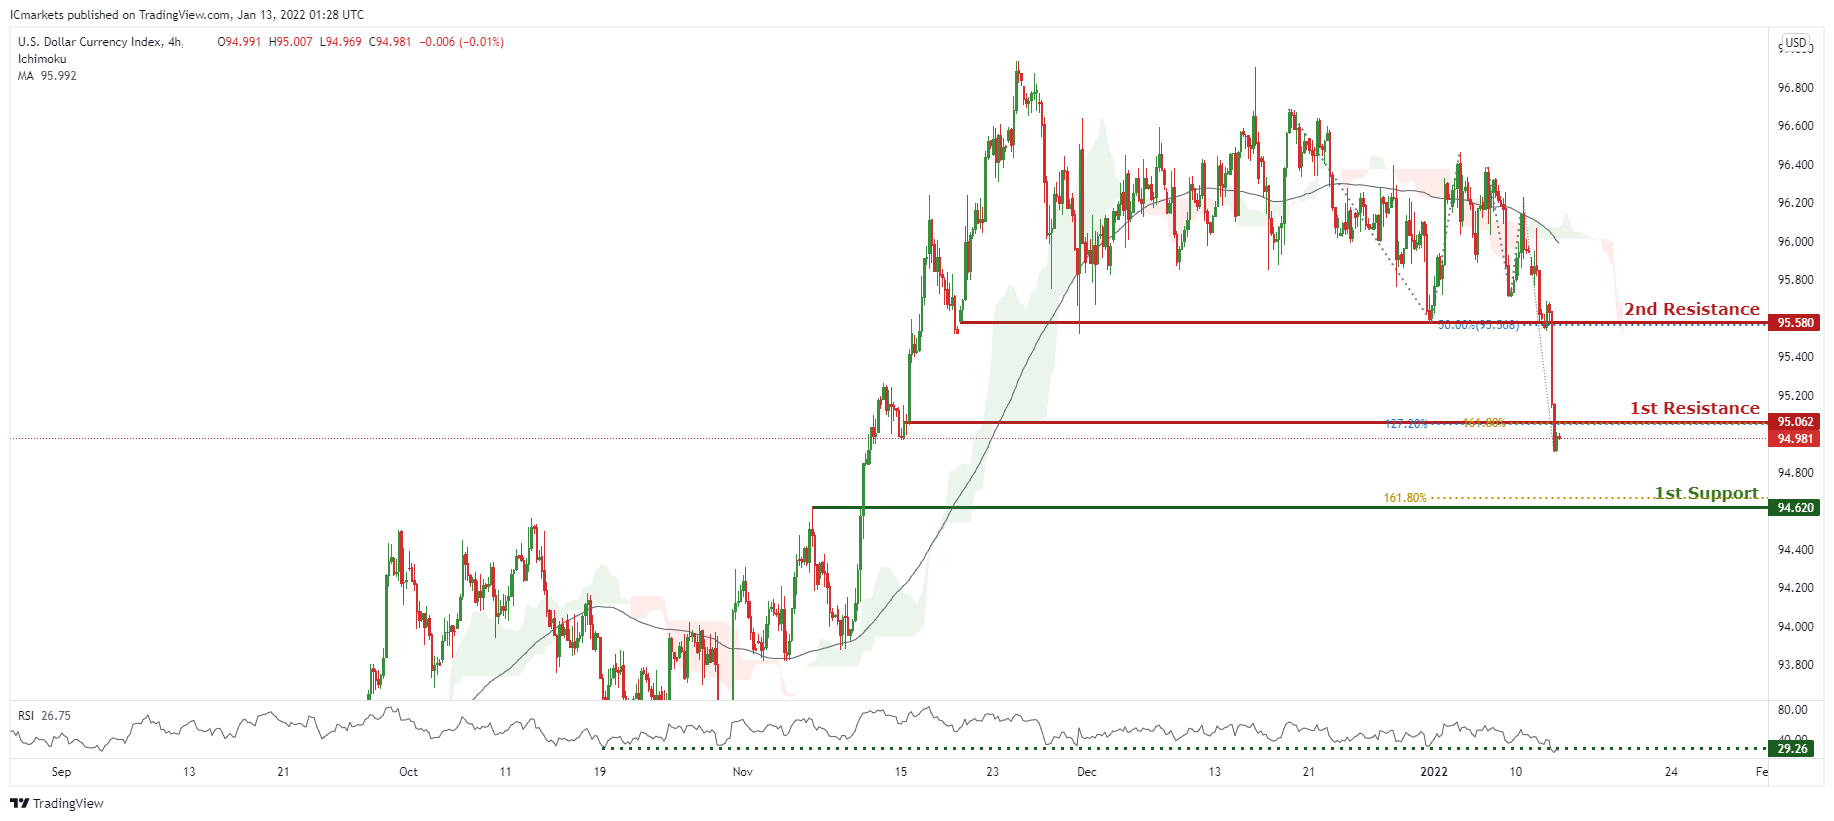
DXY:
On the H4 timeframe, prices are on bearish momentum and abiding to our bearish trendline. We would expect further bearish continuation to test our 1st resistance at 95.062 in line with 127.2% Fibonacci extension and 161.8% Fibonacci projection. Our bearish bias is further supported by prices trading below ichimoku clouds and RSI forecasting bearish momentum.
Areas of consideration:
- H4 time frame, 1st resistance at 95.062
- H4 time frame, 1st support at 94.620
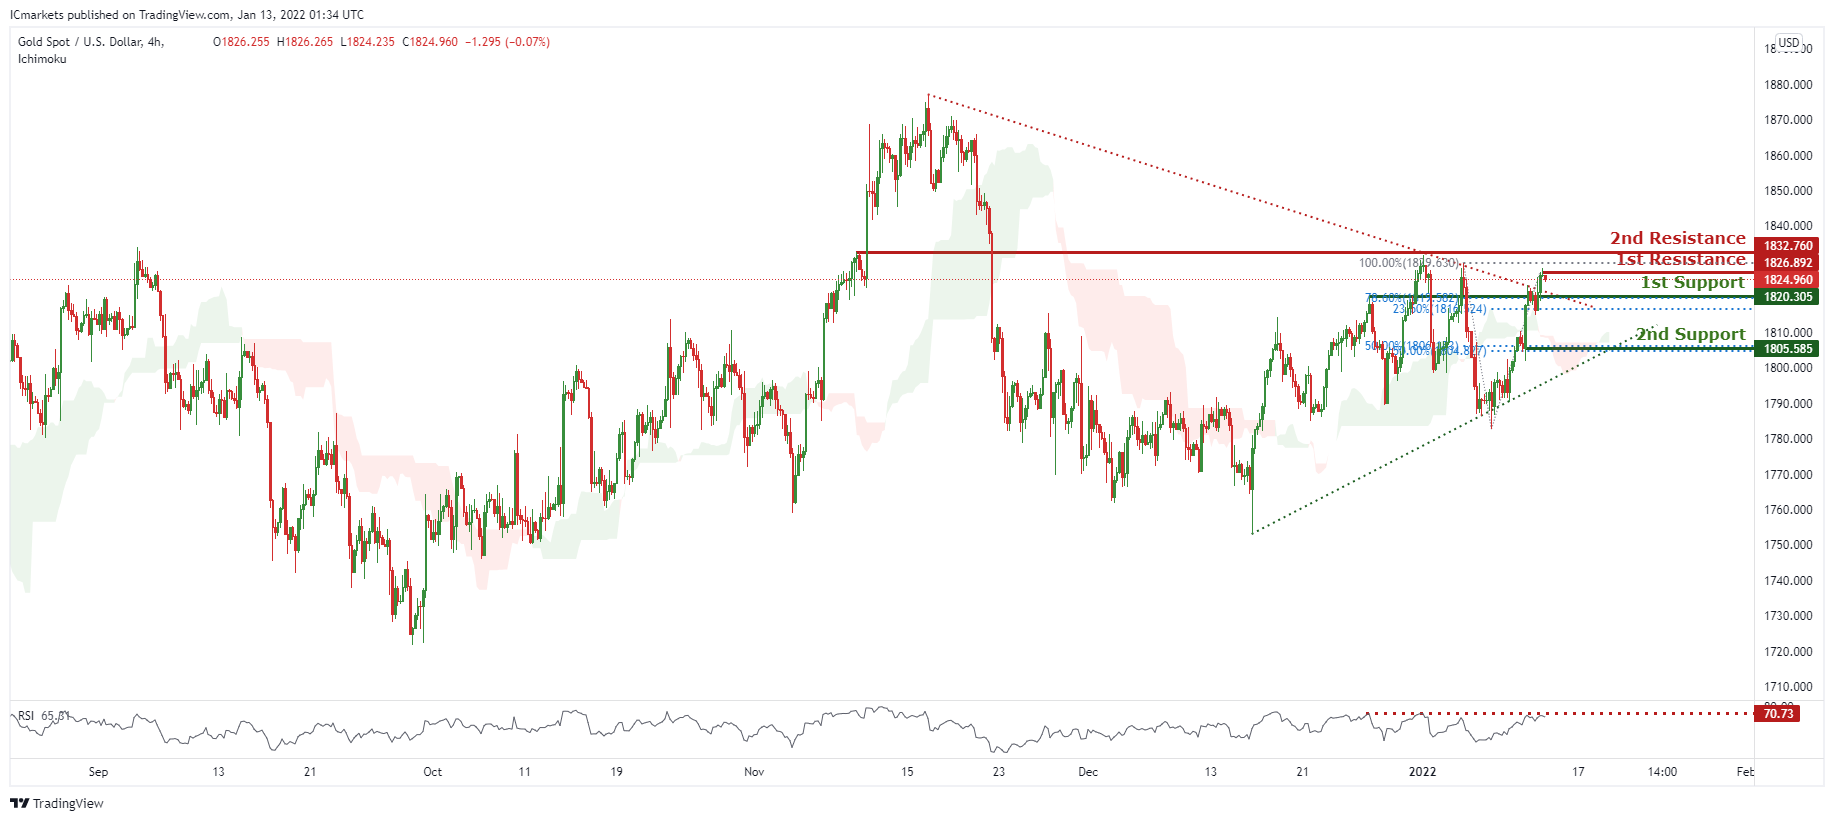
XAU/USD (GOLD):
On the H4 chart, prices have broken out of the triangle. We see the potential for a dip from our 1st resistance at 1826.892 in line with 100% Fibonacci retracement towards our 1st support at 1820.305 in line with 78.6% Fibonacci extension and 23.6% Fibonacci retracement. RSI is at levels where dips occurred previously and ichimoku is turning red, further supporting our bearish bias.
Areas of consideration:
- H4 1st support at 1820.305
- H4 1st resistance at 1826.892
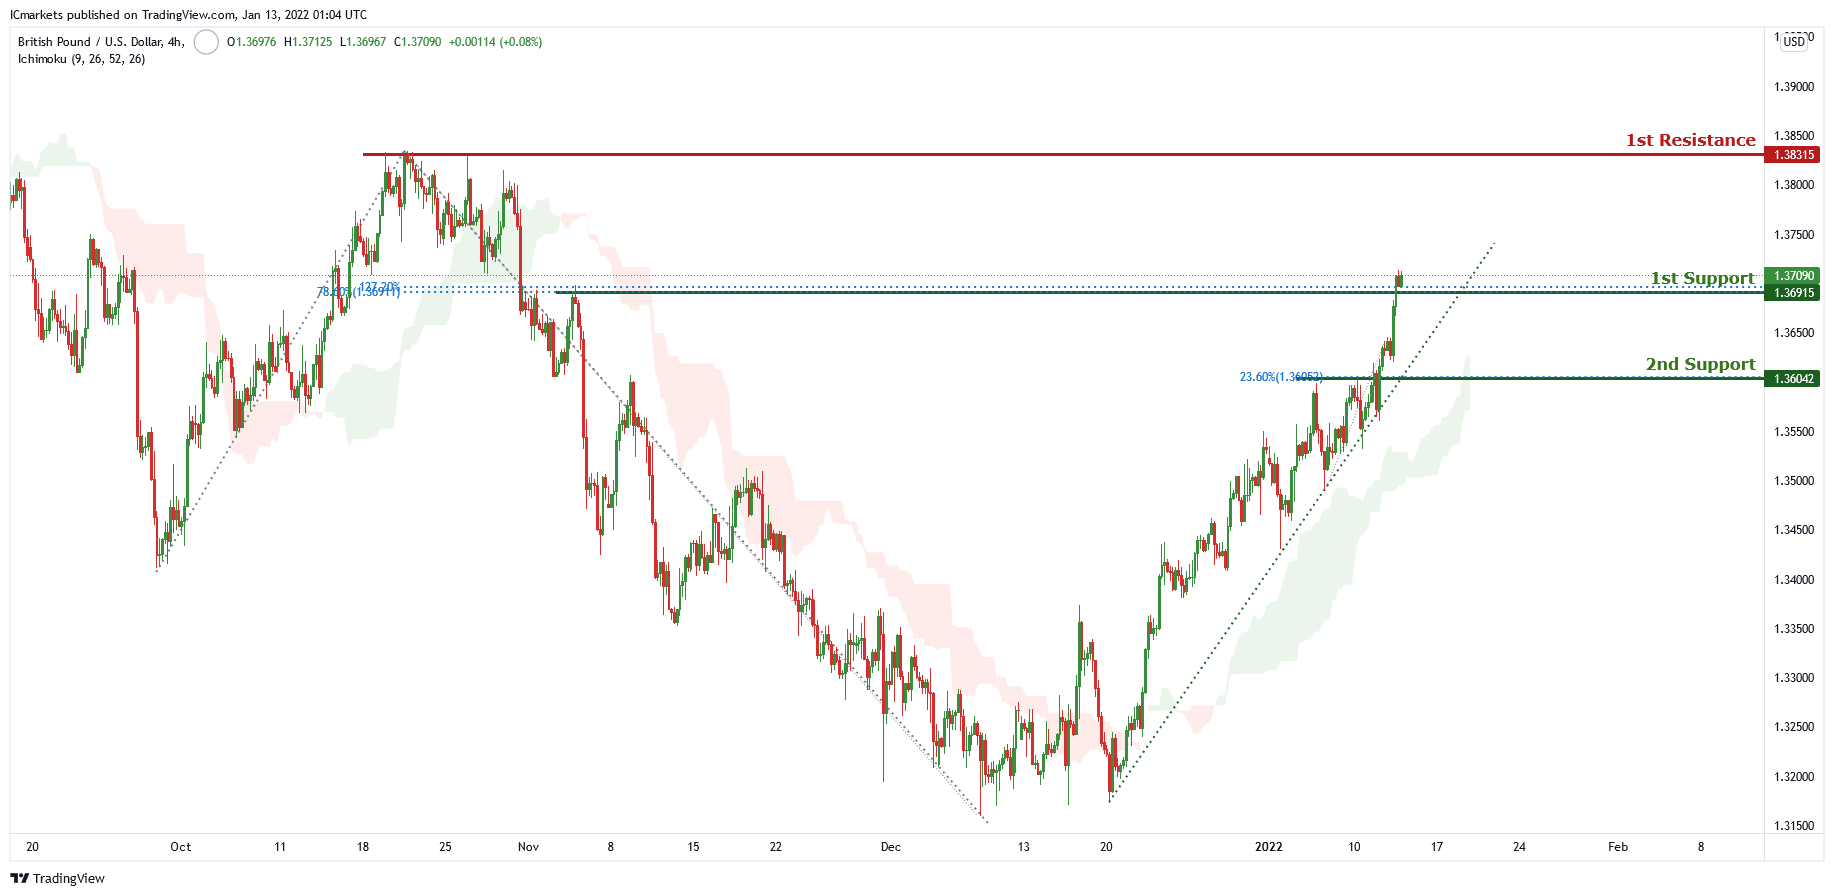
GBP/USD:
On the H4 chart price is abiding by an ascending trendline and near the first support level of 1.36915 which is also 78.6%% Fibonacci retracement and 127.2% Fibonacci projection . Price can potentially go to the 1st resistance level of 1.38315 which is the graphical swing high level. Our bullish bias is supported by the ichimoku cloud indicator as price is trading above it.
Areas of consideration:
- H4 1st resistance at 1.38315
- H4 1st support 1.36915
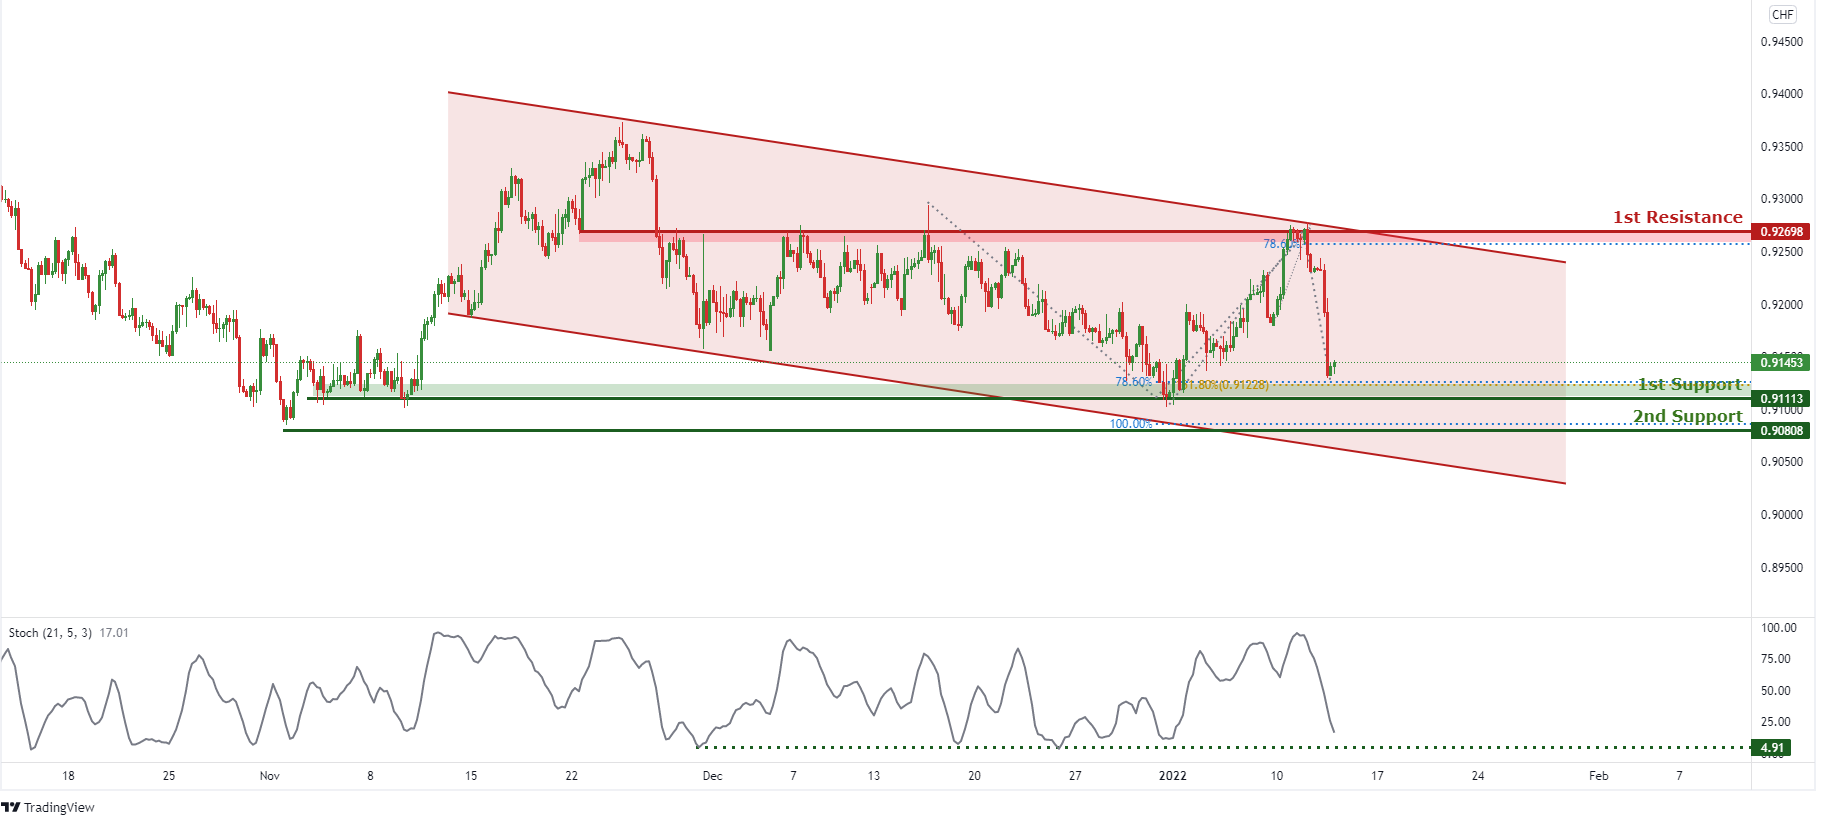
USD/CHF:
On the H4 timeframe, price is abiding to a descending channel, signifying a bearish momentum. Price is approaching a support level, we can expect price to make a short-term bullish bounce in line with 78.6% Fibonacci Projection and 161.8% Fibonacci retracement towards 1st Resistance in line with 78.6% Fibonacci projection. Our short-term bullish bias is further supported by the stochastic indicator where the %K line is approaching the support level.
Areas of consideration:
- Watch 1st Support at 0.91113
- Watch 1st Resistance at 0.92698
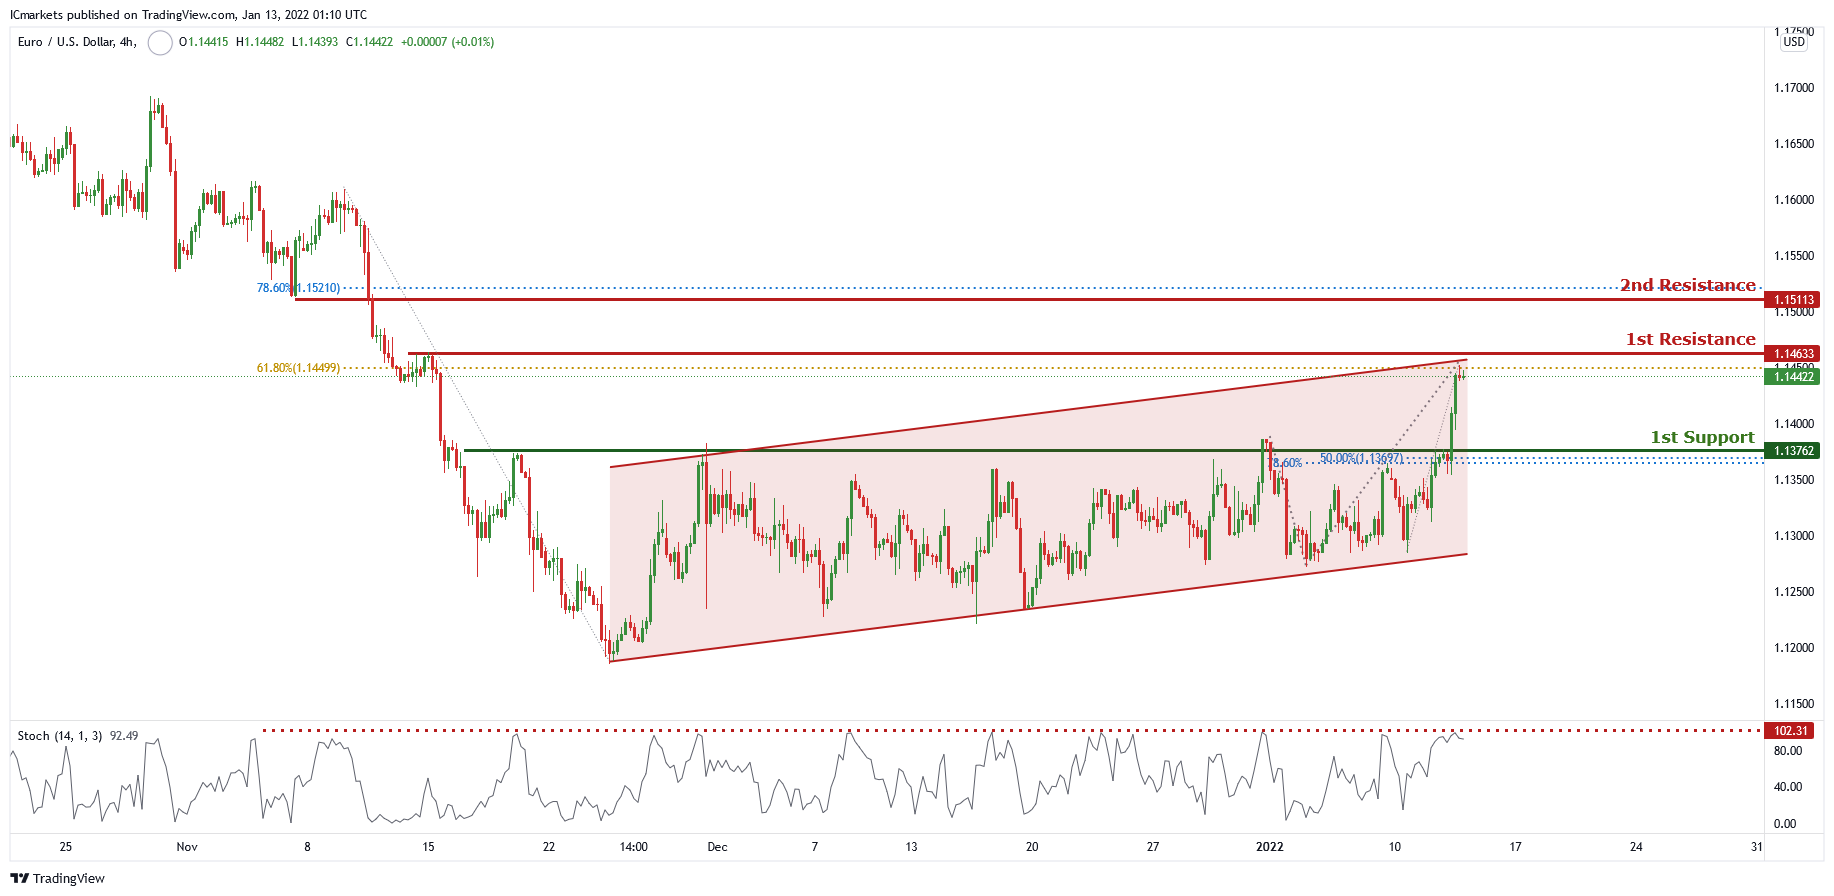
EUR/USD :
On the H4 chart price is trading in a descending channel and near 1st resistance level of 1.14633 which is also 61.8% Fibonacci retracement. Price can potentially dip to the 1st support level of 1.13762 which is also 50% Fibonacci retracement and 78.6% Fibonacci projection. Our bullish bias is supported by the stochastic indicator as it is near resistance level.
Areas of consideration:
- H4 1st support at 1.13762
- H4 1st resistance at 1.14633
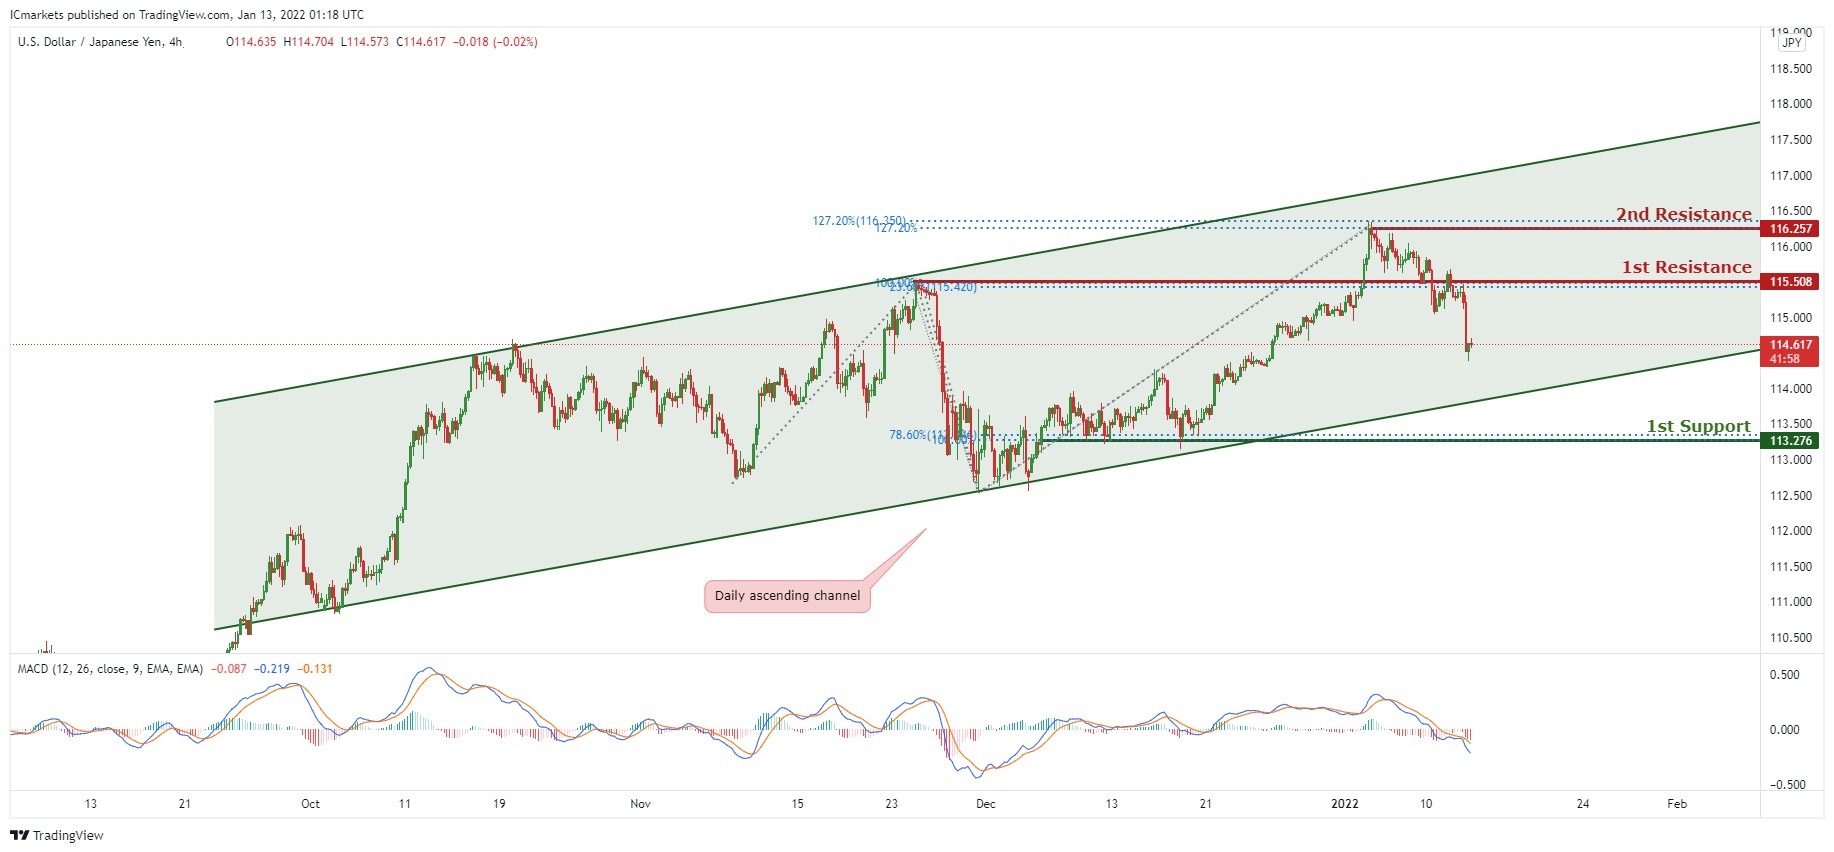
USD/JPY:
In reference to yesterday’s analysis, price is moving down nicely towards the 1st Support. On the H4 timeframe, is abiding to the ascending channel on the daily, signifying an overall bullish momentum. However, we can expect price to make a short-term bearish drop from 1st Resistance in line with 100% Fibonacci projection and 23.6% Fibonacci Retracement towards 1st Support in line with 78.6% Fibonacci retracement. Our short-term bearish bias is further supported by the MACD indicator where the signal line is above the MACD line. Traders are advised to wait for price to swing higher or lower before entering.
Areas of consideration:
- H4 1st resistance level 115.508
- H4 1st support level 113.276
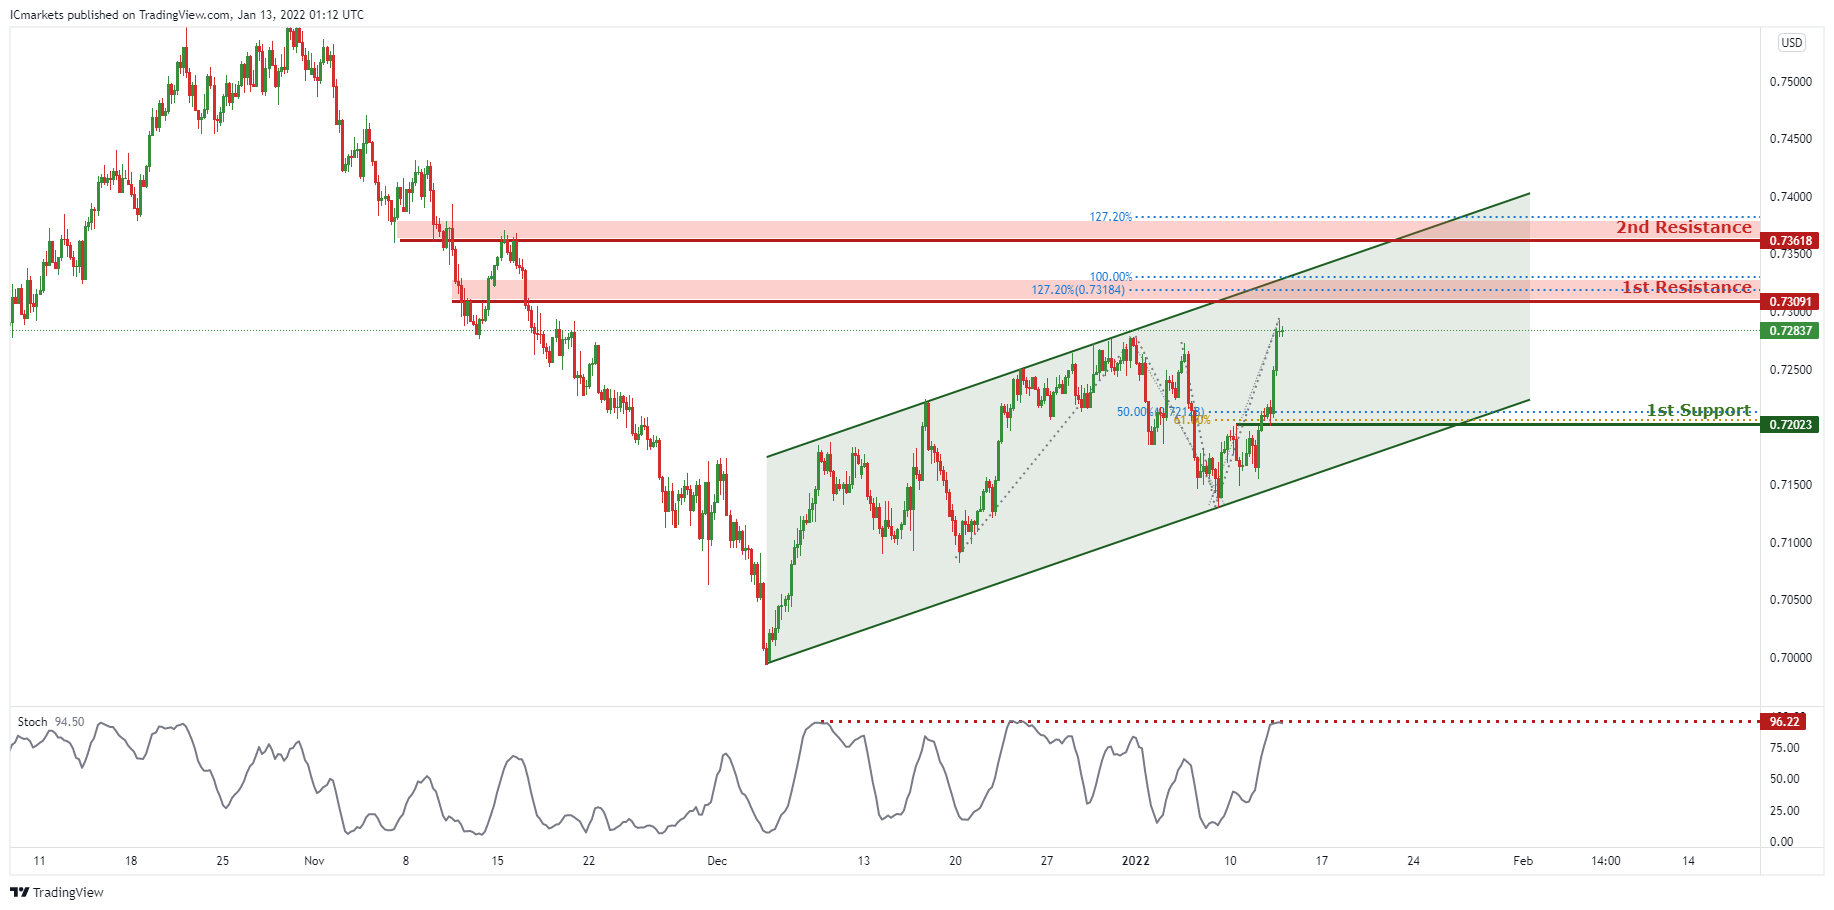
AUD/USD:
On the H4, price is reacting within the ascending channel, signifying an overall bullish momentum. Price is approaching the 1st Resistance, we can expect to see price make a short-term bearish drop from 1st Resistance in line with 127.2% Fibonacci extension and 100% Fibonacci projection towards 1st Support in line with 50% Fibonacci retracement and 61.8% Fibonacci projection. Our short-term bearish bias is further supported by the stochastic indicator where the %K line is at the resistance level.
Areas of consideration:
- H4 1st Support level 0.72023
- H4 1st resistance level 0.73091
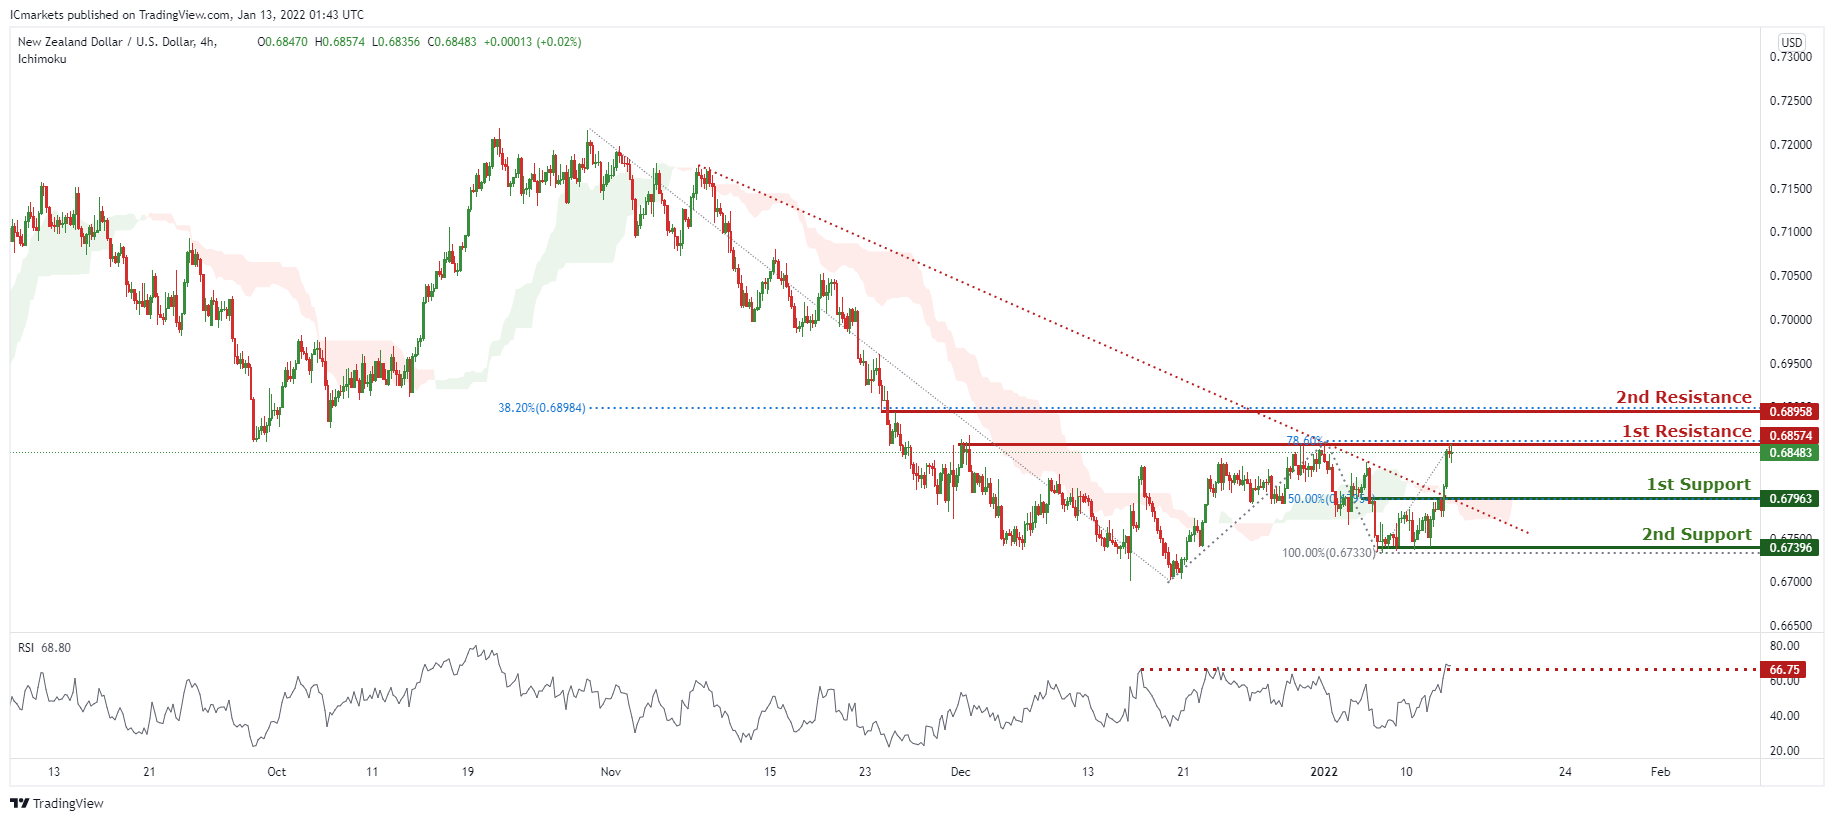
NZD/USD:
On the H4 timeframe, prices have broken out of our bearish trendline. We see potential for prices to dip further from our 1st resistance at 0.68574 in line with 78.6% Fibonacci retracement towards our 1st support at 0.67963 in line with 50% Fibonacci retracement. Our bias is further supported by ichimoku clouds forecasting the dip and RSI is at an all time high. If prices break our 1st support, prices can potentially dip towards our 2nd support at 0.67396 in line with 100% Fibonacci retracement.
Areas of consideration:
- H4 time frame, 1st resistance at 0.68574
- H4 time frame, 1st support at 0.67963
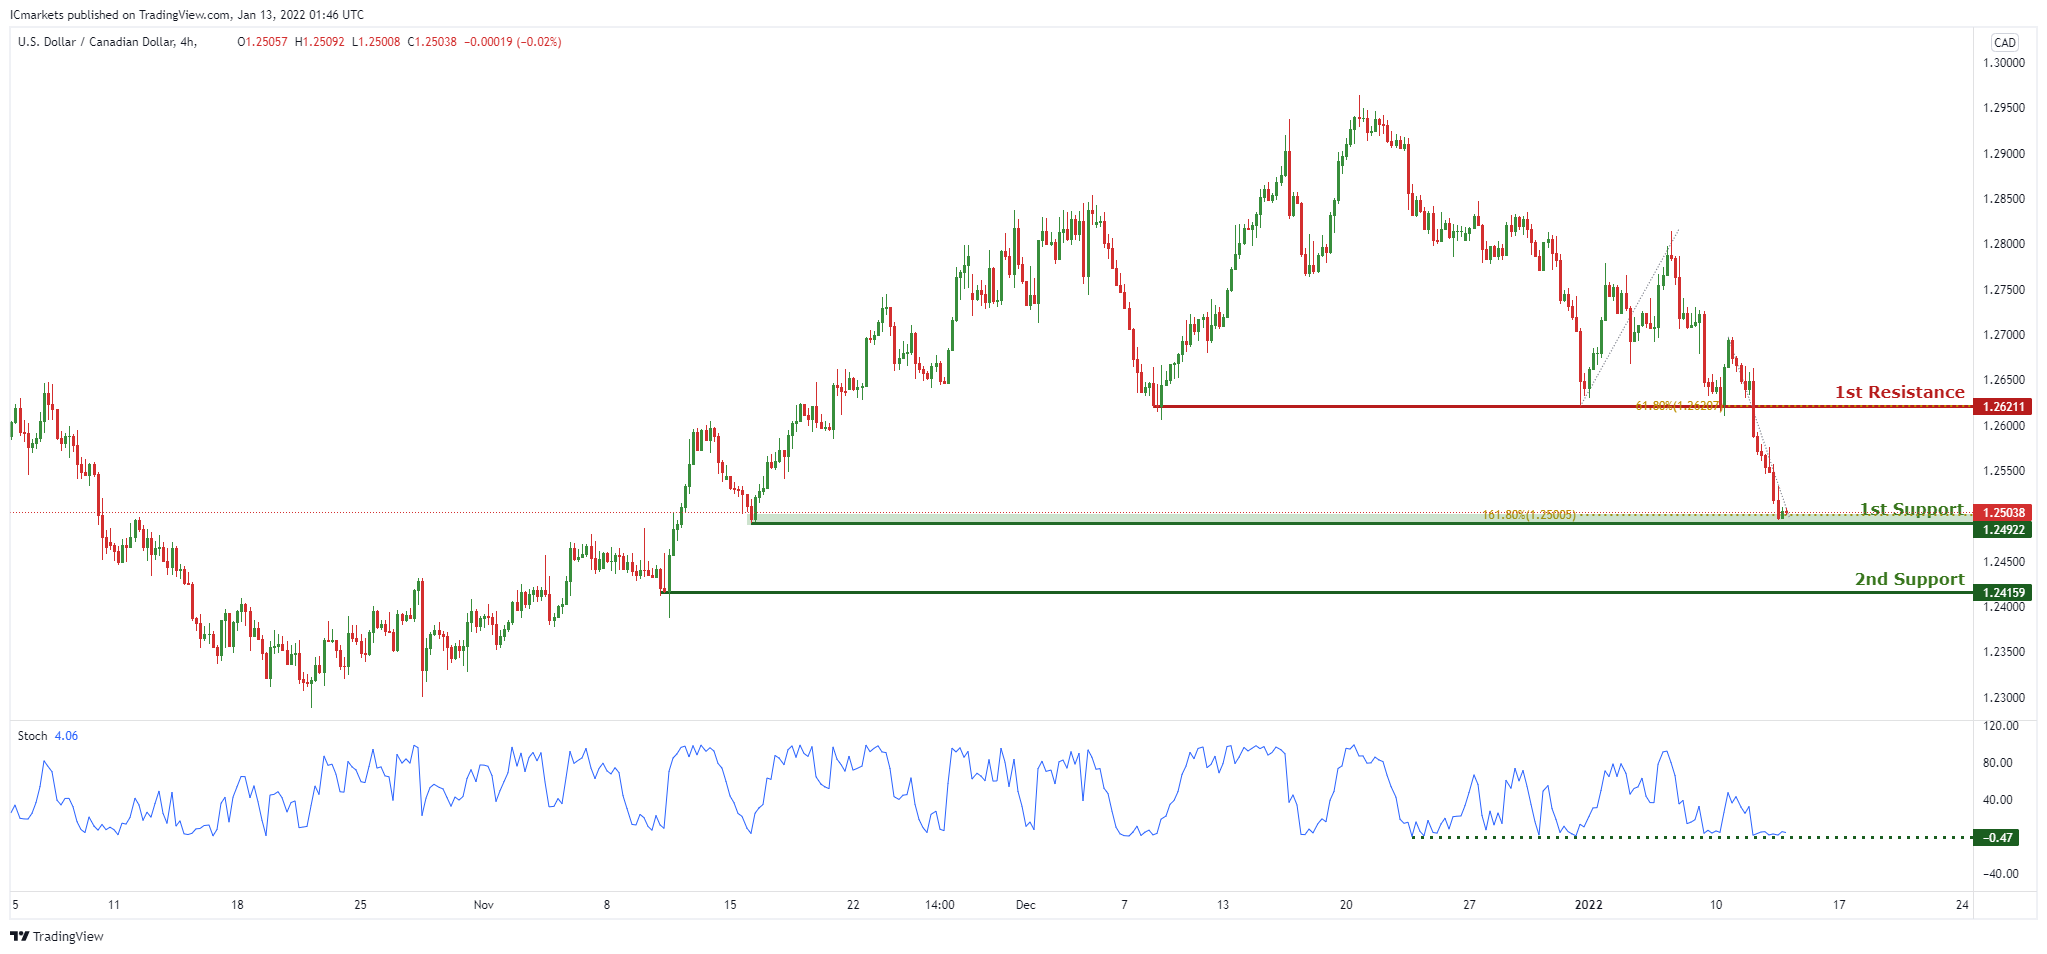
USD/CAD:
On the H4, with price at the support of the stochastics, we have a bullish bias that price will rise to our 1st resistance at 1.26211 which is in line with horizontal overlap resistance and 61.8% Fibonacci retracement from 1st support at 1.24922, which is in line with horizontal swing low support and 161.8% Fibonacci extension level. Alternatively, price may break 1st support structure and head for 2nd support at 1.24159, which coincides with horizontal swing low support.
Areas of consideration:
- H4 time frame, 1st support at 1.24922
- H4 time frame, 1st resistance at 1.26211
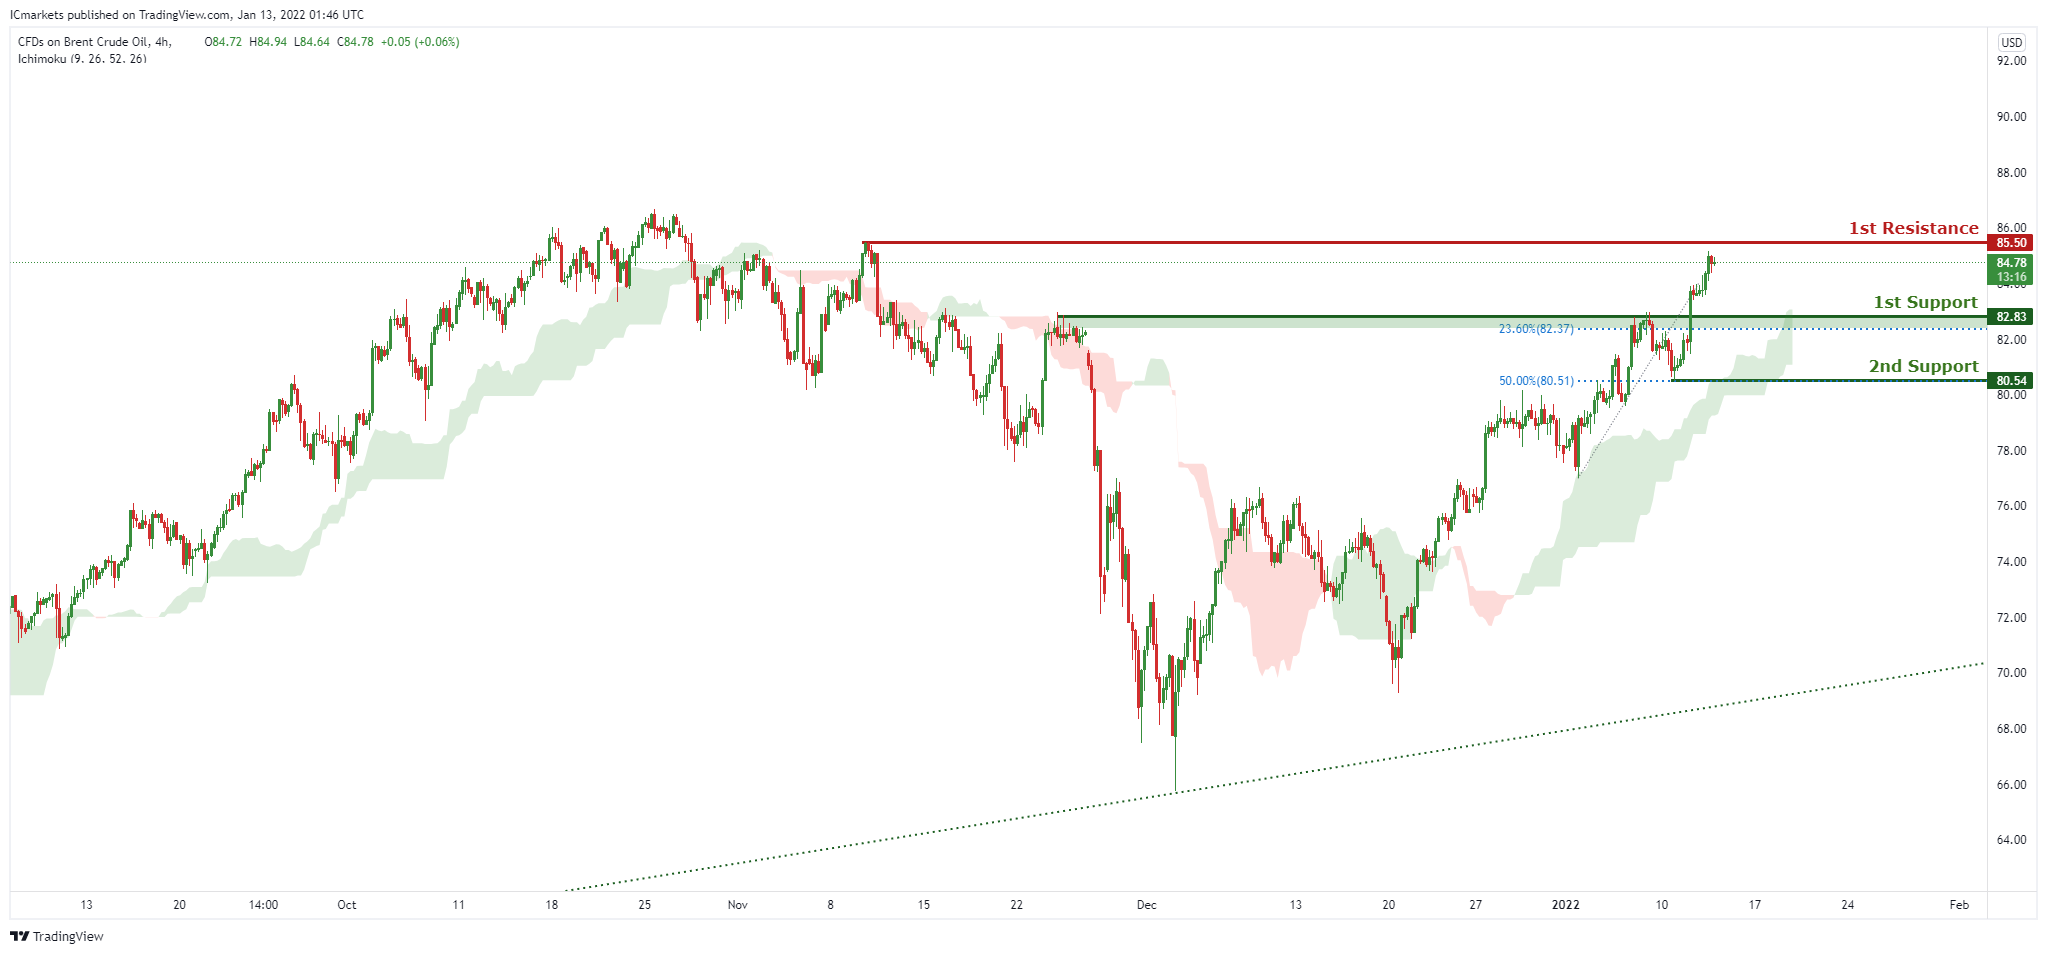
OIL:
On the H4, with price moving above the ichimoku cloud, we have a bullish bias that price will rise to our 1st resistance at 85.5 which is in line with horizontal swing high resistance from 1st support at 82.83, which is in line with horizontal overlap support and 23.6% Fibonacci retracement level. Alternatively, price may break 1st support structure and head for 2nd support at 80.54, which coincides with horizontal swing low support and 50% Fibonacci retracement level .
Areas of consideration:
- H4 time frame, 1st resistance of 85.5
- H4 time frame, 1st support of 82.83
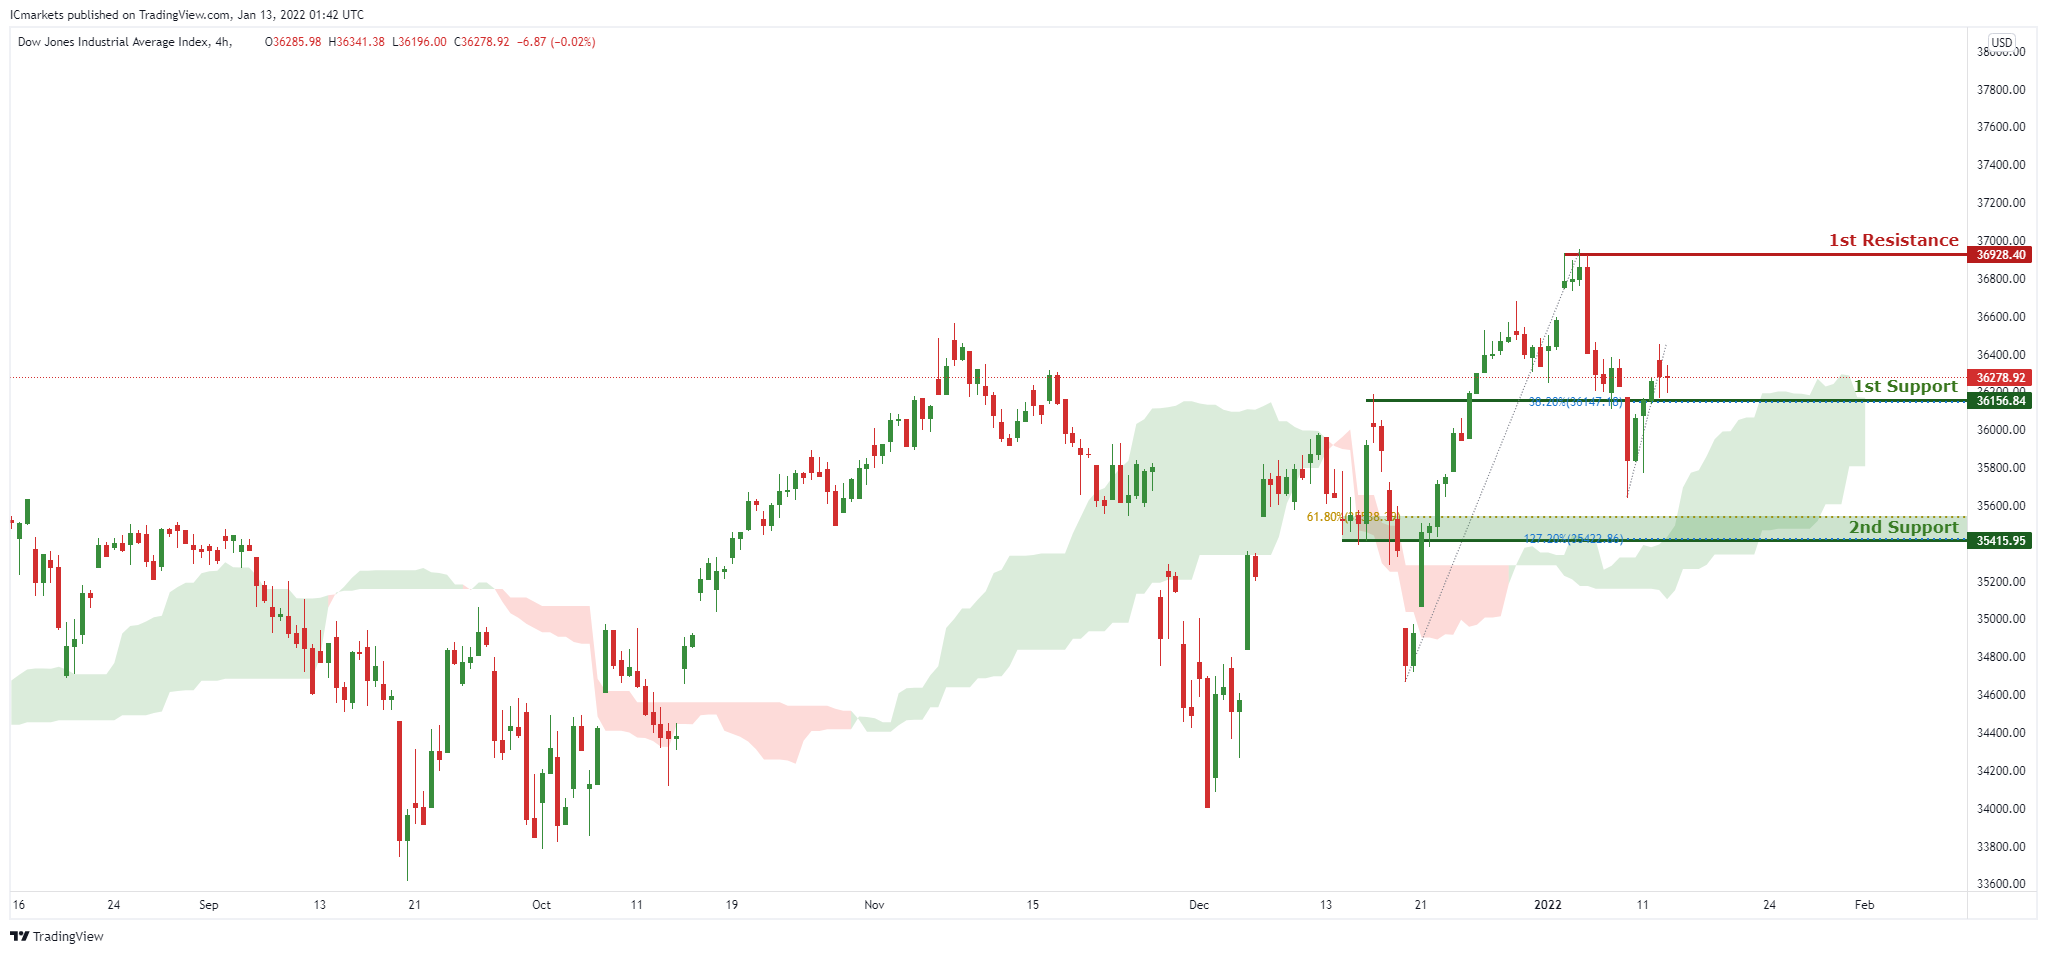
Dow Jones Industrial Average:
On the H4, with price moving above the ichimoku cloud, we have a bullish bias that price will rise to our 1st resistance at 36928 which is in line with horizontal swing high resistance from 1st support at 36156, which is in line with horizontal overlap support and 38.2% Fibonacci retracement level. Alternatively, price may break 1st support structure and head for 2nd support at 35415, which coincides with horizontal swing low support and 61.8% Fibonacci retracement level and 127.2% Fibonacci extension.
Areas of consideration:
- H4 time frame, 1st resistance of 36928
- H4 time frame, 1st support of 36156
The accuracy, completeness and timeliness of the information contained on this site cannot be guaranteed. IC Markets does not warranty, guarantee or make any representations, or assume any liability regarding financial results based on the use of the information in the site.
News, views, opinions, recommendations and other information obtained from sources outside of www.icmarkets.com.au, used in this site are believed to be reliable, but we cannot guarantee their accuracy or completeness. All such information is subject to change at any time without notice. IC Markets assumes no responsibility for the content of any linked site.
The fact that such links may exist does not indicate approval or endorsement of any material contained on any linked site. IC Markets is not liable for any harm caused by the transmission, through accessing the services or information on this site, of a computer virus, or other computer code or programming device that might be used to access, delete, damage, disable, disrupt or otherwise impede in any manner, the operation of the site or of any user’s software, hardware, data or property.


