
Key risk events today:
Australia Jobs Data; US Unemployment Claims.
(Previous analysis as well as outside sources – italics).
EUR/USD:
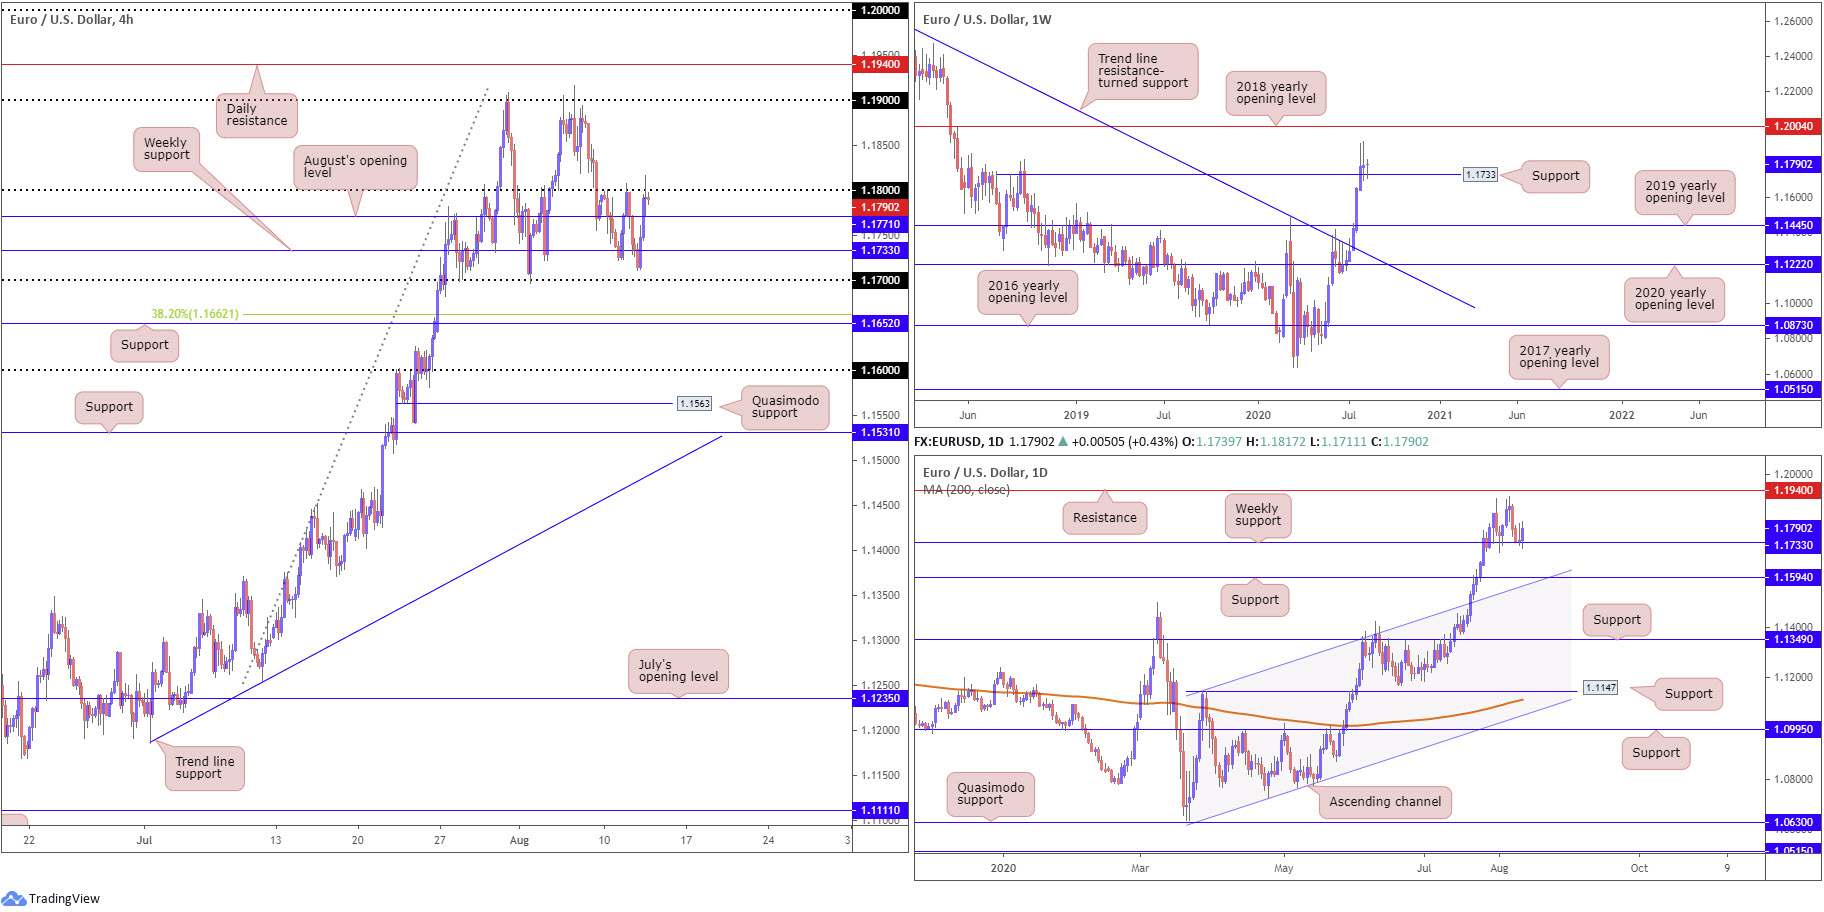
Fashioned by way of a daily bearish engulfing candle, the US dollar index snapped a three-day bullish phase Wednesday, despite stronger-than-anticipated US inflation data. This, as can be seen on the H4 timeframe on EUR/USD, prompted an advance off weekly support at 1.1733 (a prior Quasimodo resistance level) and ran through August’s opening level at 1.1771 to shake hands with the 1.18 handle.
Price action based on the weekly timeframe shows we recently struck a fresh 27-month peak at 1.1916. North of 1.1733, the 2018 yearly opening level at 1.2004 is seen as the next available resistance, whereas a dip to deeper water could have the pair tackle the 2019 yearly opening level at 1.1445.
A closer reading of price action on the daily timeframe also shows the weekly level at 1.1733 as a base for support. Yesterday’s advance also chalked up an outside daily candle off the current weekly support level. Resistance on the daily chart, however, can be seen parked at 1.1940, with a break largely exposing weekly resistance mentioned above at 1.2004 (2018 yearly opening level). Beyond 1.1733 (on the daily chart) could draw attention to daily support at 1.1594, a level closely connected with channel resistance-turned support, taken from the high 1.1147.
Areas of consideration:
The break of weekly trend line resistance (July 13), taken from the high 1.2555, and violation of the 1.1495 March 9 high, reflects a long-term (potential) technical trend change.
For those who read Wednesday’s technical briefing may recall the following (italics):
Despite the pullback from 1.18, buyers still hold a strong hand in this fight, in light of the weekly timeframe’s technical position. Therefore, either an additional 1.1733 retest is likely in store, or a H4 close may take shape north of 1.18, both of which could be interpreted as a bullish signal, targeting at least 1.19, then daily resistance at 1.1940 and possibly weekly resistance at 1.2004.
With 1.18 now being challenged as resistance, following yesterday’s rotation off 1.1733 weekly support, those long this market have likely reduced risk to breakeven and banked partial profits. Traders who missed the 1.1733 test (and those currently long) are likely watching for a H4 close above 1.18 to form, in favour of further gains to the above noted targets (bold).
GBP/USD:
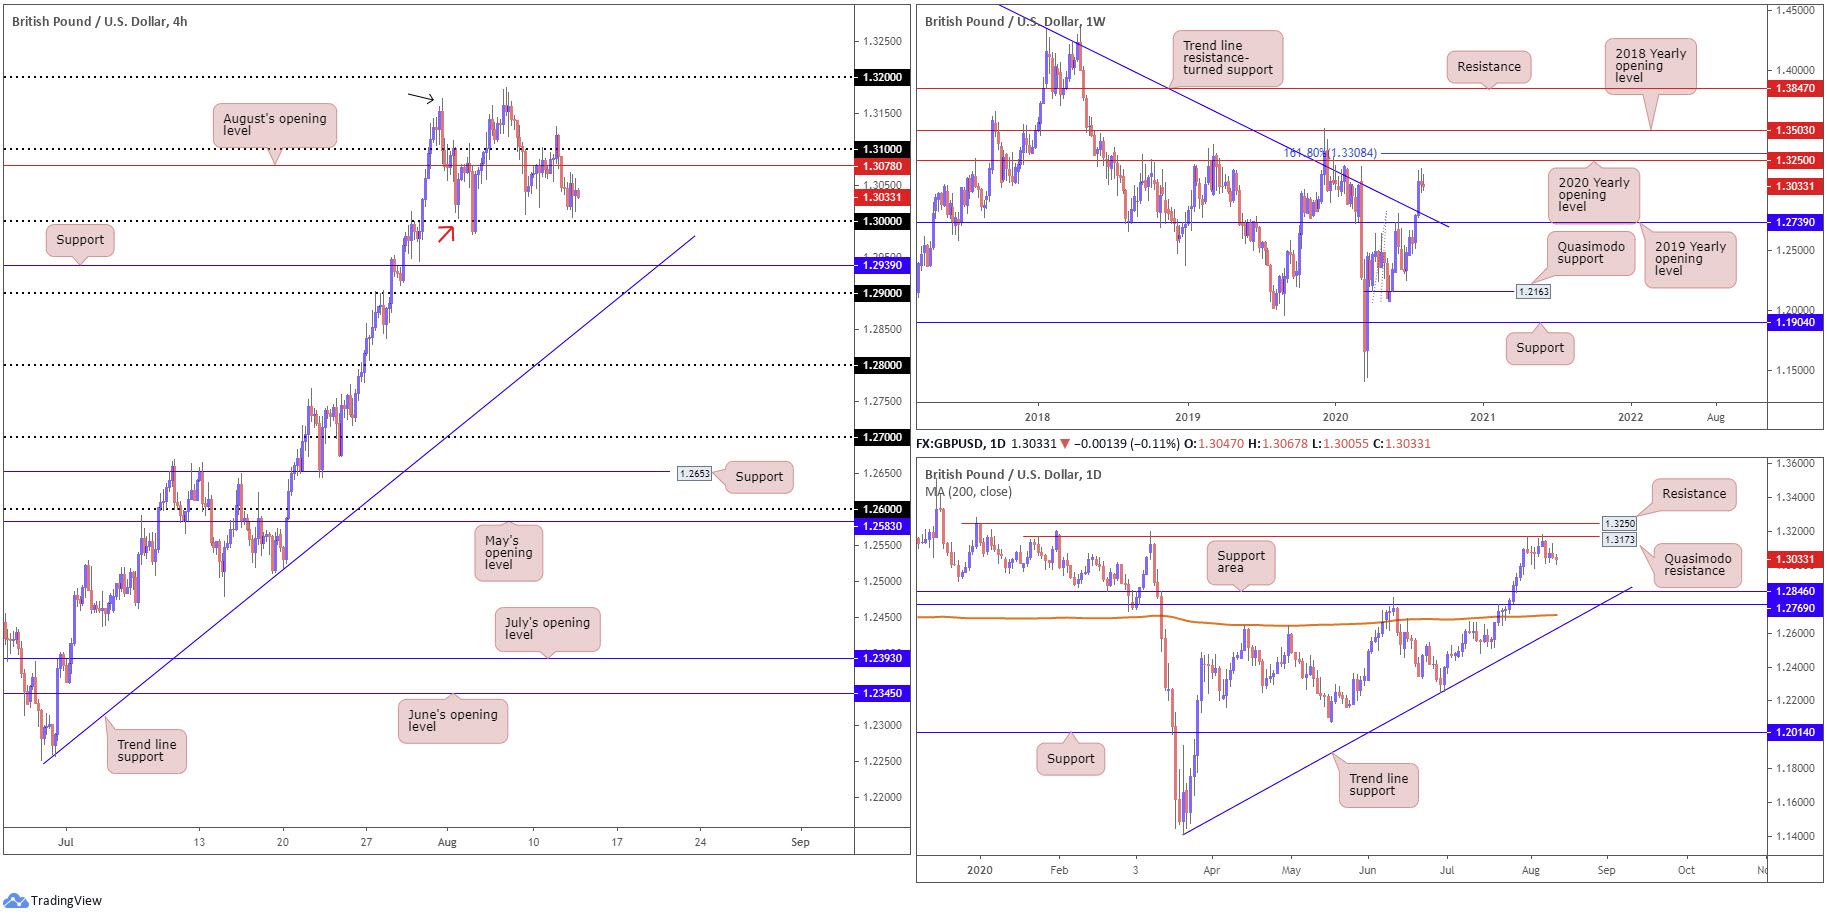
The British pound maintained a mild bearish presence against the US dollar Wednesday, failing to glean much impetus from better-than-expected UK growth data. GBP/USD, based on the H4 timeframe, is seen floating north of the 1.30 key figure, a level boasting a connection with a Quasimodo support left shoulder (red arrow – 1.3004). A pop higher, on the other hand, will likely have H4 knock on the door of August’s opening level at 1.3078, followed closely by 1.31.
Beyond 1.30, traders’ crosshairs are likely fixed on support listed at 1.2939 and then the 1.29 handle. Above 1.31, traders may be watching the left shoulder (black arrow) at 1.3170 to provide resistance, though most will be eyeing 1.32.
The recent trend line resistance break on the weekly timeframe (1.5930), despite the 1.3514 December 9 high (2019) still intact (a break of here also signals trend change to the upside), may have long-term traders consider bullish positions. Resistance can be seen by way of the 2020 yearly opening level at 1.3250, closely tailed by a 161.8% Fibonacci extension point at 1.3308. Leaving said resistances unchallenged and retreating south could call for a retest at the 2019 yearly opening level drawn from 1.2739 (dovetails closely with the recently broken trend line).
Daily Quasimodo resistance at 1.3173 entered the fold last week, a level situated south of 1.3250 daily resistance. Interestingly, the latter shares the same space with resistance on the weekly timeframe, the 2020 yearly opening level. An extension to the downside may have a support area between 1.2769/1.2846 nudge its way into focus, positioned ahead of the 200-day SMA (orange – 1.2707) and trend line support, taken from the low 1.1409.
Areas of consideration:
Outlook pretty much unchanged due to limited movement Wednesday.
Although weekly price indicates a shift to 1.3250ish, daily action remains capped by Quasimodo resistance at 1.3173, threatening moves as far south as 1.2769/1.2846.
Against the backdrop of higher timeframe activity, the 1.30 figure on the H4 timeframe presents robust support to keep a tab on, knowing the level joins with Quasimodo support at 1.3004. Consequently, buyers could make a stand from this region and attempt a recovery.
A decisive breakout north of 1.31 will equally likely arouse the interest of buyers, particularly those favouring breakout strategies. Upside targets fall in at daily resistance from 1.3173, followed by 1.32 on the H4.
AUD/USD:
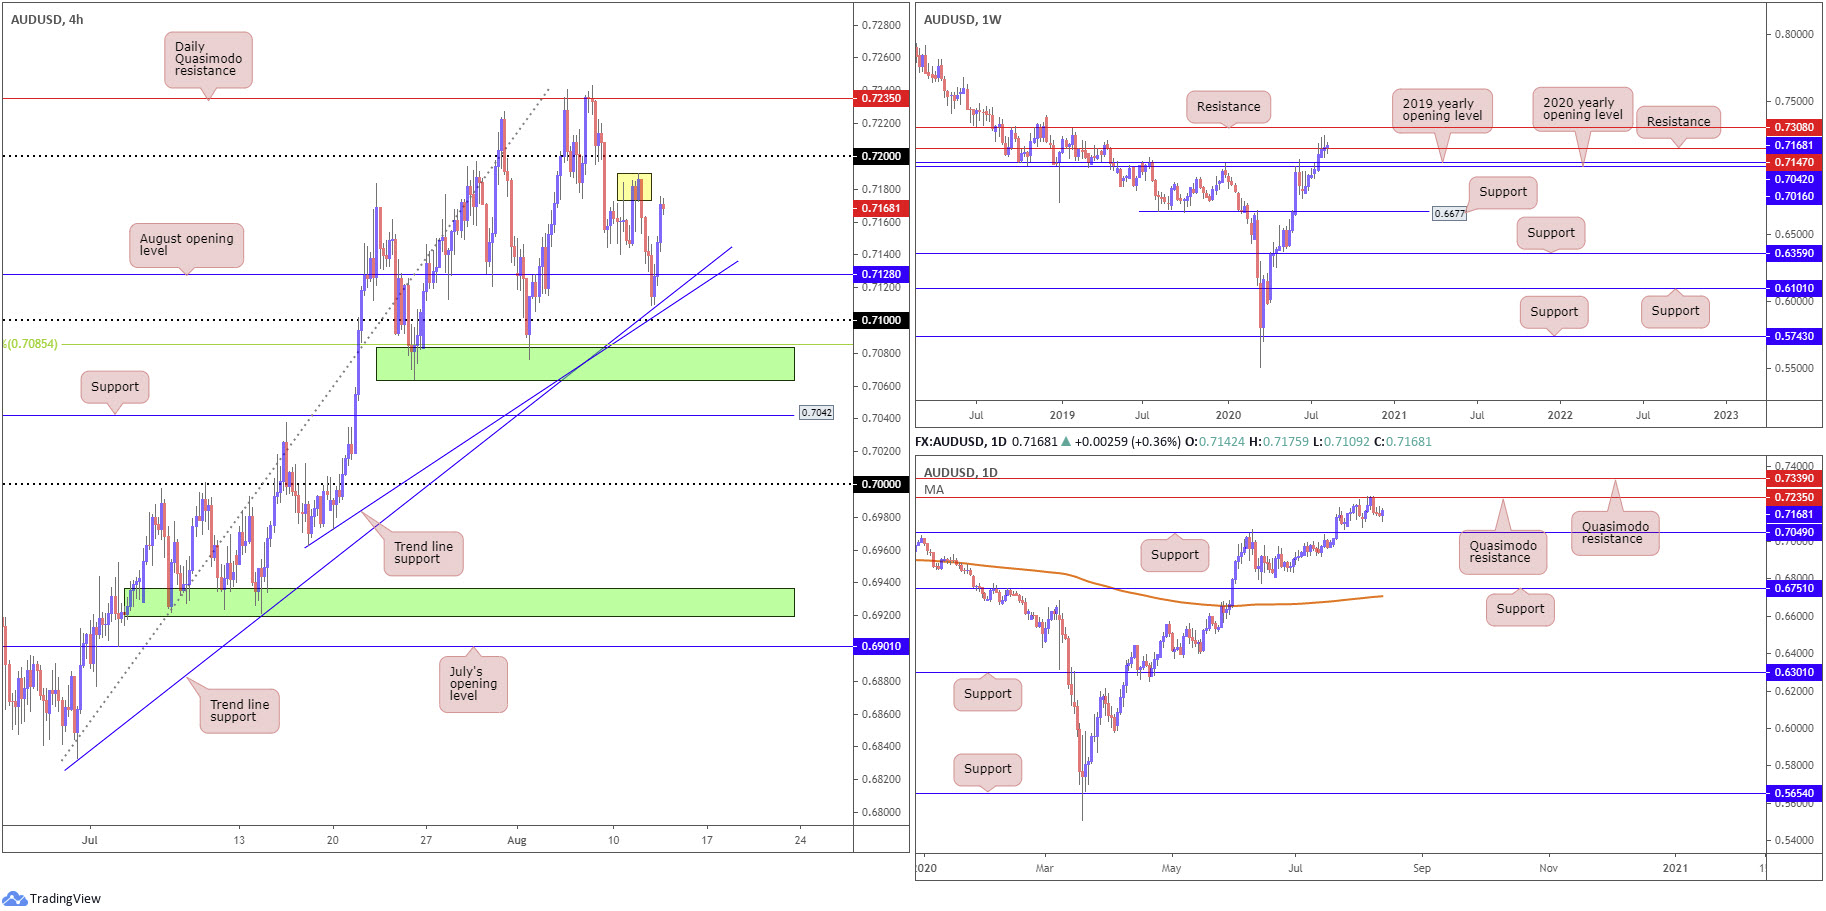
The Australian dollar recovered in response to a weaker greenback Wednesday, erasing losses seen earlier this week.
H4 whipsawed beneath August’s opening level at 0.7128 and came within shouting distance of testing two trend line supports taken from the low 0.6963 and 0.6832, before staging a strong recovery. Mild supply is seen around 0.7189-0.7172, with a break exposing any offers residing at 0.72 and possibly daily resistance at 0.7235.
Weekly movement remains pretty much stationery right now, therefore recent analysis remains valid heading into Thursday’s session:
Buyers and sellers continue to battle for position around weekly resistance at 0.7147, consequently ending recent trade considerably off best levels. As a result, upside momentum has been diminishing in recent weeks, underscoring the possibility of a retreat to the 2020 and 2019 yearly opening levels at 0.7016 and 0.7042, respectively. Conversely, assuming 0.7147 snaps, resistance at 0.7308 is likely to make an appearance this week.
Technical structure based on the daily timeframe has Quasimodo resistance at 0.7235 in sight, a level that impacted price action last Friday, and support coming in by way of 0.7049. Given the current uptrend (present since March), prudent traders will also acknowledge the likelihood of eventually reaching higher and perhaps crossing swords with Quasimodo resistance at 0.7339.
Areas of consideration:
The H4 bullish response was reasonably dominant yesterday, fuelling the possibility of drawing in the 0.72 handle/daily resistance at 0.7235 today.
Intraday breakout buyers, therefore, may watch for a violation of 0.72 today to run for daily resistance at 0.7235. At the same time, a pullback to retest August’s opening level at 0.7128 could also be on the cards and appeal to dip-buyers.
USD/JPY:
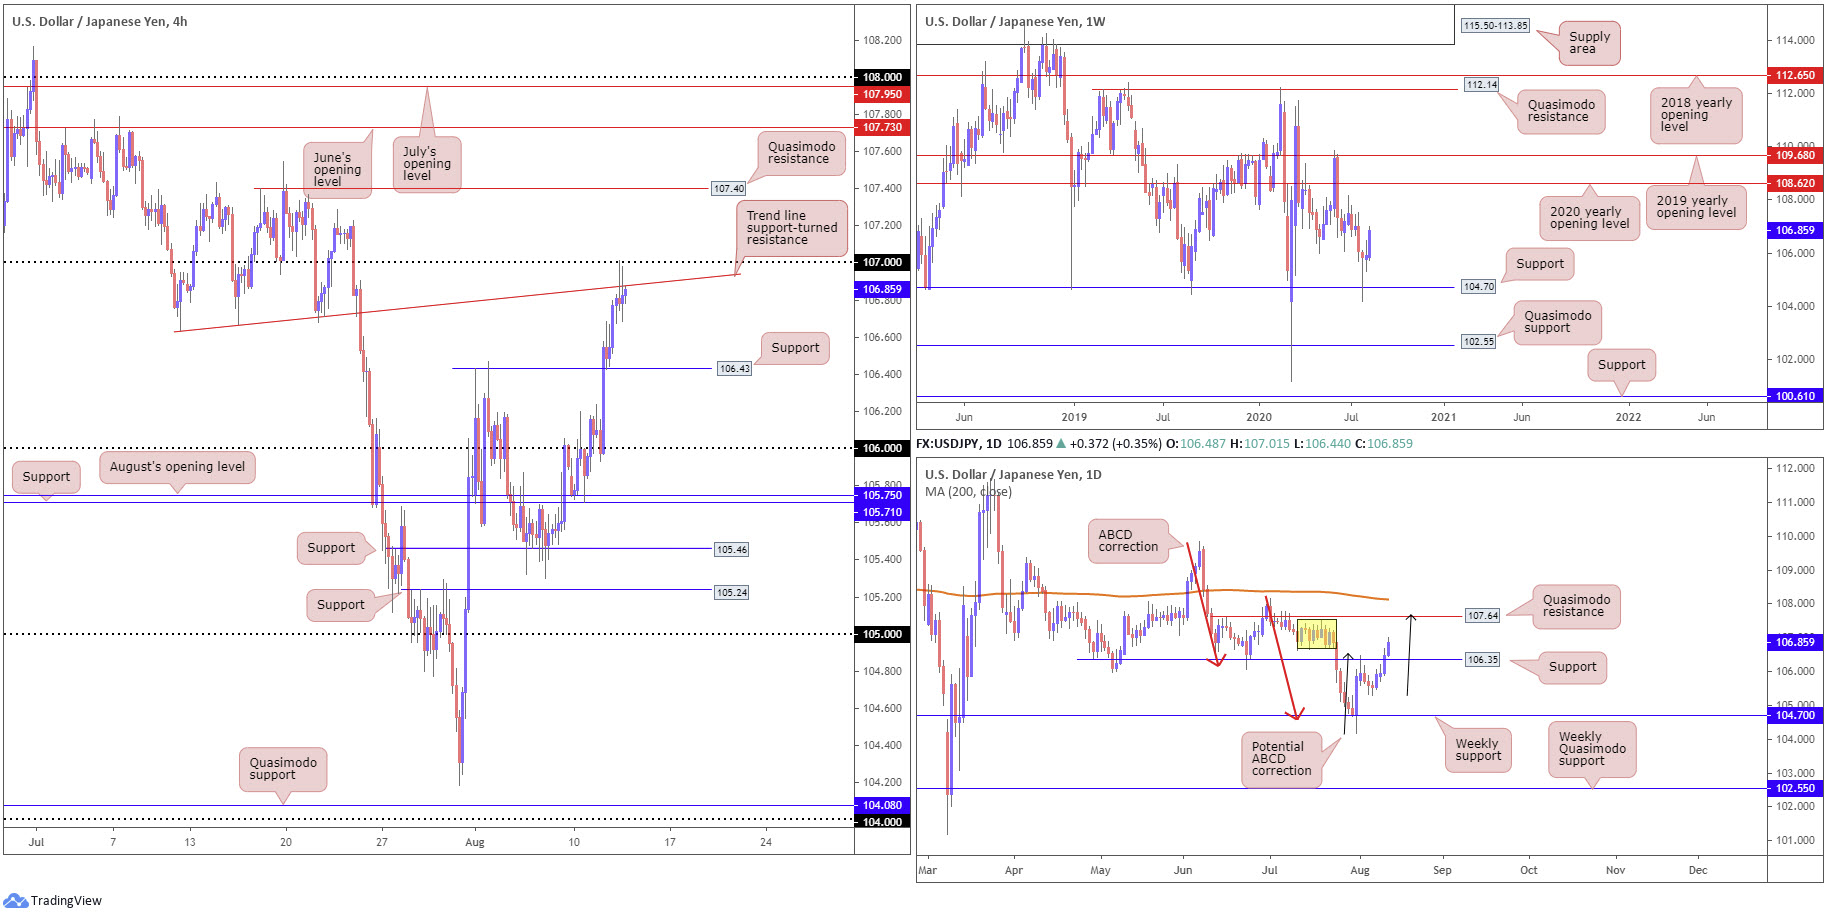
Following a short-lived retest at 106.43 support on the H4 timeframe (a prior Quasimodo resistance level), USD/JPY continued to gain traction Wednesday as upbeat risk sentiment decreased demand for the safe-haven Japanese yen. Recording a fourth consecutive daily advance, H4 action surpassed trend line support-turned resistance, taken from the low 106.63, and tested 107 to the pip.
Longer-term traders finally responded to the recent hammer pattern on the weekly timeframe, established off support at 104.70. By and of itself, this is a strong bullish signal, with obvious upside targets resting as far north as the 2020 yearly opening level from 108.62 and the 2019 yearly opening level at 109.68.
The daily timeframe shows price action recently made its way above resistance at 106.35 (a prior Quasimodo support). Ousting 106.35 was high probability (as pointed out in recent analysis), not only because of where the unit trades from on the weekly timeframe, but also due to the lacklustre (bearish) response from 106.35. Above the latter, we now have supply to contend with at 107.54-106.67 (yellow), as well as Quasimodo resistance coming in at 107.64. Also worth acknowledging is the prospect of establishing an ABCD bearish correction (black arrows) that conveniently terminates around 107.64.
Areas of consideration:
Governed by the weekly timeframe’s current position, longer-term analysis suggests the possibility of additional gains materialising north of resistance at 106.35 (now a serving support) on the daily timeframe.
The retest at the underside of 107 as resistance (and nearby H4 trend line resistance) has likely attracted profit taking, therefore the downside move here is unlikely to deliver much. Taking into consideration where we trade on the bigger picture, a H4 close above 107 could take shape. This could ignite bullish scenarios today, targeting H4 Quasimodo resistance at 107.40, followed by daily resistance at 107.64.
USD/CAD:
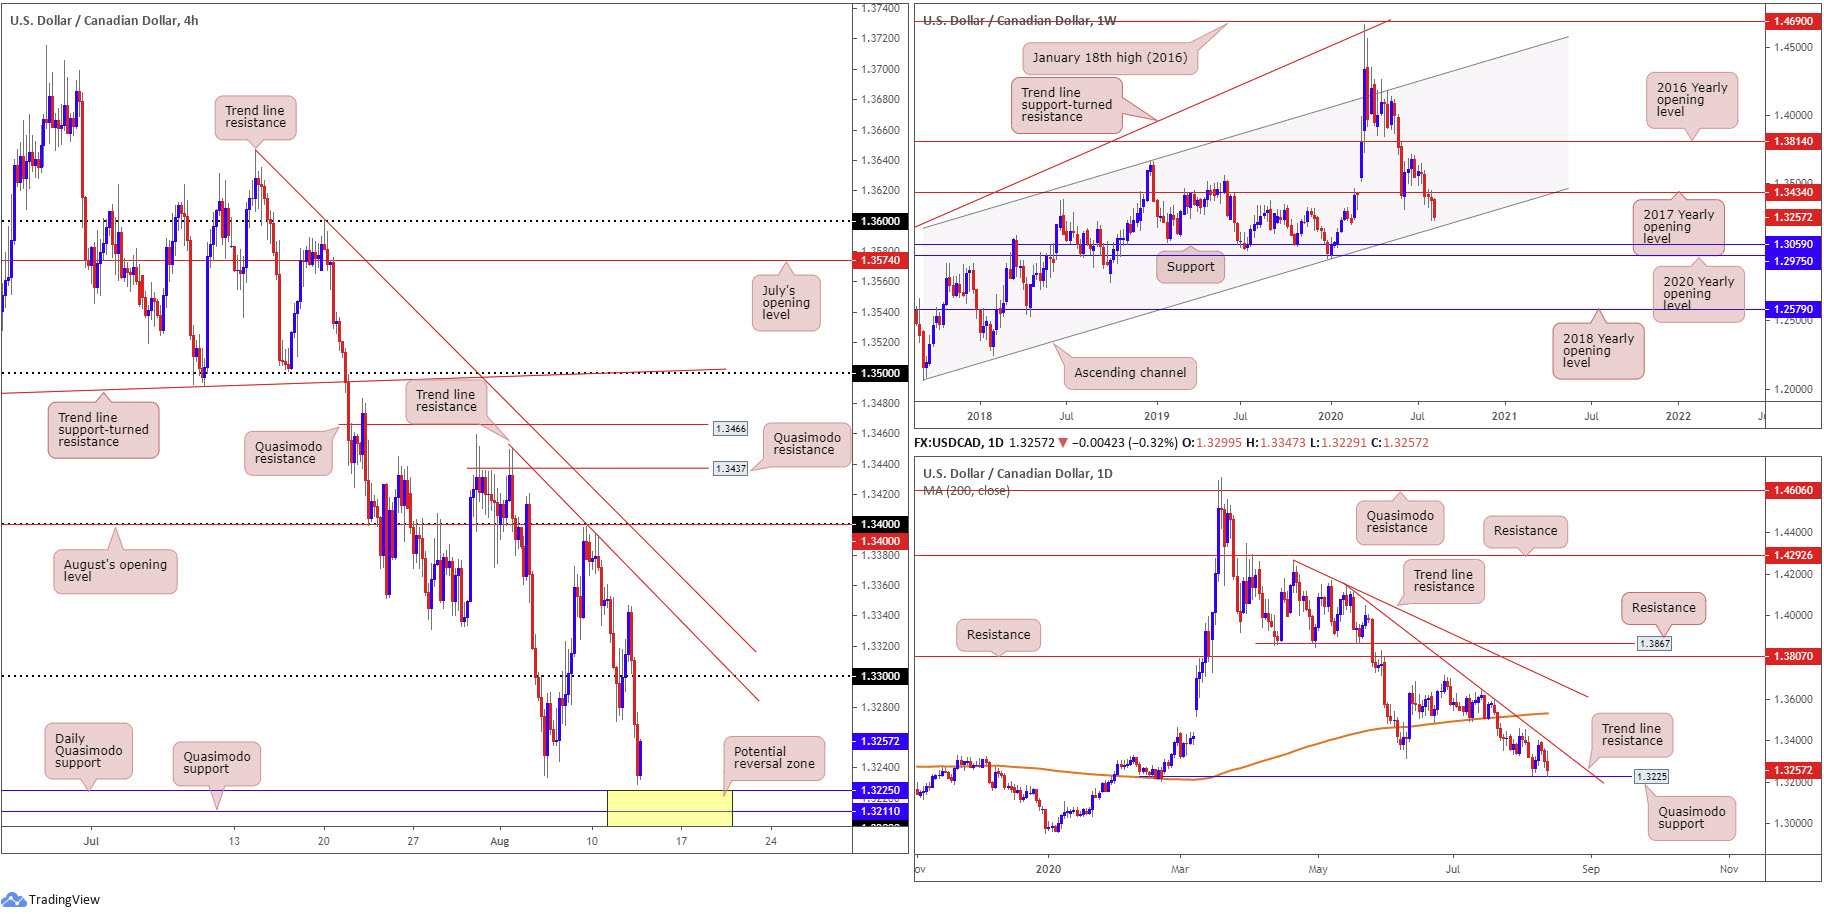
As WTI pounced above $42.50 a barrel and the US dollar index pencilled in a daily bearish engulfing candlestick pattern, USD/CAD ceded further ground Wednesday and recorded a third consecutive daily loss.
After clocking an early peak at 1.3347, H4 collapsed through 1.33 to draw in lows ahead of a daily Quasimodo support from 1.3225, stationed ahead of another Quasimodo support coming in at 1.3211.
July 22 witnessed a break of the 2017 yearly opening level at 1.3434 on the weekly timeframe, signalling channel support, taken from the low 1.2061, could enter the fight. In the event we continue for lower levels this week, we can expect the noted channel to make an appearance around the 1.32 region, situated just south of H4 Quasimodo support mentioned above at 1.3211.
Areas of consideration:
While the immediate downtrend is clearly in full force, technical structure between 1.32 and 1.3225 (yellow – made up of the 1.32 handle on the H4, H4 Quasimodo support at 1.3211, daily Quasimodo support at 1.3225 and weekly channel support) puts up a reasonably dominant support zone, an area buyers may attempt to defend today.
USD/CHF:
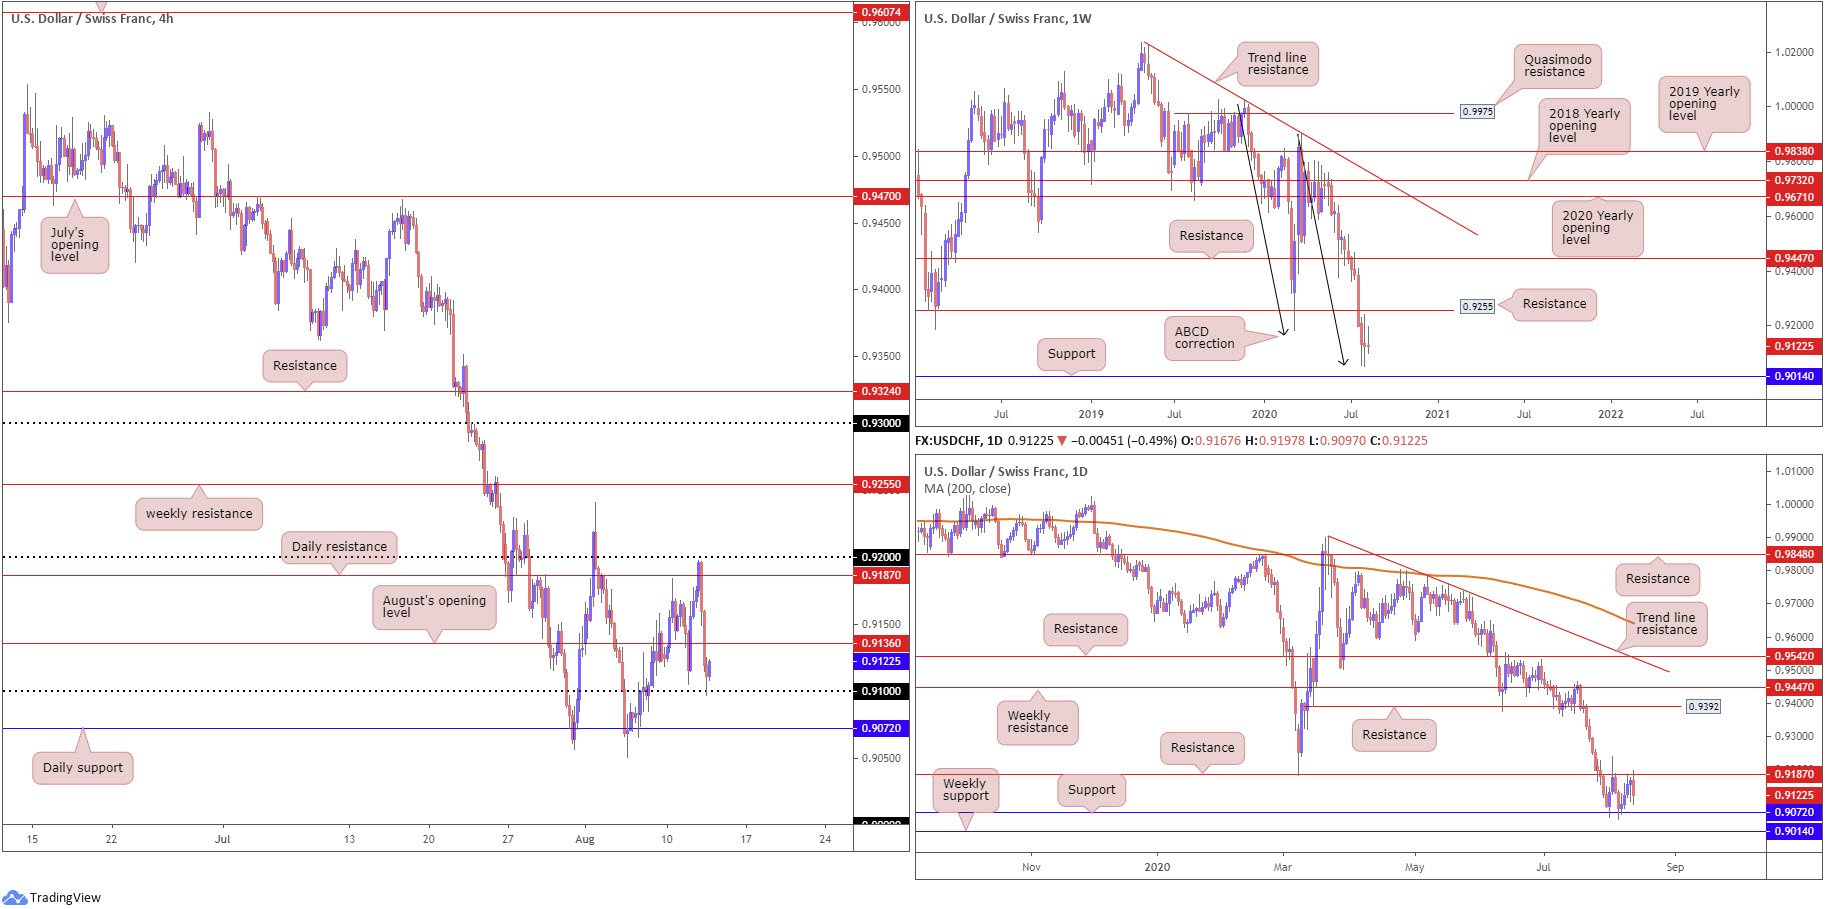
USD/CHF bears, as you can see, went on the offensive Wednesday, pressured by broad USD weakness. Early hours observed a mild breach of daily resistance at 0.9187, though price failed to challenge the nearby 0.92 handle on the H4 scale before rotating lower in strong fashion. Downside burrowed through August’s opening level at 0.9136 and mildly pared losses off the 0.91 base into the close.
From the daily timeframe, resistance mentioned above at 0.9187 generated enough interest to deliver a notable bearish outside day yesterday, snapping a four-day bullish phase. This swings support at 0.9072 back into the realm of possibility today, followed by weekly support positioned at 0.9014.
Meanwhile, on the weekly timeframe, we can see we recently come off a seven-week decline. Buyers and sellers, however, wrapped up last week’s action hesitantly, forming a long-legged doji candlestick pattern at an ABCD completion point (black arrows) around 0.9051. The doji suggests forces of supply and demand are possibly nearing equilibrium. Therefore, given we’re testing ABCD support, along with additional support present nearby at 0.9014, traders may interpret the recent indecision as a potential change of direction.
Areas of consideration:
While the underlying trend points southbound, weekly price recently crossing swords with an ABCD correction at 0.9051, in the shape of a long-legged doji candlestick pattern, implies a recovery may surface.
0.91 is clearly a support of interest at the moment, with H4 candles poised to retest 0.9136, August’s opening level. Breaking here will also likely witness renewed buying, in favour of retesting daily resistance at 0.9187.
Many technically-minded traders are also still possibly watching for 0.92 to give way as resistance; above here we have a relatively free run to weekly resistance plotted at 0.9255 (a prior Quasimodo support).
Dow Jones Industrial Average:
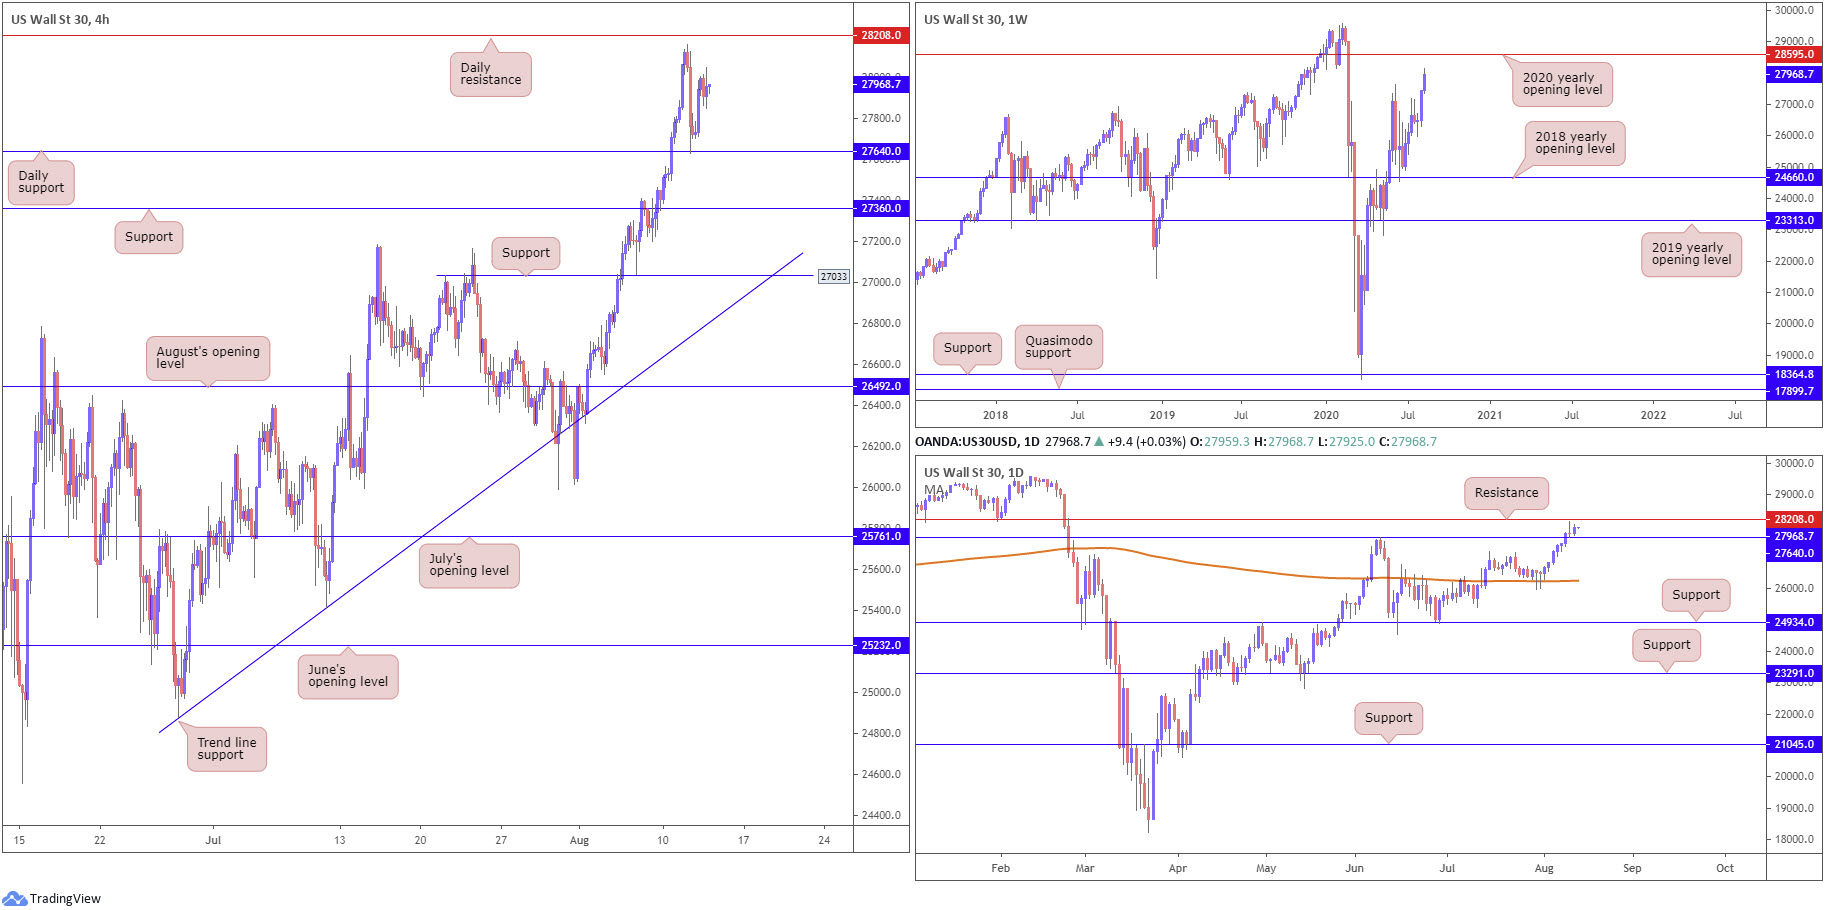
US equity benchmarks finished higher Wednesday, reinforced on the back of stronger-than-expected economic data. The Dow Jones Industrial Average advanced 289.93 points, or 1.05%; the S&P 500 climbed 46.66 points, or 1.40%, while the tech-heavy Nasdaq 100 concluded higher by 281.64 points, or 2.59%.
Noted as a possibility in yesterday’s analysis, H4 activity established position off daily support at 27640 Wednesday and closed a touch off session peaks. Technically speaking, price action is likely tipped to advance to at least daily resistance at 28208.
From the weekly timeframe, we recently secured ground above the 27638 high, following a mid-June retest at the 2018 yearly opening level from 24660. As we head into Thursday, the unit is now poised to make a run for the 2020 yearly opening level at 28595.
Areas of consideration:
Those who managed to secure a long entry from daily support at 27640 may have already reduced risk to breakeven. Most, however, will have the daily resistance at 28208 marked as a valid take-profit target, with a break likely pushing things towards weekly resistance at 28595, the 2020 yearly opening level.
XAU/USD (GOLD):
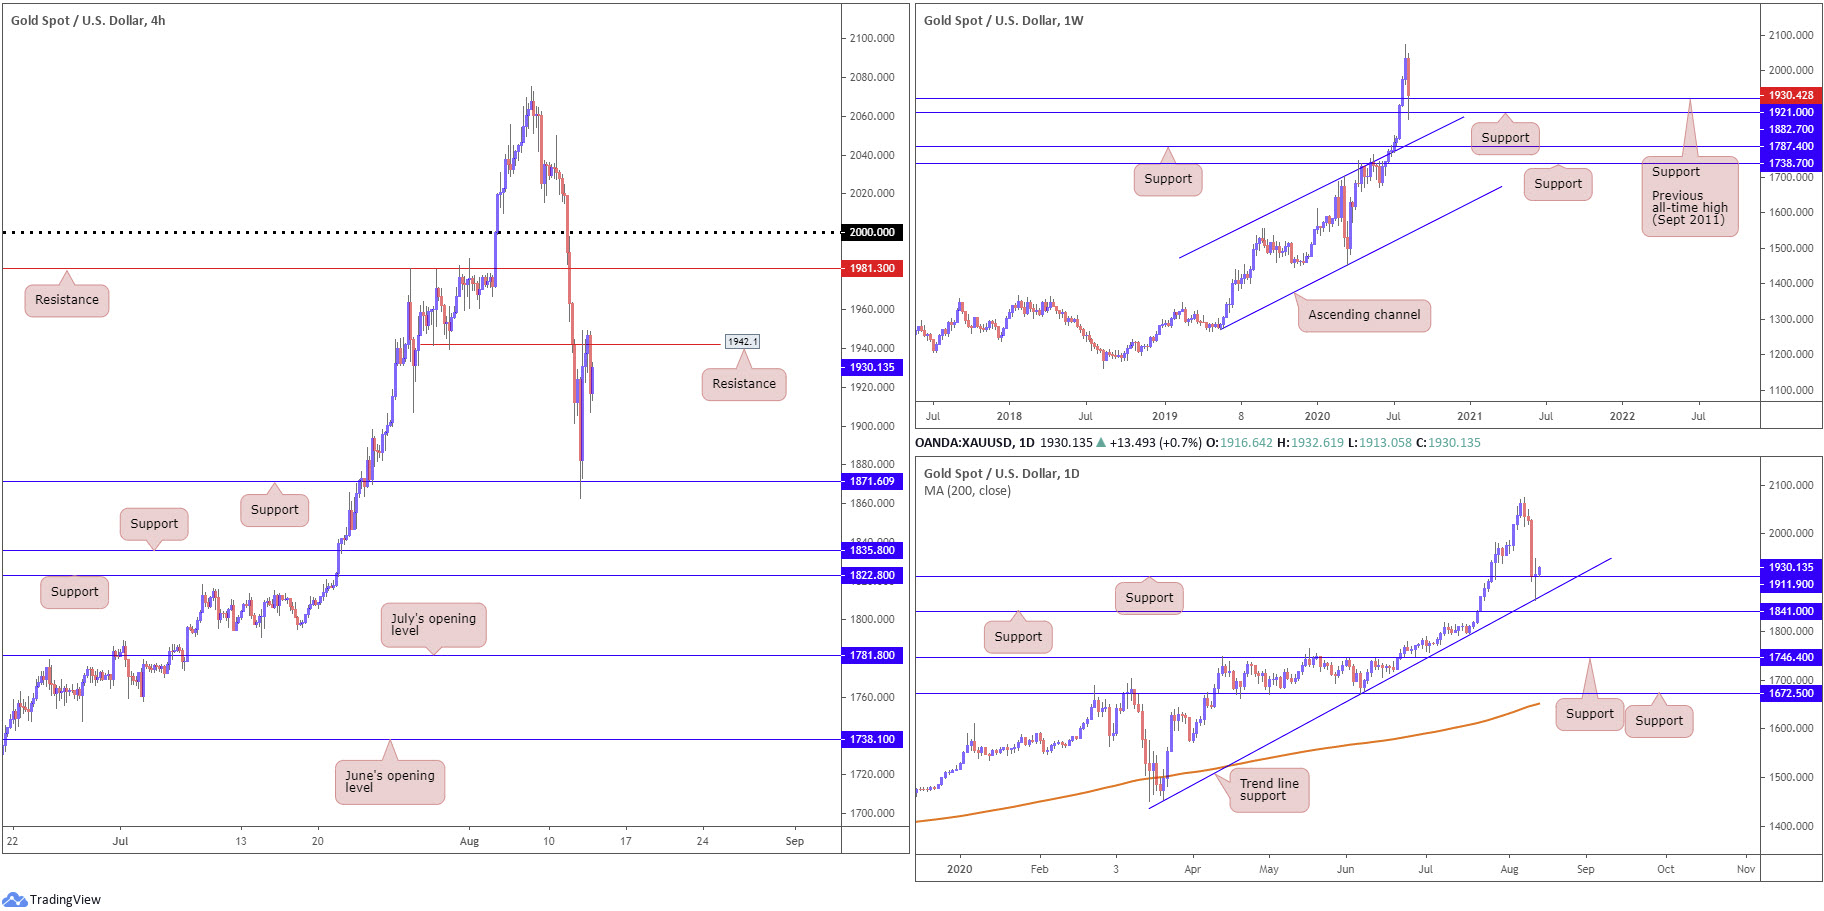
A day after recording its largest one-day loss in seven years, XAU/USD dipped to lows at $1,862.89 an ounce on Wednesday and challenged H4 support at $1,871.60. Price has since pulled itself to H4 resistance at $1,942.10, which, as you can see, had sellers defend the neighbourhood into the close.
Above current H4 resistance, traders will likely be eyeballing H4 resistance at $1,981.30, shadowed by the key figure $2,000.00, while under current support another layer of support is visible at $1,835.80.
With reference to the higher timeframes, we can see technical action retesting $1,921.00, the previous all-time high (September 2011), as well as weekly support coming in at $1,882.70. Additionally, traders will acknowledge daily price shaking hands with trend line support, extended from the low $1,455.32, along with converging support from $1,911.90.
Areas of consideration:
With weekly and daily support levels clearly in action, along with the trend in this market facing north since 2016, H4 resistance at $1,942.10 is unlikely to deliver much downside momentum. With that being the case, bullish themes could be in store today should we carry price through the aforementioned resistance, targeting H4 resistance at $1,981.30 as an initial take-profit zone, followed closely by the $2,000.00 mark.
The accuracy, completeness and timeliness of the information contained on this site cannot be guaranteed. IC Markets does not warranty, guarantee or make any representations, or assume any liability regarding financial results based on the use of the information in the site.
News, views, opinions, recommendations and other information obtained from sources outside of www.icmarkets.com.au, used in this site are believed to be reliable, but we cannot guarantee their accuracy or completeness. All such information is subject to change at any time without notice. IC Markets assumes no responsibility for the content of any linked site.
The fact that such links may exist does not indicate approval or endorsement of any material contained on any linked site. IC Markets is not liable for any harm caused by the transmission, through accessing the services or information on this site, of a computer virus, or other computer code or programming device that might be used to access, delete, damage, disable, disrupt or otherwise impede in any manner, the operation of the site or of any user’s software, hardware, data or property.


