
Waiting for lower timeframe confirmation is our main tool to confirm strength within higher timeframe zones, and has really been the key to our trading success. It takes a little time to understand the subtle nuances, however, as each trade is never the same, but once you master the rhythm so to speak, you will be saved from countless unnecessary losing trades. The following is a list of what we look for:
- A break/retest of supply or demand dependent on which way you’re trading.
- A trendline break/retest.
- Buying/selling tails/wicks – essentially we look for a cluster of very obvious spikes off of lower timeframe support and resistance levels within the higher timeframe zone.
We typically search for lower-timeframe confirmation between the M15 and H1 timeframes, since most of our higher-timeframe areas begin with the H4. Stops are usually placed 1-3 pips beyond confirming structures.
EUR/USD:
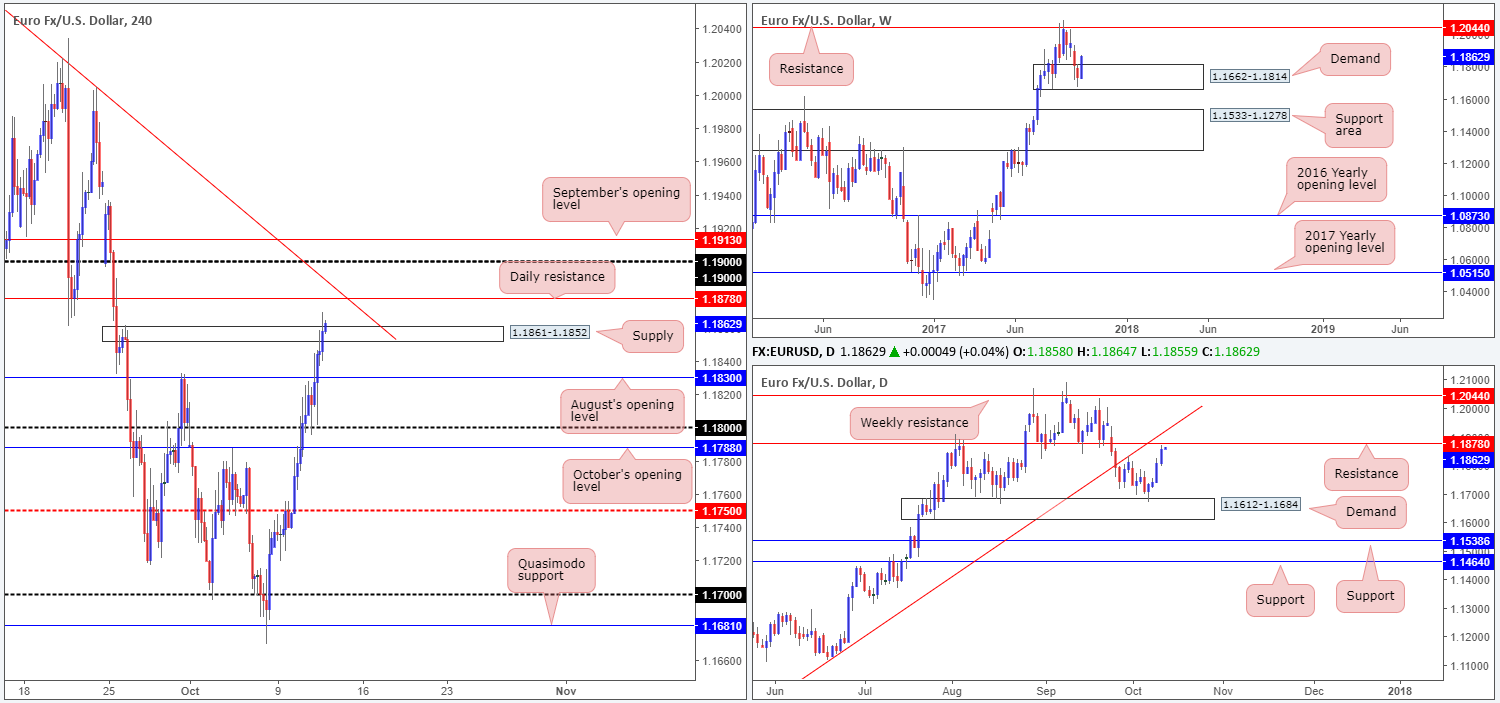
The single currency gathered momentum following the release of September’s FOMC meeting minutes. H4 supply at 1.1861-1.1852, as you can see, came under attack. Stop-loss orders sited above the zone’s edge have likely been filled, possibly opening up space for the pair to extend higher.
In spite of this, trouble may be ahead! Less than 20 pips above the noted H4 supply is a daily resistance level at 1.1878. Not only does this line boast strong history, it also intersects with a H4 trendline resistance taken from the high 1.2092 and a daily trendline resistance drawn from the low 1.0839.
Suggestions: A sell from the daily resistance level is appealing. However, traders may want to take into account that weekly price is trading strongly from a demand base coming in at 1.1662-1.1814. Should you still be interested in a sell from the aforementioned daily level, we would strongly advise waiting for additional candle confirmation to form before pulling the trigger (a full or near-full-bodied bearish candle would be ideal).
Data points to consider: ECB President Draghi speaks at 3.30pm; US PPI m/m and US weekly unemployment claims at 1.30pm; FOMC members Brainard and Powell take to the stage at 3.30pm GMT+1.
Levels to watch/live orders:
- Buys: Flat (stop loss: N/A).
- Sells: 1.1878 region ([waiting for a reasonably sized H4 bearish candle to form – preferably a full, or near-full-bodied candle – is advised] stop loss: ideally beyond the candle’s wick).
GBP/USD:
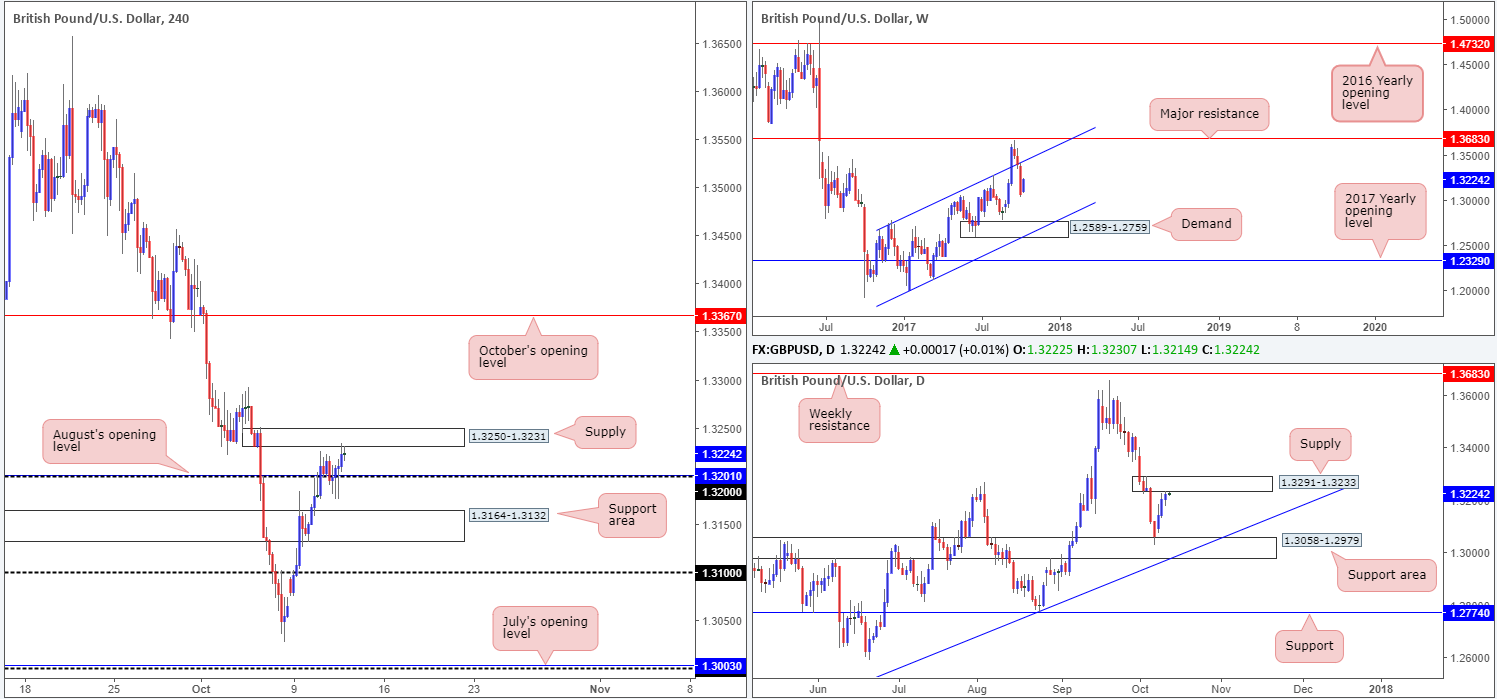
Despite several attempts to break back below the 1.32 handle, the British pound ended the day clocking a fresh high. After the latest round of FOMC meeting minutes, H4 price crossed swords with a nearby supply marked at 1.3250-1.3231, which happens to be positioned within the lower limits of a daily supply coming in at 1.3291-1.3233. Given that both aforesaid supplies demonstrate strength (check out the bearish momentum from the bases), the team remains wary of the nearby 1.32 level, as a sell from current price offers less than 30 pips of free space.
Placing stops above the H4 supply is an option and would allow you to record reasonable risk/reward should price halt at 1.32. However, at the same time, you open yourself up to a potential fakeout since daily price may want to test the upper edge of its supply!
Suggestions: On account of the above information, and the fact that weekly price shows room to trade as far south as demand at 1.2589-1.2759, we have taken a SMALL short position @ 1.3228 with a stop-loss order set at 1.3252 (24 pips). We’ll look to reduce risk to breakeven if/when price connects with 1.32 and also consider taking some profit off the table.
Data points to consider: US PPI m/m and US weekly unemployment claims at 1.30pm; FOMC members Brainard and Powell take to the stage at 3.30pm GMT+1.
Levels to watch/live orders:
- Buys: Flat (stop loss: N/A).
- Sells: 1.3228 ([live] stop loss: 1.3252).
AUD/USD:
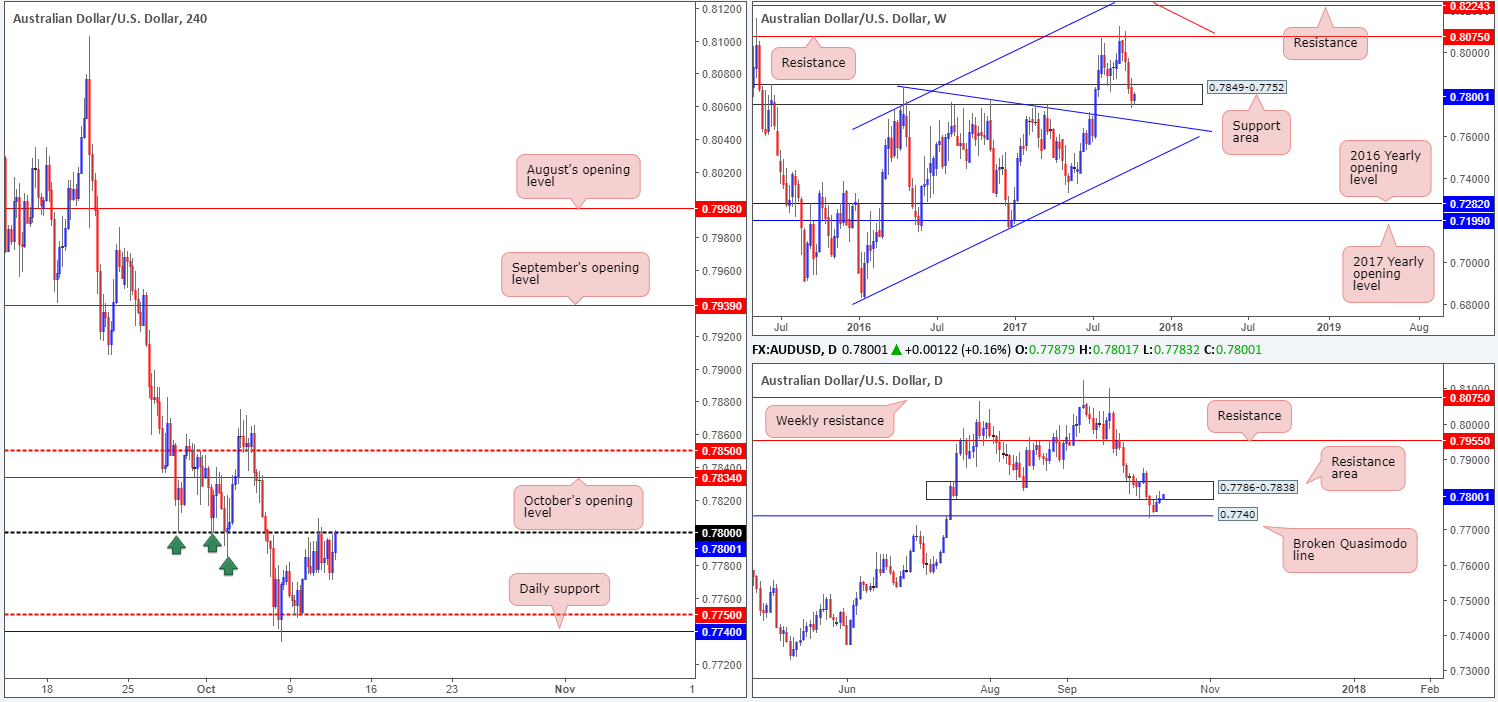
In recent trading, upward momentum has been capped by the 0.78 handle. This, technically speaking, should not really come as much of a surprise, considering that the psychological number boasted strong support at the beginning of the month (see green arrows) and is located within the lower limits of a daily resistance area at 0.7786-0.7838.
Eventually though, we do anticipate a break of the round number. This is largely due to where weekly price is currently trading from: a support area pegged at 0.7849-0.7752. To our way of seeing things, however, a break above 0.78 is not a breakout buy signal. Why? Well, apart from the fact that a long above 0.78 would entail buying into a daily resistance area, there’s also October’s opening level sitting nearby at 0.7834 to take into consideration. Not exactly ideal buying conditions.
Suggestions: Based on the weekly timeframe showing some promise from the noted support area, and daily/H4 price trading beneath/nearby resistances, we still believe that neither a long nor short is attractive at the moment.
Data points to consider: US PPI m/m and US weekly unemployment claims at 1.30pm; FOMC members Brainard and Powell take to the stage at 3.30pm GMT+1.
Levels to watch/live orders:
- Buys: Flat (stop loss: N/A).
- Sells: Flat (stop loss: N/A).
USD/JPY:
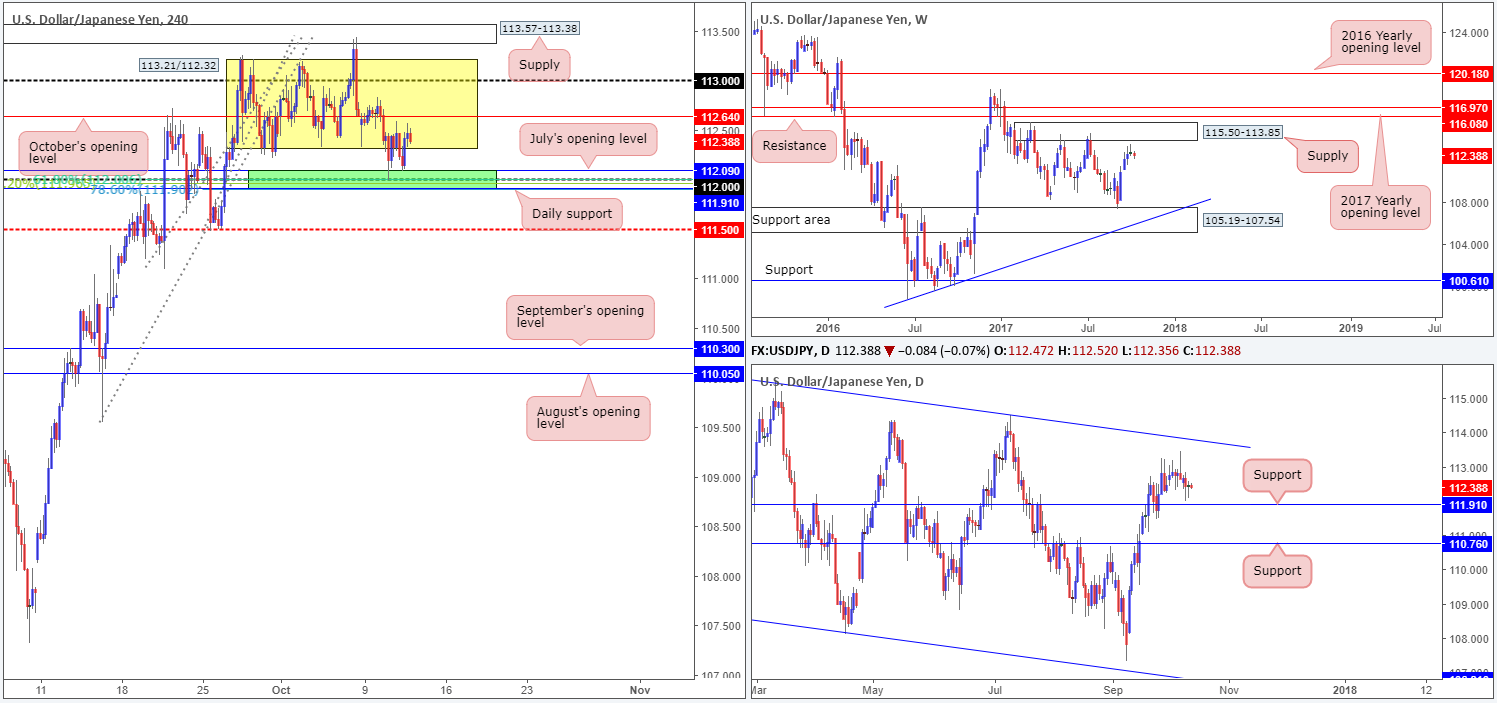
The USD/JPY remains well-bid above our noted H4 buy zone (green) at 111.91-112.09. For those who have been following our reports over the past week you may recall we have been focused on the 112 handle for quite a while now. Here’s why:
- Positioned directly above daily support at 111.91.
- Located just below July’s opening level at 112.09.
- Sited nearby a Fibonacci cluster comprised of a 38.2% support at 111.96 taken from the low 109.54, a 61.8% support at 112 from the low 111.09 and a 78.6% support at 111.90 drawn from the low 111.47.
- The stop-loss orders planted below the range edge at 112.32 (see yellow box). When these stops are triggered they (along with breakout sellers’ orders) become sell orders and thus help provide traders with deep pockets the liquidity required to buy.
Well done to any of our readers who are still long this market. The first take-profit target, in our view, can be seen at October’s opening level at 112.64, followed by the 113 handle. Stop-loss orders, however, should be a breakeven now.
Suggestions: Apart from our recent call to buy 112, we do not see much else to hang our hat on at the moment.
Data points to consider: US PPI m/m and US weekly unemployment claims at 1.30pm; FOMC members Brainard and Powell take to the stage at 3.30pm GMT+1.
Levels to watch/live orders:
- Buys: Flat (stop loss: N/A).
- Sells: Flat (stop loss: N/A).
USD/CAD:
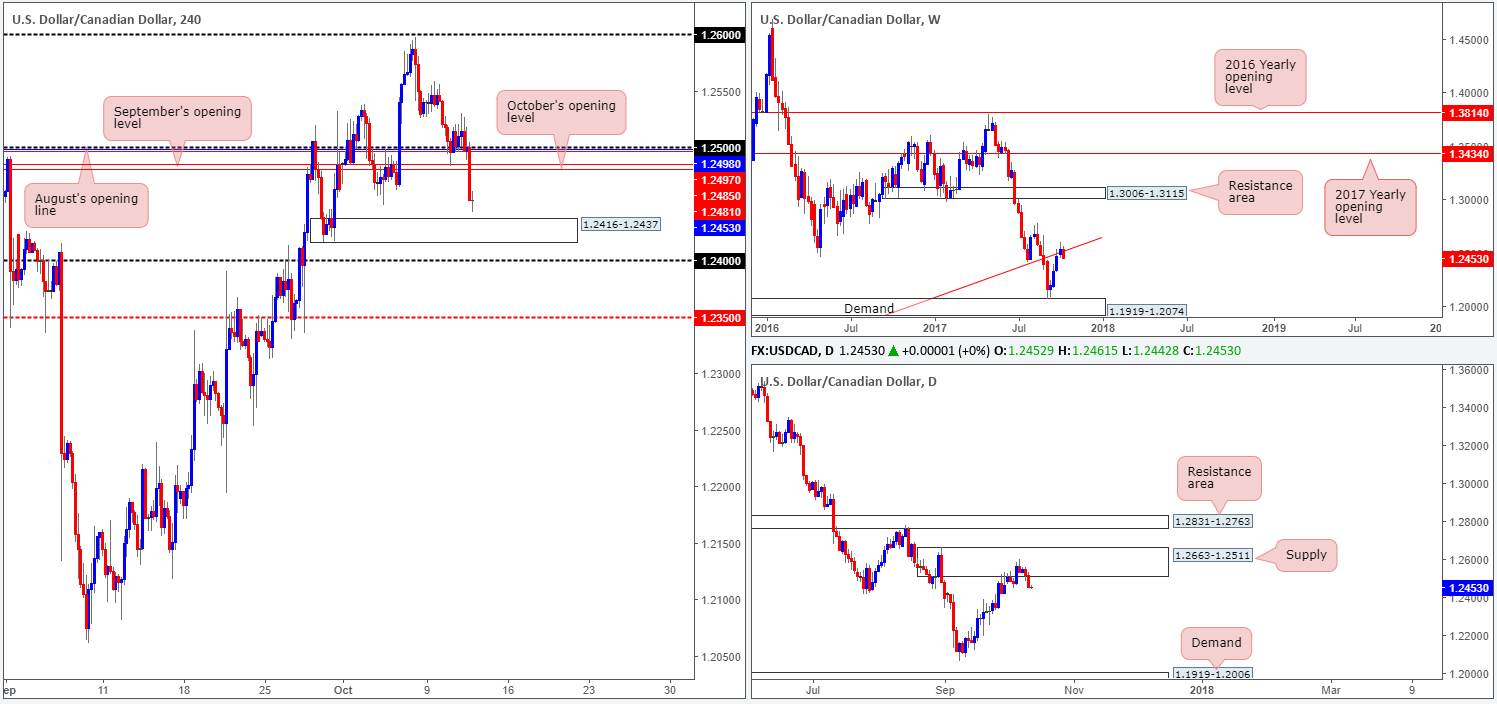
The aftermath of Wednesday’s FOMC meeting minutes saw the USD/CAD plunge lower, closing beneath a collection of H4 supports and ending the day clocking a low of 1.2452. Technically, this move is not really surprising. Not only do we have a weekly trendline resistance etched from the low at 0.9633 in play right now, we also have a strong-looking daily supply zone pegged at 1.2663-1.2511!
As you can see on the H4 timeframe, there’s a nearby demand base located at 1.2416-1.2437. While this area may produce a minor bounce to the upside, a fakeout through this zone down to 1.24 is likely to be seen. Although 1.24 will possibly hold price higher, we imagine that the move will only be temporary since let’s not forget where we are currently trading from on the bigger picture!
Suggestions: Right now, the only point of interest in this market is on a H4 close below 1.24. A decisive push below this number, coupled with a retest and a lower-timeframe sell signal (see the top of this report for information on how to use the lower timeframes as a means of entry) would, in our book, be enough evidence to sell down to at least the H4 mid-level support penciled in at 1.2350.
Data points to consider: US PPI m/m and US weekly unemployment claims at 1.30pm; FOMC members Brainard and Powell take to the stage at 3.30pm; US Crude oil inventories at 4pm; CAD Housing data at 1.30pm; Gov. Council member Wilkins speaks at 8.15pm GMT+1
Levels to watch/live orders:
- Buys: Flat (stop loss: N/A).
- Sells: Watch for H4 price to engulf 1.24 and then look to trade any retest seen thereafter ([waiting for a lower-timeframe sell signal to form following the retest is advised] stop loss: dependent on where one confirms the number).
USD/CHF:
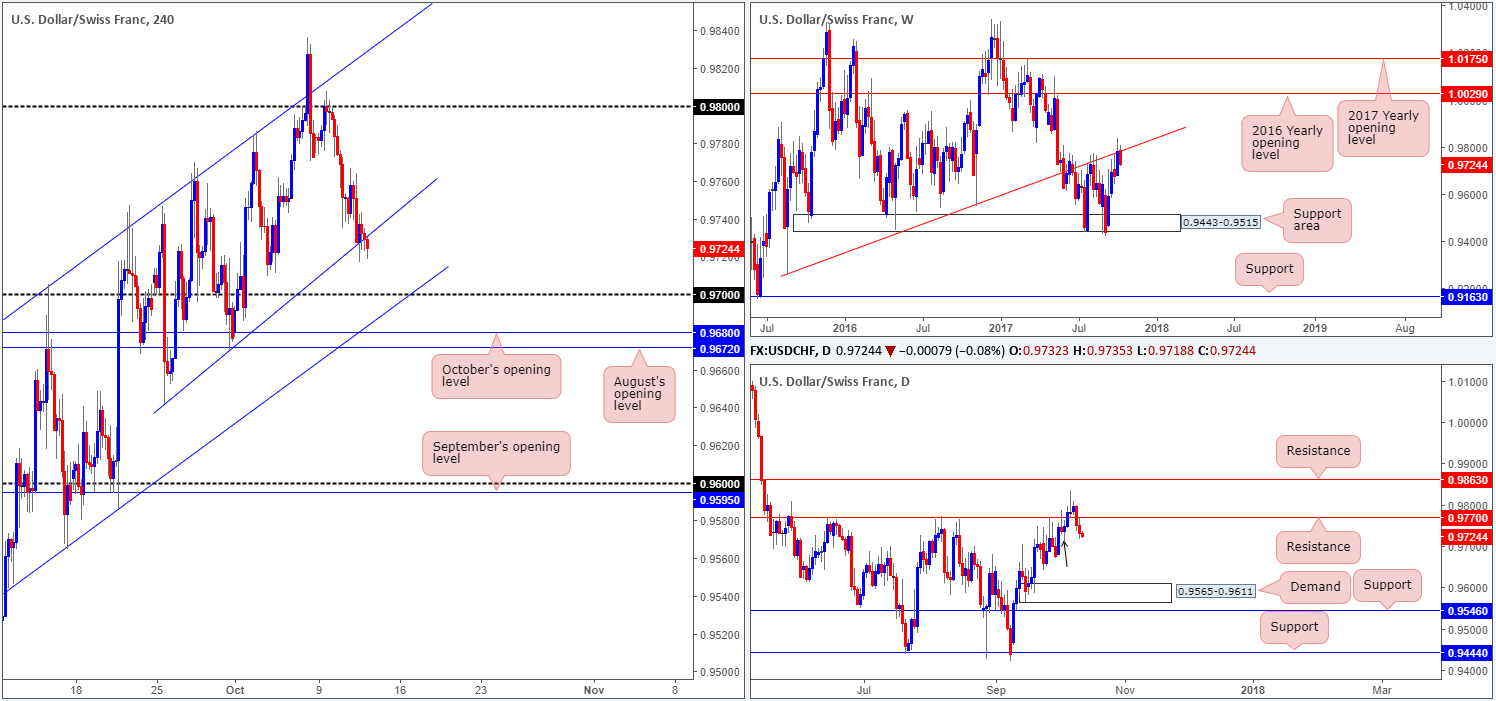
The USD/CHF continued its bearish course on Wednesday, recording its second consecutive losing day. The move, as you can see on the H4 timeframe, brought the trendline support extended from the low 0.9641 into the picture, which although has held firm thus far, it is looking incredibly fragile at the moment. A push through bids here would likely place the 0.97 handle and nearby H4 channel support taken from the low at 0.9565 in the limelight.
Turning our attention to the higher timeframes, it’s clear to see that the bears are beginning to make an appearance at the underside of the weekly trendline resistance drawn from the low 0.9257. Down on the daily timeframe, the tail marked with a black arrow at 0.9709 has already likely consumed the majority of unfilled buy orders, in our view. For that reason, we do not really see much active demand on the radar until we reach daily demand registered at 0.9565-0.9611.
Suggestions: In light of where the market is trading from on the higher timeframes, our desk has absolutely no interest in buying this market for the time being. A long from 0.97 may look appealing on the lower timeframes for an intraday bounce, but on the higher timeframes we believe it to be a daredevil trade i.e. not worth the risk!
Data points to consider: US PPI m/m and US weekly unemployment claims at 1.30pm; FOMC members Brainard and Powell take to the stage at 3.30pm GMT+1.
Levels to watch/live orders:
- Buys: Flat (stop loss: N/A).
- Sells: Flat (stop loss: N/A).
DOW 30:
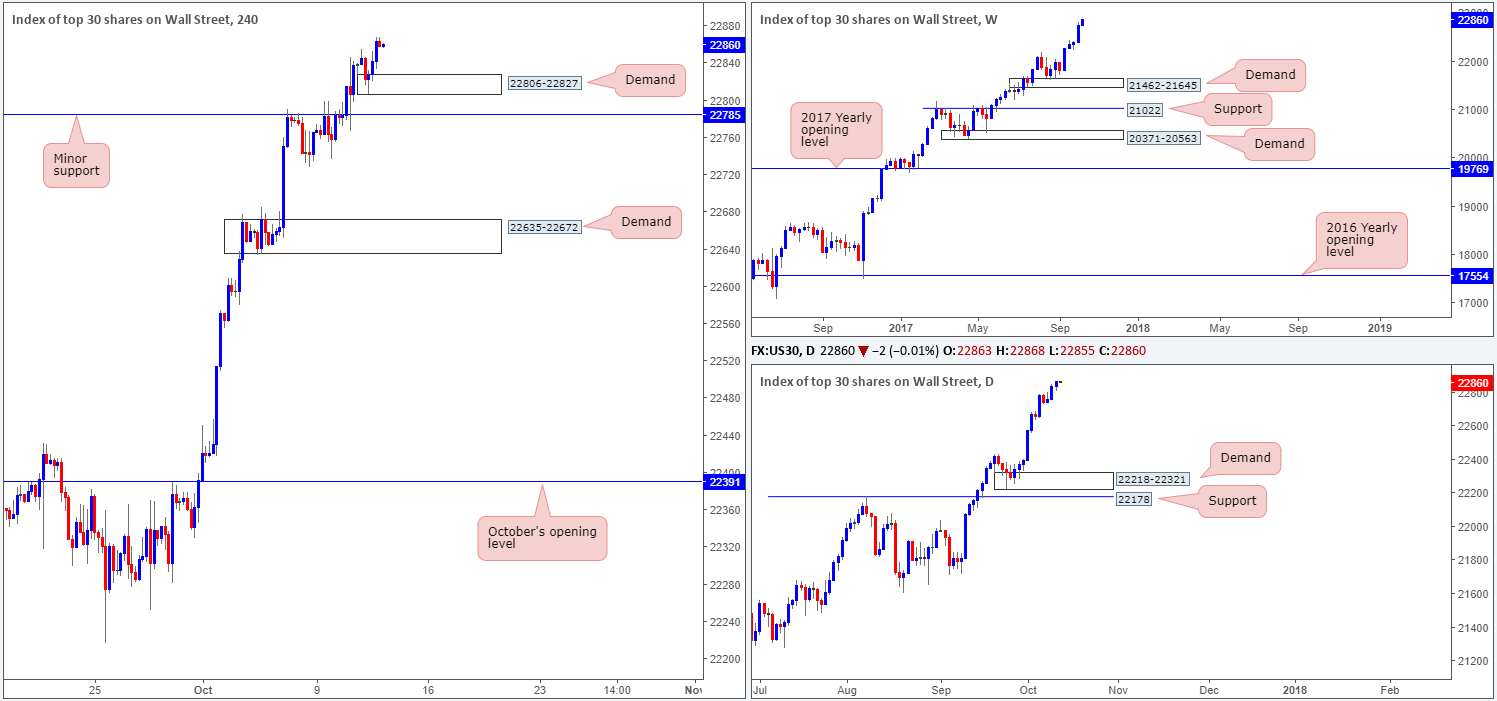
The bullish pulse continues to beat in the US equity markets. The DJIA pressed higher for a third consecutive day on Wednesday, tapping a fresh record high of 22,867. Apart from this, we can also see that a newly-formed H4 demand has taken shape at 22806-22827. Owing to the strong uptrend this market is in right now, this area could help provide a floor to buy from should the index pullback today. Still, we would not advise placing pending buy orders at this zone, since there is little stopping H4 price from faking below this area and attacking fresh bids at a minor H4 support level coming in from 22785.
Suggestions: Watch for H4 price to form a full or near-full-bodied bull candle around the aforementioned H4 demand area. This will, of course, not guarantee you a winning trade, but what it will do is show buyer intent and therefore increases the odds of price moving in your favor.
Data points to consider: US PPI m/m and US weekly unemployment claims at 1.30pm; FOMC members Brainard and Powell take to the stage at 3.30pm GMT+1.
Levels to watch/live orders:
- Buys: 22806-22827 region ([waiting for a reasonably sized H4 bullish candle to form – preferably a full, or near-full-bodied candle – is advised] stop loss: ideally beyond the candle’s tail).
- Sells: Flat (stop loss: N/A).
GOLD:
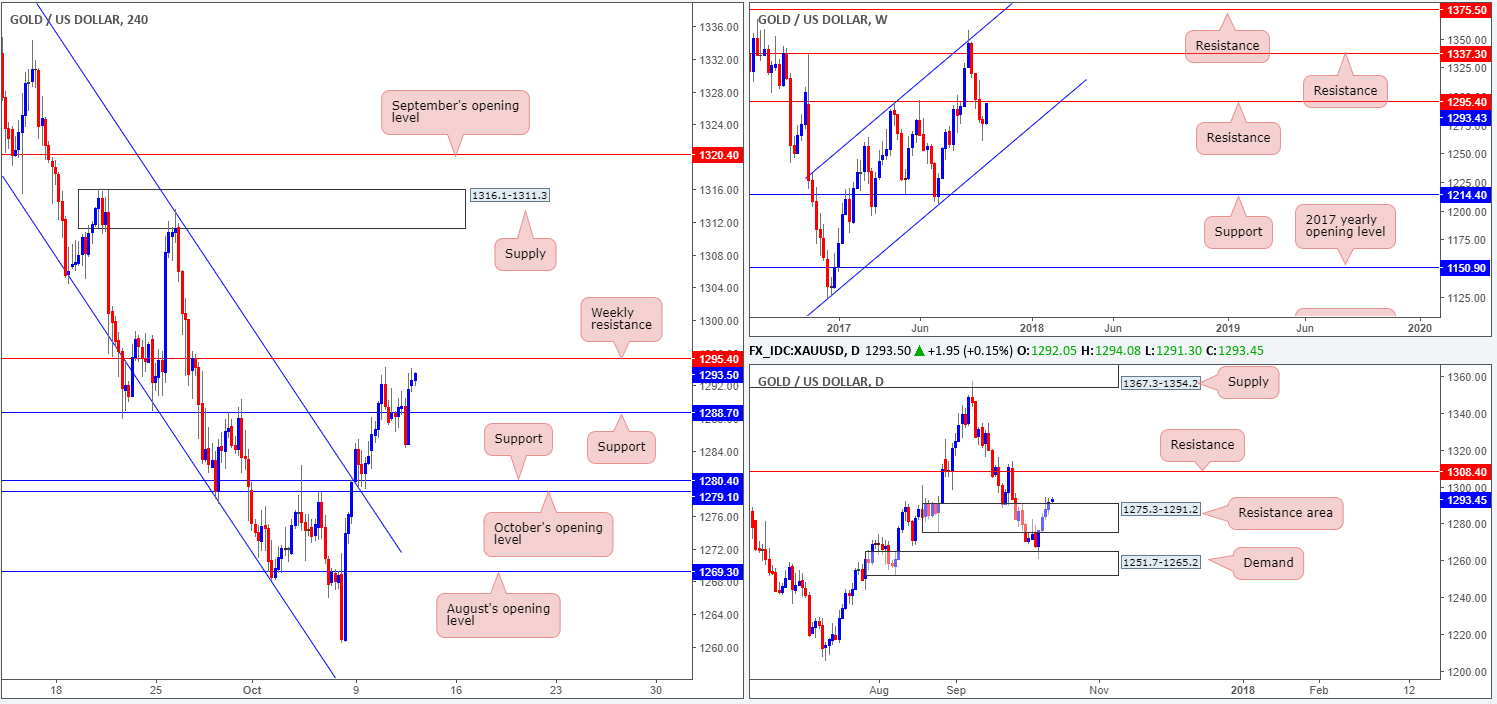
From the top this morning, it’s clear to see weekly action trading within striking distance of a resistance level fixed at 1295.4. On the daily timeframe, however, the yellow metal is seen breaching the top edge of a resistance area coming in at 1275.3-1291.2, which could, should the bulls continue to push, see the unit approach resistance pegged at 1308.4.
The question, therefore, is do we look for shorts at the noted weekly resistance, when we can clearly see the bulls tampering with the top limit of a daily resistance area? It is certainly a precarious position.
Suggestions: With the USDX weekly candles showing room to move as far south as support at 11854, a short at the said weekly resistance might not be the best path to take right now.
Levels to watch/live orders:
- Buys: Flat (stop loss: N/A).
- Sells: Flat (stop loss: N/A).


