
EUR/USD:
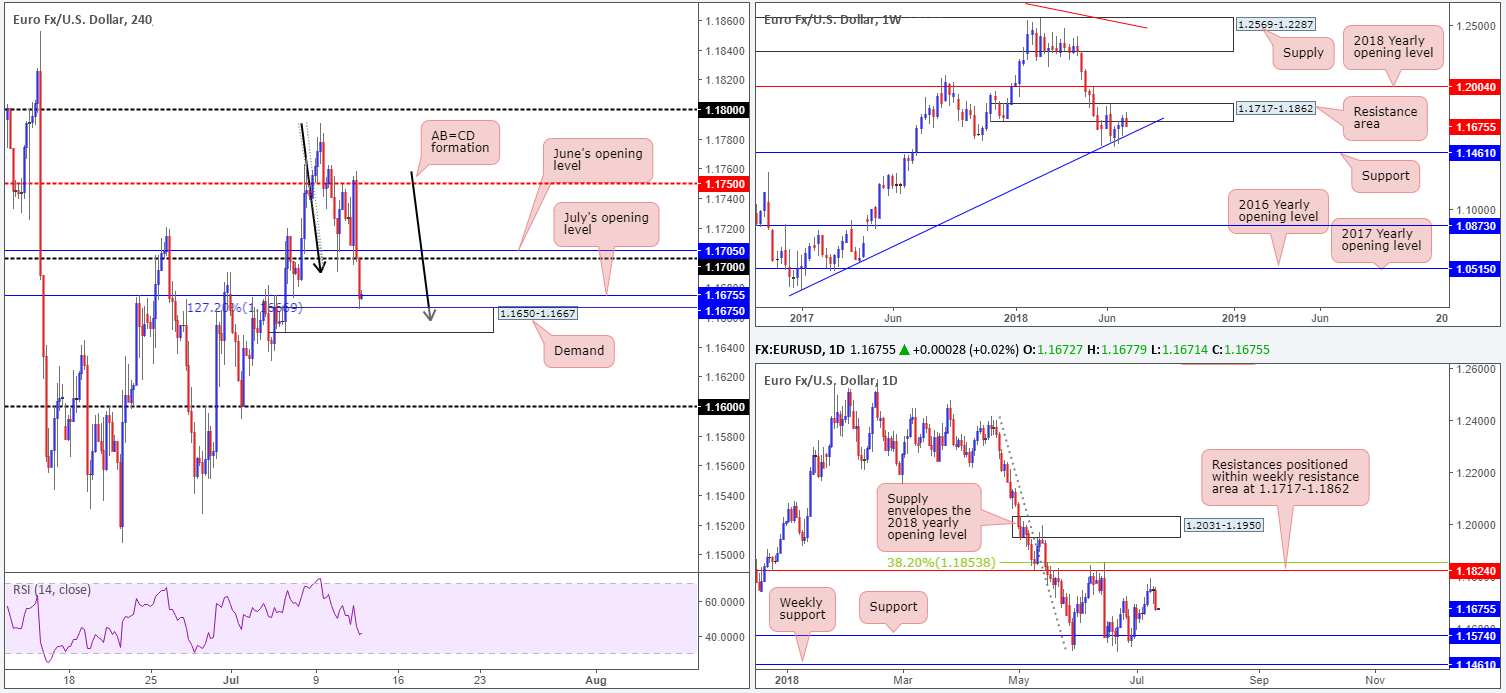
Across the board, the USD remained well-bid on Wednesday, seemingly buoyed by higher-than-expected PPI figures and Fed comments. In consequence, the shared currency suffered. The EUR/USD turned lower from the H4 mid-level resistance at 1.1750 into US trade, breaking 1.17 and connecting with H4 demand at 1.1650-1.1667 by the day’s end. Despite this, a recovery could be in the midst according to the H4 timeframe. Not only did we connect with H4 demand yesterday, we also crossed swords with July’s opening level at 1.1650 and bottomed around a H4 AB=CD (black arrows) 127.2% completion at 1.1666.
Things over on the weekly picture, nevertheless, do not support our H4 read. The resistance area at 1.1717-1.1862 is seen holding firm, with price action poised to retest nearby trend line support etched from the low 1.0340 (lower than our H4 zone). Further adding to this, we do not see much support stopping daily price from probing lower at least until we reach the 1.1574 mark (once again, lower than our H4 area).
Areas of consideration:
While the higher timeframes are not supportive of a rotation to the upside on the H4, a reaction from the current H4 demand is certainly not out of the question, given surrounding confluence. The only trouble here, though, is overhead resistance on the H4 scale: the 1.17 handle and June’s opening level at 1.1705. This does not leave much room to play with in terms of risk/reward. For that reason, unless one is able to pin down a setup on the lower timeframes with a reasonably small stop, passing on longs here may be the safer path to take.
A close below the current H4 demand likely opens downside to the 1.16 handle. Should the close be followed up with a retest of the broken H4 demand, this would, according to the overall technical picture, be enough evidence to suggest a short, targeting 1.16, followed closely by daily support at 1.1574 (by this point, the weekly trend line support will also be in play).
Today’s data points: ECB monetary policy meeting accounts; US inflation figures and unemployment claims.
GBP/USD:
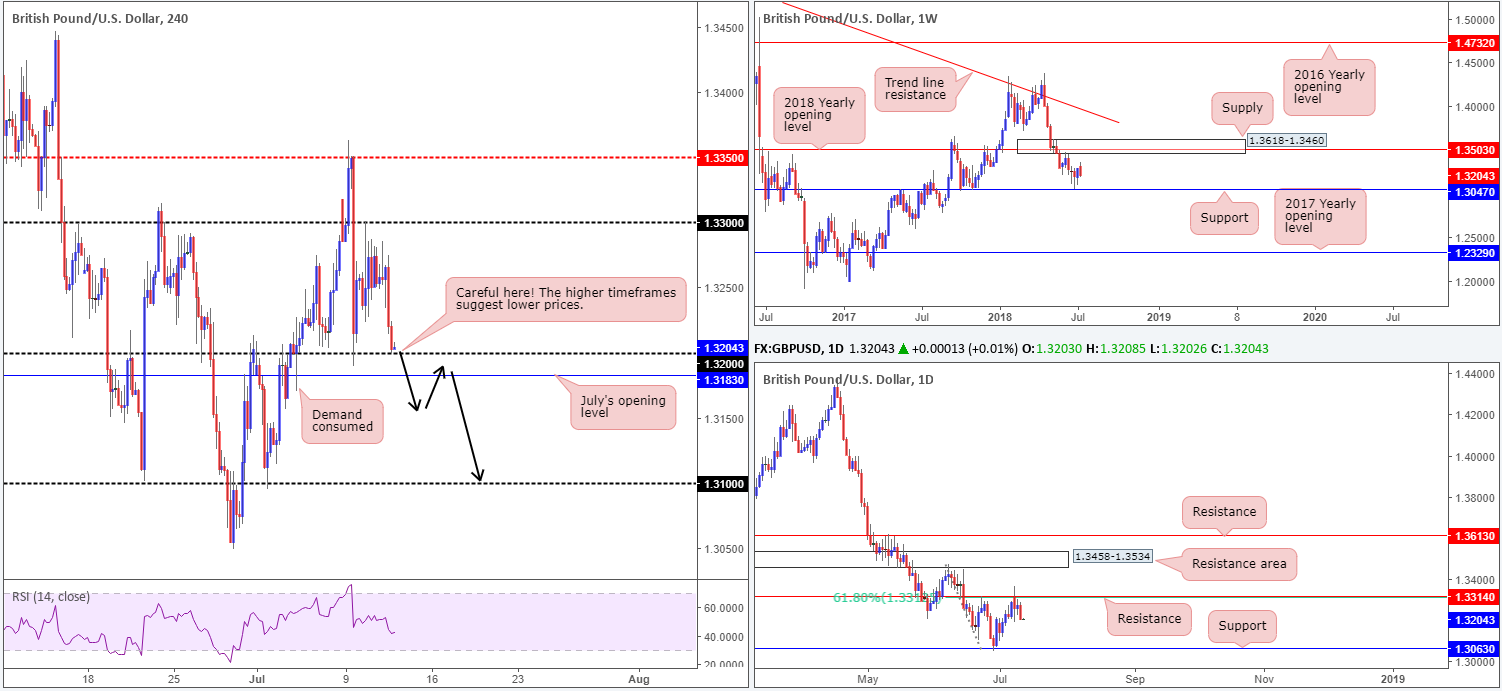
In similar fashion to the EUR/USD, the British pound sagged under the weight of the mighty USD. Political tensions in the UK also weighed on the pound amid Wednesday’s trade, consequently pulling the market back down to the 1.32 handle. Attention going forward is on today’s release of the long-awaited white paper, which is expected to show a notable softening in the UK’s negotiating position.
Although 1.32 has an additional layer of support seen beneath it at 1.3183: July’s opening level, higher-timeframe technicals suggest a move lower may be on the cards. Both weekly and daily structure show room to press lower, with the closest support registered on the daily timeframe at 1.3063.
Areas of consideration:
In view of the market’s position on the higher timeframes, attempting to buy 1.32 is a chancy move. A more conservative approach here we feel would be to wait and see if H4 price closes below 1.3183/1.32. A retest to underside of this small area that holds in the form of a full or near-full-bodied H4 bear candle would, in our humble view, be enough to attract sellers into the market, targeting the 1.31 handle, followed by daily support mentioned above at 1.3063.
Today’s data points: BoE credit conditions survey; US inflation figures and unemployment claims.
AUD/USD:
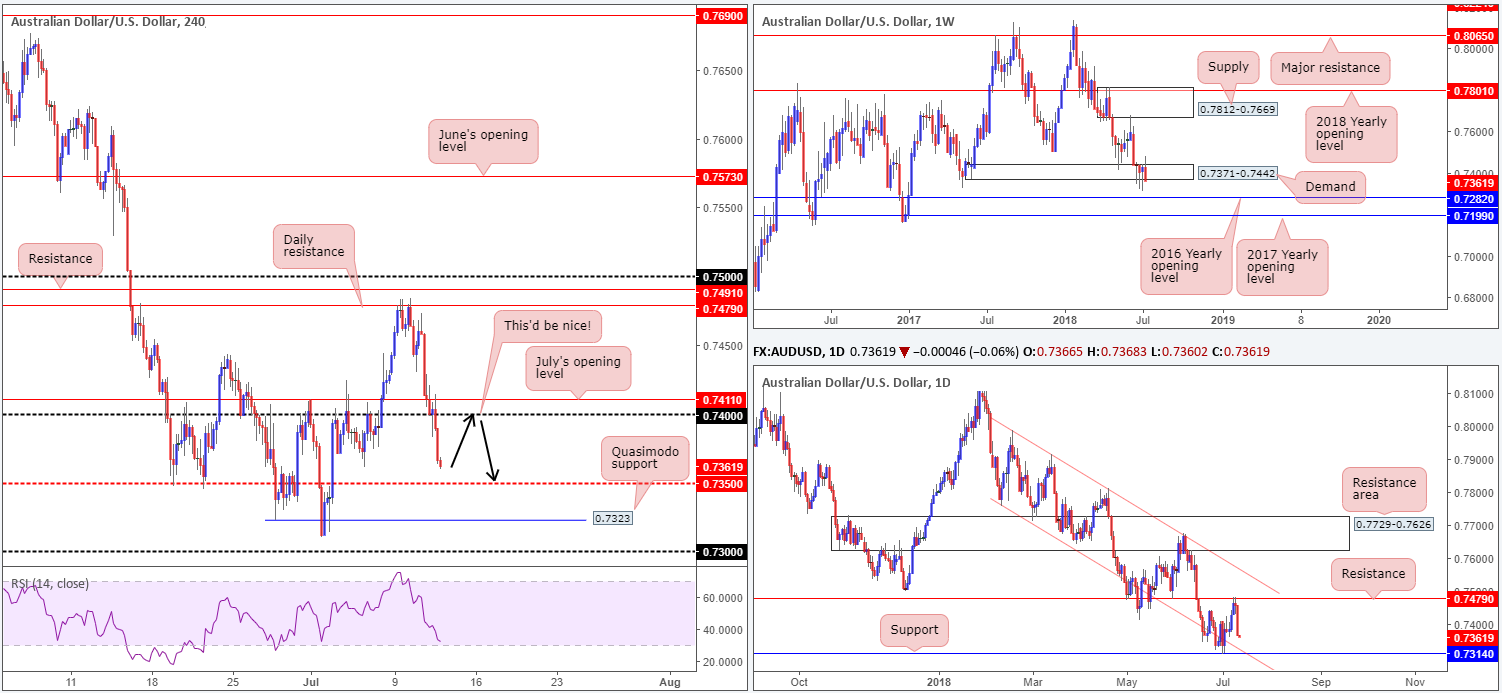
The commodity-linked currency was one of the stand-out victims on Wednesday amid US/China trade tensions, consequently concluding the day in the shape of a full-bodied daily bearish candle. The H4 candles, as you can see, breached the 0.74 handle amid US trade, and is, at the time of writing, poised to shake hands with H4 mid-level support plotted at 0.7350. Well done to those who remain short from the 0.75/0.7479. The trade turned out a beauty!
Weekly demand at 0.7371-0.7442 appears incredibly fragile at the moment, opening the window to a test of the 2016 yearly opening level at 0.7282 sometime down the road. Daily movement, on the other hand, is seen trading within striking distance of support coming in at 0.7314, which happens to converge closely with a daily channel support (albeit not the prettiest one) etched from the low 0.7758.
Areas of consideration:
A retest to the underside of 0.74 today would be of interest for possible shorts, targeting 0.7350, followed closely by H4 Quasimodo support at 0.7323. This would be even better should the retest of 0.74 occur prior to connecting with 0.7350!
Breakout traders looking to short below 0.7310 may want to note that they’re effectively selling into daily support here at 0.7314. Not to mention the nearby 0.73 handle as well! Therefore, trade carefully around this region should price reach this far south.
Today’s data points: US inflation figures and unemployment claims.
USD/JPY:
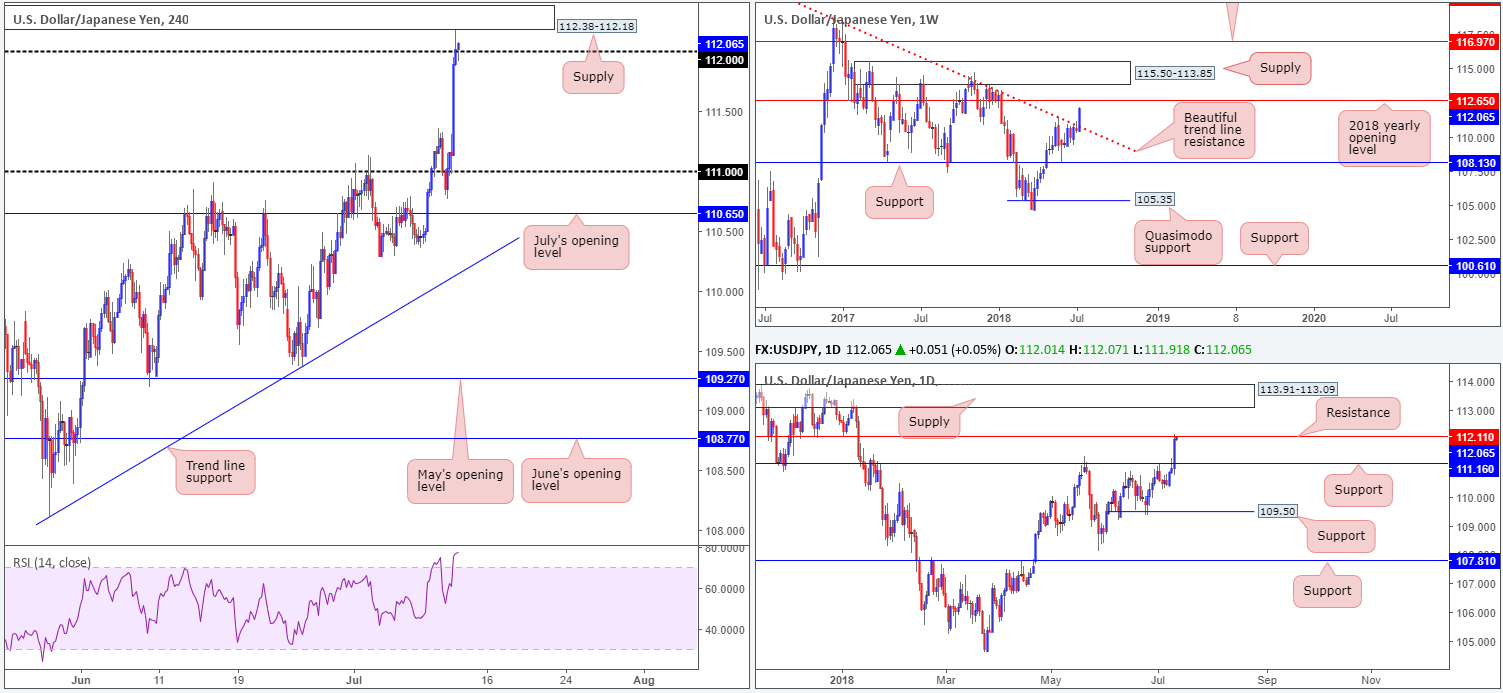
The Japanese yen withered against its US counterpart on Wednesday, despite risk-averse conditions. Higher-than-expected PPI figures and Fed comments seemingly boosted the greenback, bringing the USD/JPY to highs of 112.17, levels not seen since early January.
Thanks to yesterday’s bout of buying, weekly price climbed above weekly trend line resistance taken from the high 123.57 and is now poised to connect with the 2018 yearly opening level at 112.65. In terms of daily movement, we’re seeing the pair shake hands with resistance drawn from 112.11. A rejection off this number has support at 111.16 to target, whereas a continuation to the upside will likely eye supply at 113.91-113.09.
The technical picture over on the H4 timeframe shows the unit recently breaching the 112 handle and tagging the underside of supply at 112.38-112.18. As we write, the bulls are emphasizing strength around 112 which could lead to further tests of the aforementioned supply today.
Areas of consideration:
According to H4 and daily structure, the pair is likely to turn lower today. Not only do we have daily resistance at 112.11, we also see H4 supply mentioned above at 112.38-112.18 and the 112 handle in play. The only grumble here, though, is weekly structure. Weekly bulls could pull this market beyond the said areas on H4 and daily to test the 2018 yearly opening level mentioned above at 112.65.
Should traders feel the H4 and daily areas are worthy of shorts still, waiting and seeing if H4 price can print a full or near-full-bodied bearish candle from this region is advised before pulling the trigger. This will not guarantee a winning trade, but it will show seller intent.
Today’s data points: US inflation figures and unemployment claims.
USD/CAD:
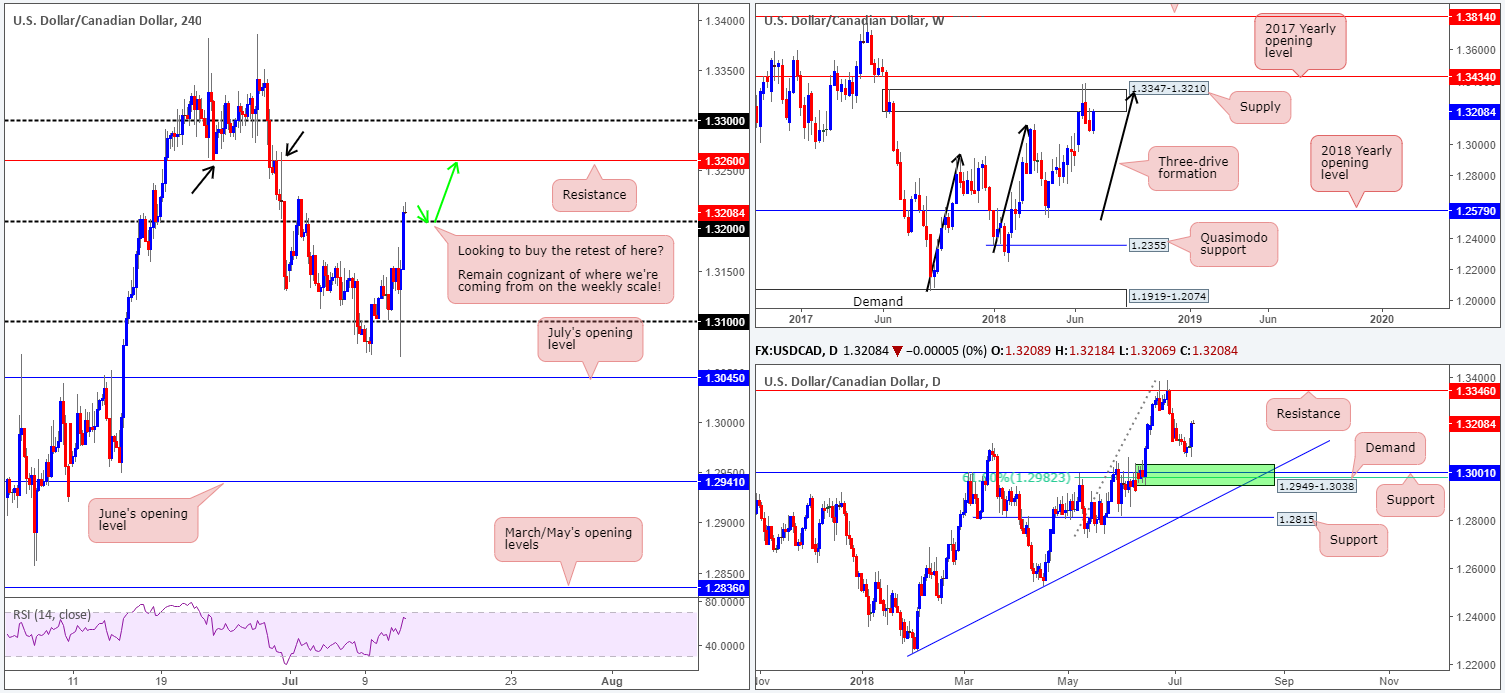
The USD/CAD smashed through 1.31 to clock lows of 1.3064, following the BoC raising rates on Wednesday, as expected. As you can see on the H4 timeframe, the move was a short-lived one. Initial CAD gains were pared as the US dollar caught another bid amid trade tensions, seeing the pair finish the day above 1.32. Above this number we don’t see much resistance to get excited about, until reaching 1.3260.
On the daily timeframe, resistance is not expected to enter the market until around the 1.3346 region. Other key areas to keep note of on this scale are support standing at 1.3001 (history dating back to Sept 2016), followed closely by a 61.8% Fib support value at 1.2982. On top of this, we can also see demand painted in green at 1.2949-1.3038 converging with these levels!
The story on the weekly timeframe, however, shows weekly price reconnecting with the underside of supply at 1.3347-1.3210. Also worth remembering here is the recently completed a three-drive approach (see black arrows).
Areas of consideration:
Buying on any retest seen at 1.32 this morning is an option. We would strongly recommend waiting for H4 price to chalk up a full or near-full-bodied bull candle before pulling the trigger, though, as weekly sellers from the underside of supply may enter the fray. On the plus side, however, we do have plenty of room to stretch higher on the daily scale, and adequate space on the H4 timeframe till 1.3260ish.
Today’s data points: US inflation figures and unemployment claims; CAD NHPI m/m.
USD/CHF:
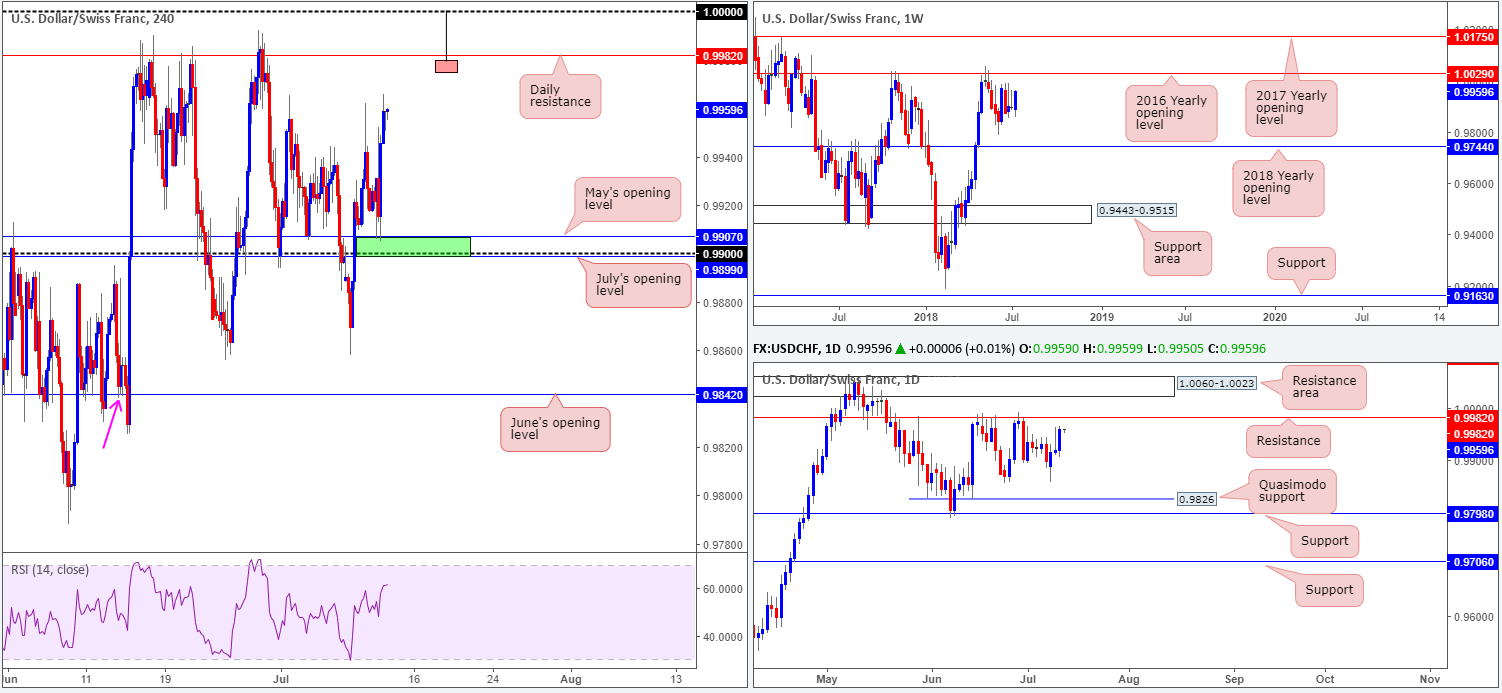
The USD outperformed against it Swiss counterpart on Wednesday, bouncing beautifully from the green H4 zone at 0.9899/0.9907 (comprised of July’s opening level, 0.99 handle and May’s opening level). Well done to any of our readers who managed to get in on this move, as the area was noted to keep eyeballs on in Wednesday’s briefing.
Further buying from current price will likely call for a test of daily resistance plotted at 0.9982 (held price firmly lower in the month of June). Beyond here, we have parity (1.0000) marked on the H4 timeframe, and then the 2016 yearly opening level seen plotted on the weekly timeframe at 1.0029.
Areas of consideration:
Should daily resistance be brought into the fight today, we‘re expecting a fakeout of this level to be seen up to 1.0000. The stop-loss orders above the daily line will, assuming we’re correct on our read, act as liquidity for those looking to sell 1.0000 (remember sellers’ stops become buy orders once filled). An ideal setup here, therefore, would be for H4 price to pencil in a bearish pin-bar formation that pierces through 0.9982 and tags 1.0000 (see chart for visual representation). Should the bulls post strong posture above 0.9982, on the other hand, entering short from 1.0000 is chancy, since we can then expect weekly price to bring the unit up to the 2016 yearly opening level mentioned above at 1.0029.
Today’s data points: US inflation figures and unemployment claims.
Dow Jones Industrial Average:
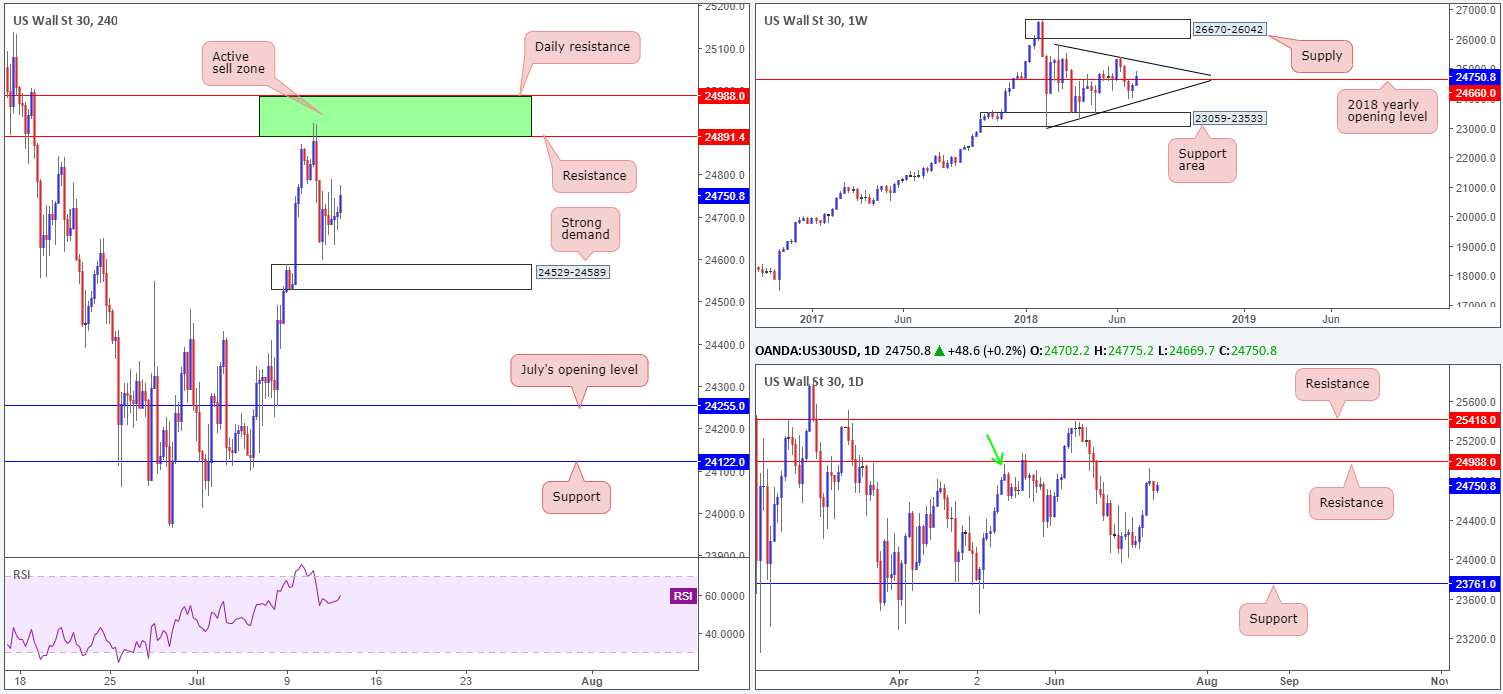
US equities remained somewhat sedated amid Wednesday’s session, consolidating just north of H4 demand coming in at 24529-24589. In the event the index looks to reclaim recently lost ground, the 24988/24891 H4 sell zone painted in green will be first area in line for a retest (comprised of a daily and H4 resistance levels).
Note on the daily timeframe, the daily resistance level highlighted above at 24988 also represents a Quasimodo resistance taken from the left shoulder at 24957, seen marked with a green arrow. The story on the weekly timeframe, however, shows price action compressing between two converging trend lines (black lines – 25807/23055). Also worthy of mention on this scale is the 2018 yearly opening level plotted at 24660.
Areas of consideration:
H4 demand at 24529-24589, given its strong momentum from its base, is on the radar for possible longs today. As is the 24988/24891 H4 green zone for shorts, owing to its association with the daily timeframe.
As the market lacks higher timeframe direction at present (see weekly timeframe compressing between two trend lines), taking trades at either H4 zone noted above is an option today. Nevertheless, traders should consider waiting for additional confirmation on the H4 timeframe in the form of full or near-full-bodied candles from the areas, before pulling the trigger.
Today’s data points: US inflation figures and unemployment claims.
XAU/USD (Gold)
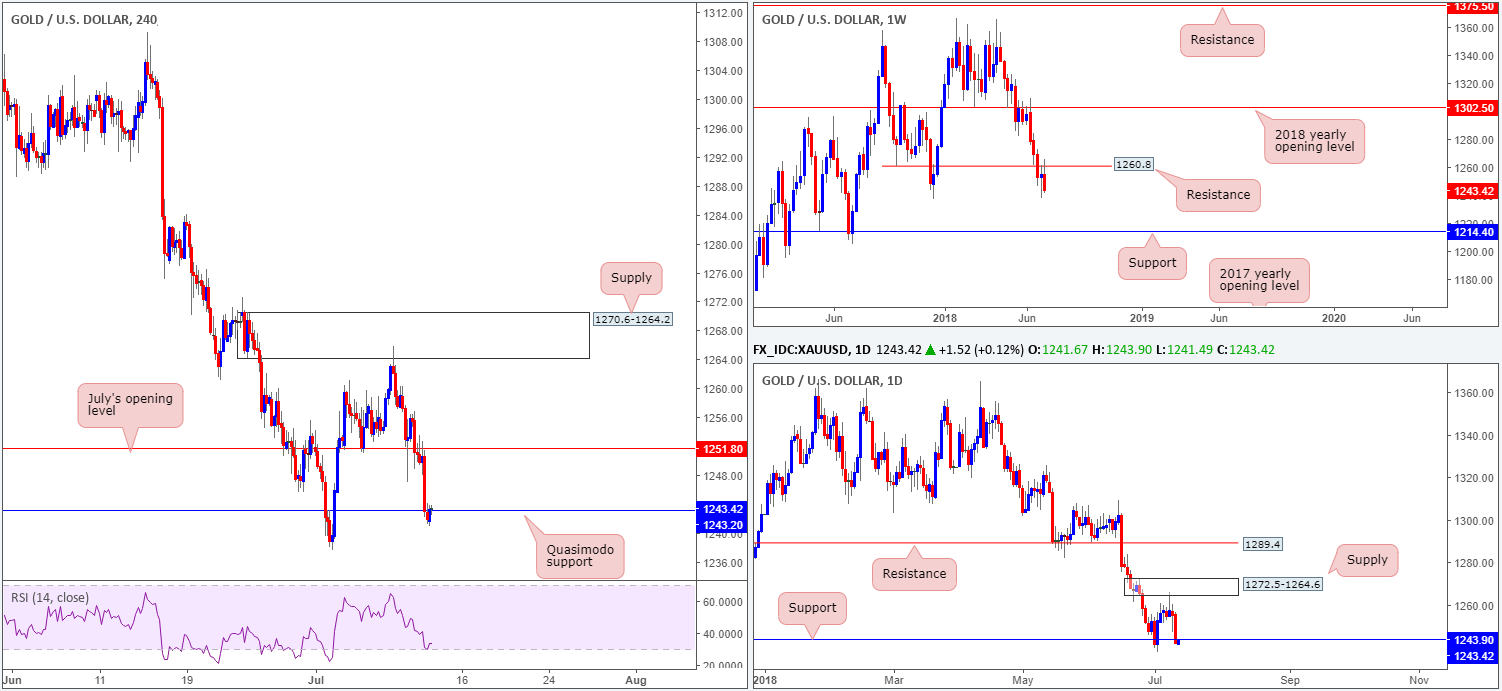
As the USD headed for higher ground on Wednesday, it should be of no surprise to see bullion probed lower. July’s opening level on the H4 timeframe at 1251.8, as you can see, was taken out and retested as resistance, before price action shook hands with H4 Quasimodo support at 1243.2. As of writing, the bulls are attempting to hold this level, but appear struggling as breakout sellers beyond the recently broken daily support at 1243.9 are likely involved now. Also worth noting is weekly resistance at 1260.8 continues to emphasize strength in this market. Further selling from this vicinity will see the yellow metal potentially approach weekly support at 1214.4.
Areas of consideration:
With daily support and the current H4 Quasimodo support hanging on by a thread at the moment, downside looks vulnerable. This – coupled with weekly price staging a rather impressive selloff from the underside of 1260.8 – makes it difficult to be bullish the yellow metal.
On account of the above, the team has noted to watch for possible shorting opportunities in this market, preferably around the underside of daily support (now likely resistance) at 1243.9. In order to do this, though, drilling down to the lower timeframes may be necessary. A lower-timeframe trend line support break/retest, a lower timeframe demand break/retest, or even simply a collection of lower timeframe selling wicks at the underside of 1243.9 would, in our view, be enough confirmation to suggest the sellers are in the driving seat. Downside targets on the H4 scale, apart from the July 3 low at 1237.6, do not come into view until we reach H4 support at 1228.1 (not seen on the screen).
The use of the site is agreement that the site is for informational and educational purposes only and does not constitute advice in any form in the furtherance of any trade or trading decisions.
The accuracy, completeness and timeliness of the information contained on this site cannot be guaranteed. IC Markets does not warranty, guarantee or make any representations, or assume any liability with regard to financial results based on the use of the information in the site.
News, views, opinions, recommendations and other information obtained from sources outside of www.icmarkets.com.au, used in this site are believed to be reliable, but we cannot guarantee their accuracy or completeness. All such information is subject to change at any time without notice. IC Markets assumes no responsibility for the content of any linked site. The fact that such links may exist does not indicate approval or endorsement of any material contained on any linked site.
IC Markets is not liable for any harm caused by the transmission, through accessing the services or information on this site, of a computer virus, or other computer code or programming device that might be used to access, delete, damage, disable, disrupt or otherwise impede in any manner, the operation of the site or of any user’s software, hardware, data or property.


