
DXY:
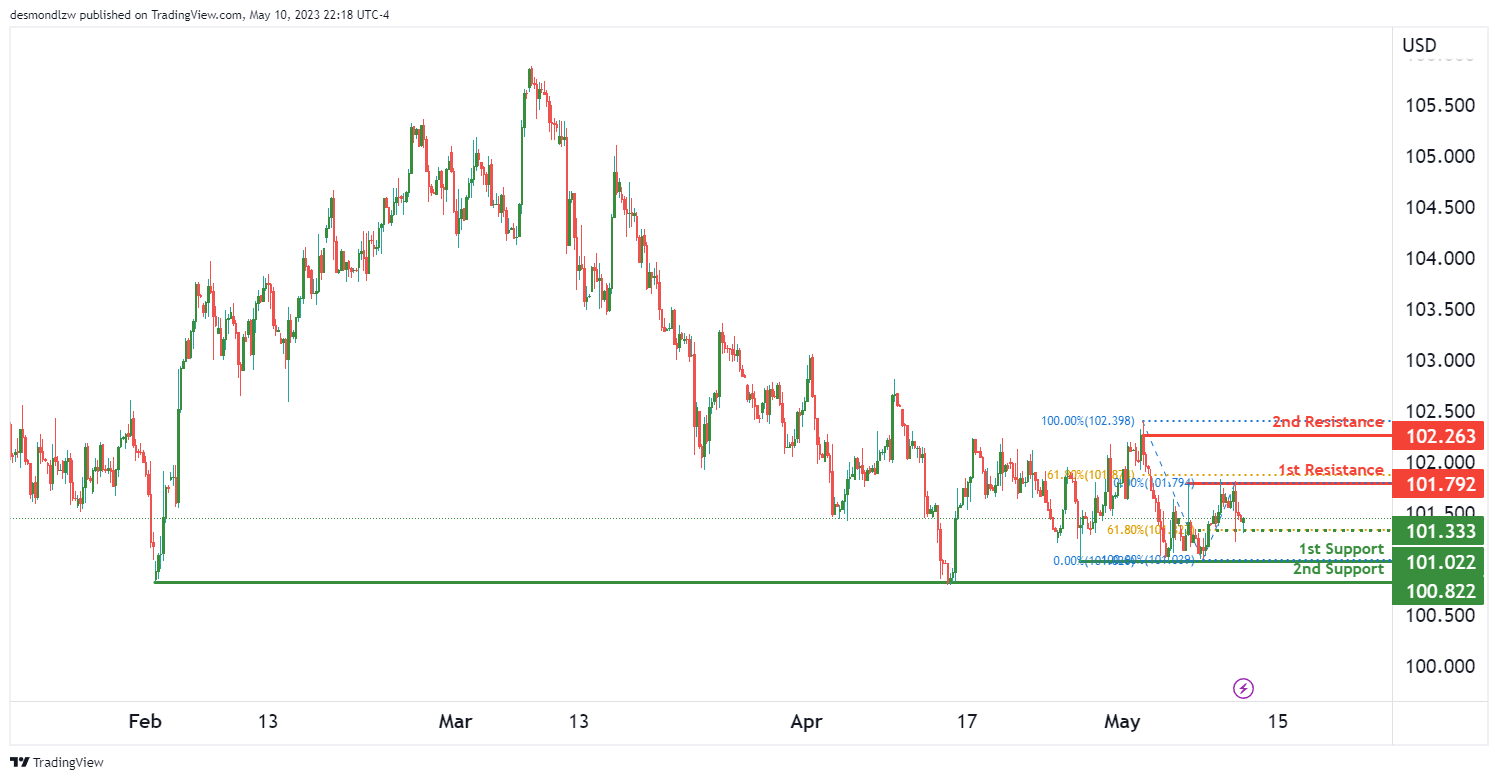
The DXY chart is currently showing bearish momentum, with price potentially continuing its bearish trend towards the 1st support level at 101.02. This support level is a multi-swing low support, indicating that price has bounced off this level multiple times in the past.
If the price were to break through the 1st support level, it could potentially drop down to the 2nd support level at 100.82, which is also a multi-swing low support.
On the resistance side, the 1st resistance level is at 101.79, which is a multi-swing high resistance and coincides with a 61.80% Fibonacci retracement. If price were to rise from the 1st support level, it could potentially reach this level before encountering any further resistance.
The 2nd resistance level is at 102.26 and is a swing high resistance level. If price were to continue rising past the 1st resistance level, it could potentially encounter resistance at this level.
There is also an intermediate support level at 101.33, which is an overlap support level and coincides with a 61.80% Fibonacci retracement. If price were to drop below the current level and break through the intermediate support level, it could potentially trigger a stronger bearish acceleration towards the 1st support level.
EUR/USD:
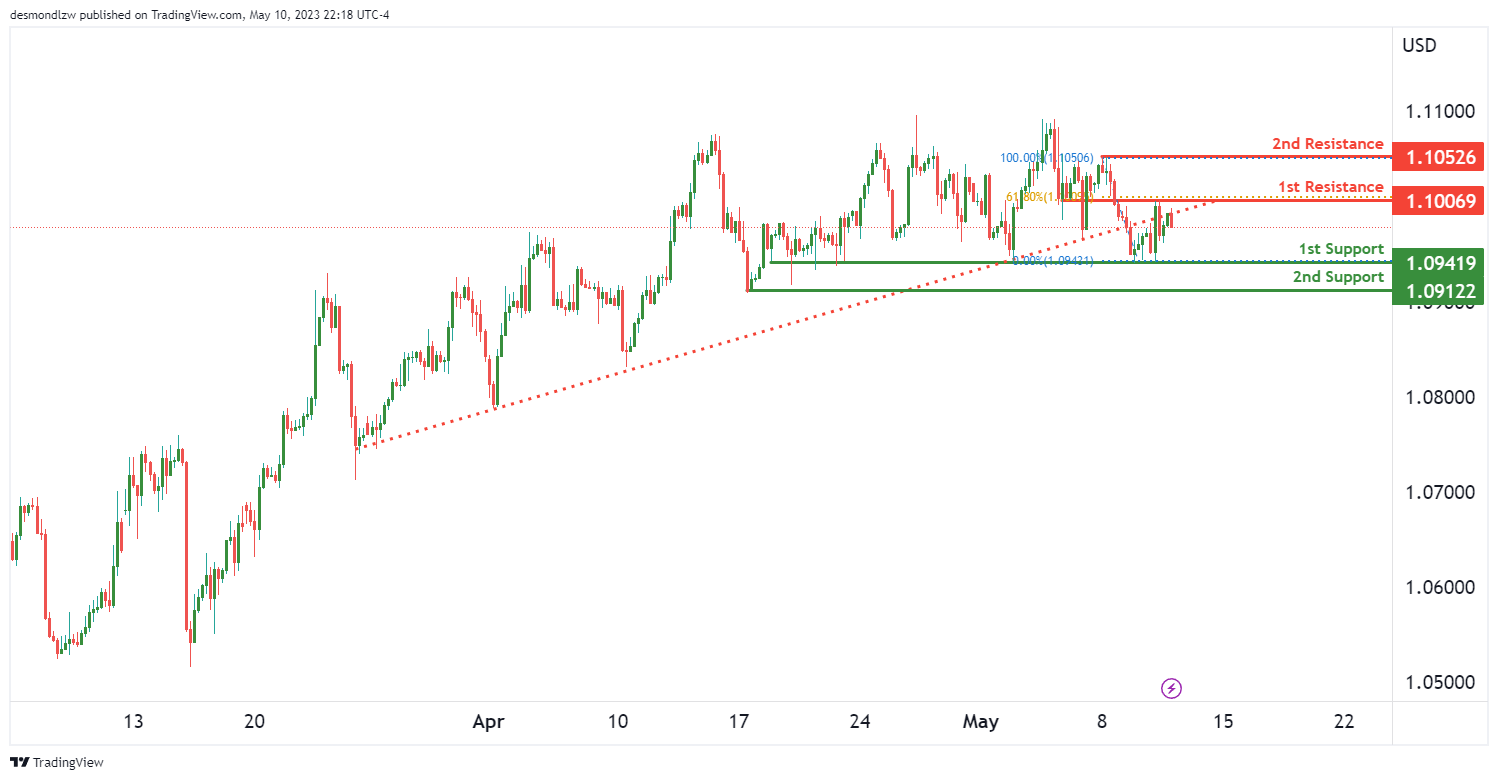
The EUR/USD chart is currently showing bearish momentum, with several factors contributing to this trend. Firstly, price broke below an ascending support line, triggering a potential bearish move. Secondly, price is testing a descending trend line which acts as resistance.
If this bearish momentum were to continue, price could potentially drop towards the 1st support level at 1.0941, which is a multi-swing low support level. If price were to break through this support level, it could potentially drop further towards the 2nd support level at 1.0912, which is a swing low support level.
On the resistance side, the 1st resistance level is at 1.1007, which is an overlap resistance level and coincides with a 61.80% Fibonacci retracement. If price were to rise from the current level, it could potentially encounter resistance at this level before moving further up.
The 2nd resistance level is at 1.1052 and is a swing high resistance level. If price were to rise past the 1st resistance level, it could potentially encounter resistance at this level.
GBP/USD:
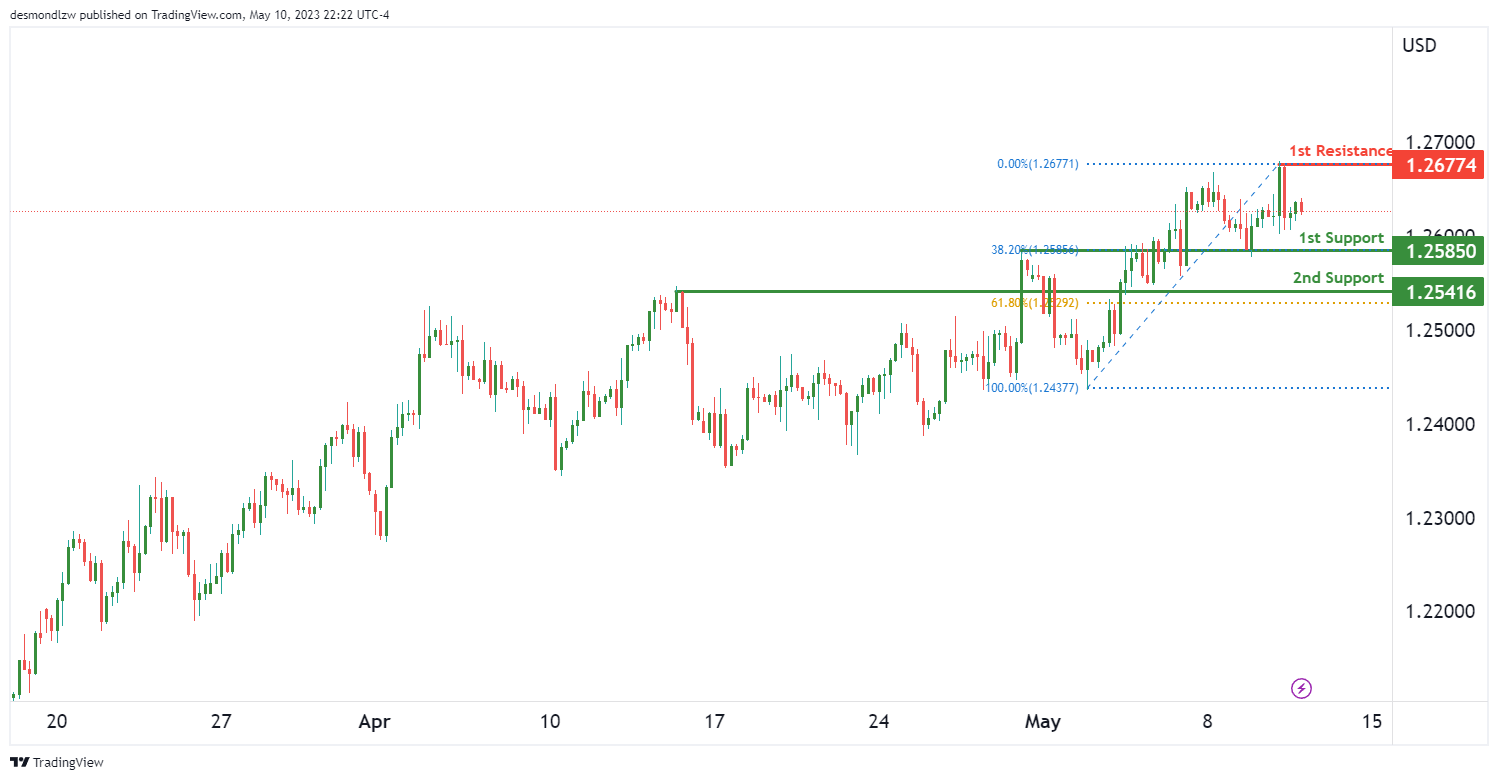
The GBP/USD chart is currently showing a neutral momentum, with price potentially fluctuating between the 1st resistance and 1st support levels.
The 1st support level is at 1.2585, which is an overlap support level and coincides with a 38.20% Fibonacci retracement. If price were to drop from the current level, it could potentially find support at this level.
The 2nd support level is at 1.2541, which is also an overlap support level and coincides with a 61.80% Fibonacci retracement. If price were to drop further, it could potentially find support at this level.
On the resistance side, the 1st resistance level is at 1.2677, which is a swing high resistance level. If price were to rise from the current level, it could potentially encounter resistance at this level.
USD/CHF:
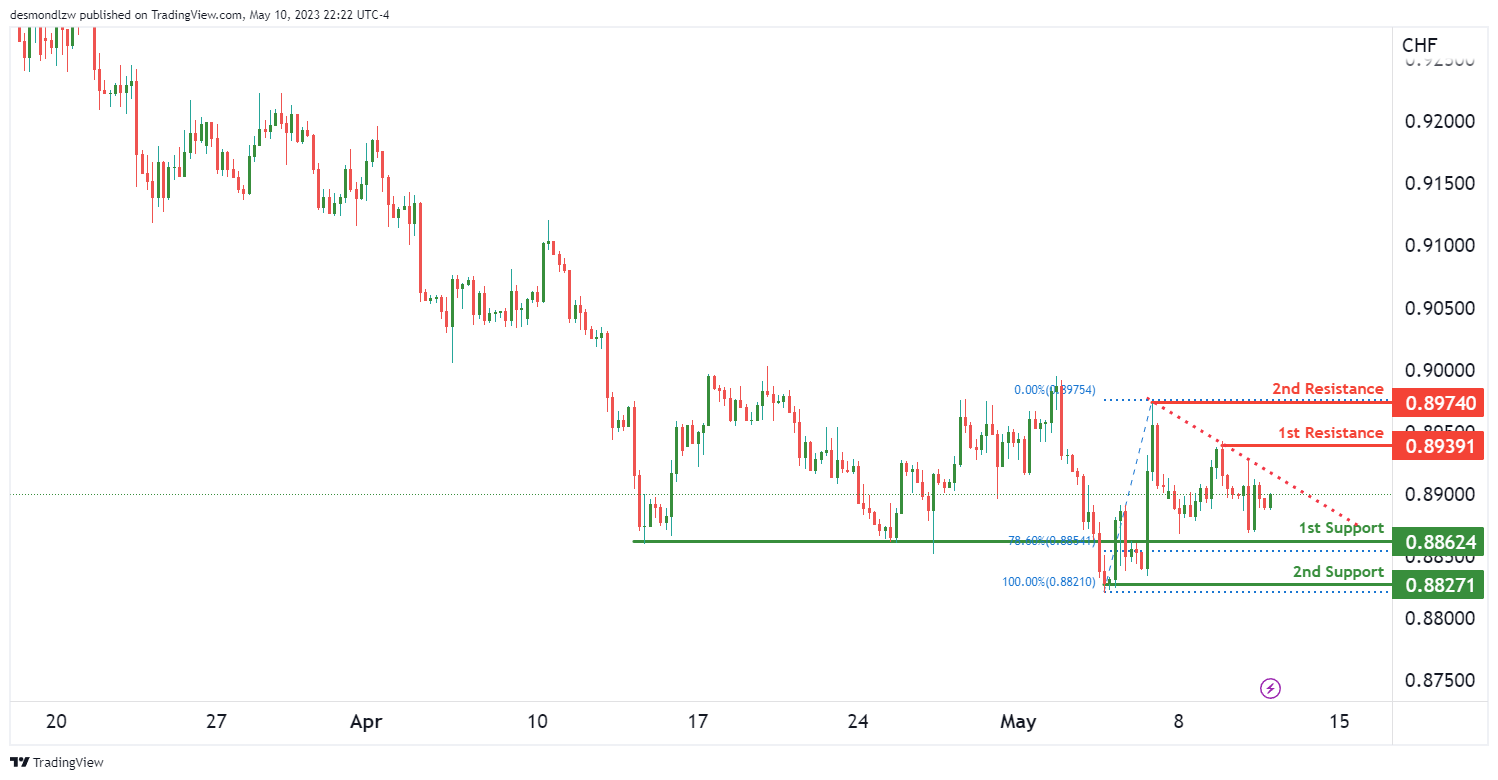
The USD/CHF chart is currently showing bearish momentum, with price below a major descending trend line suggesting that bearish momentum is on the cards.
If this bearish momentum were to continue, price could potentially drop towards the 1st support level at 0.8862, which is an overlap support level and coincides with a 78.60% Fibonacci retracement. If price were to break through this support level, it could potentially drop further towards the 2nd support level at 0.8827, which is a multi-swing low support level.
On the resistance side, the 1st resistance level is at 0.8939, which is a swing high resistance level. If price were to rise from the current level, it could potentially encounter resistance at this level.
The 2nd resistance level is at 0.8974 and is also a swing high resistance level. If price were to rise past the 1st resistance level, it could potentially encounter resistance at this level.
USD/JPY:
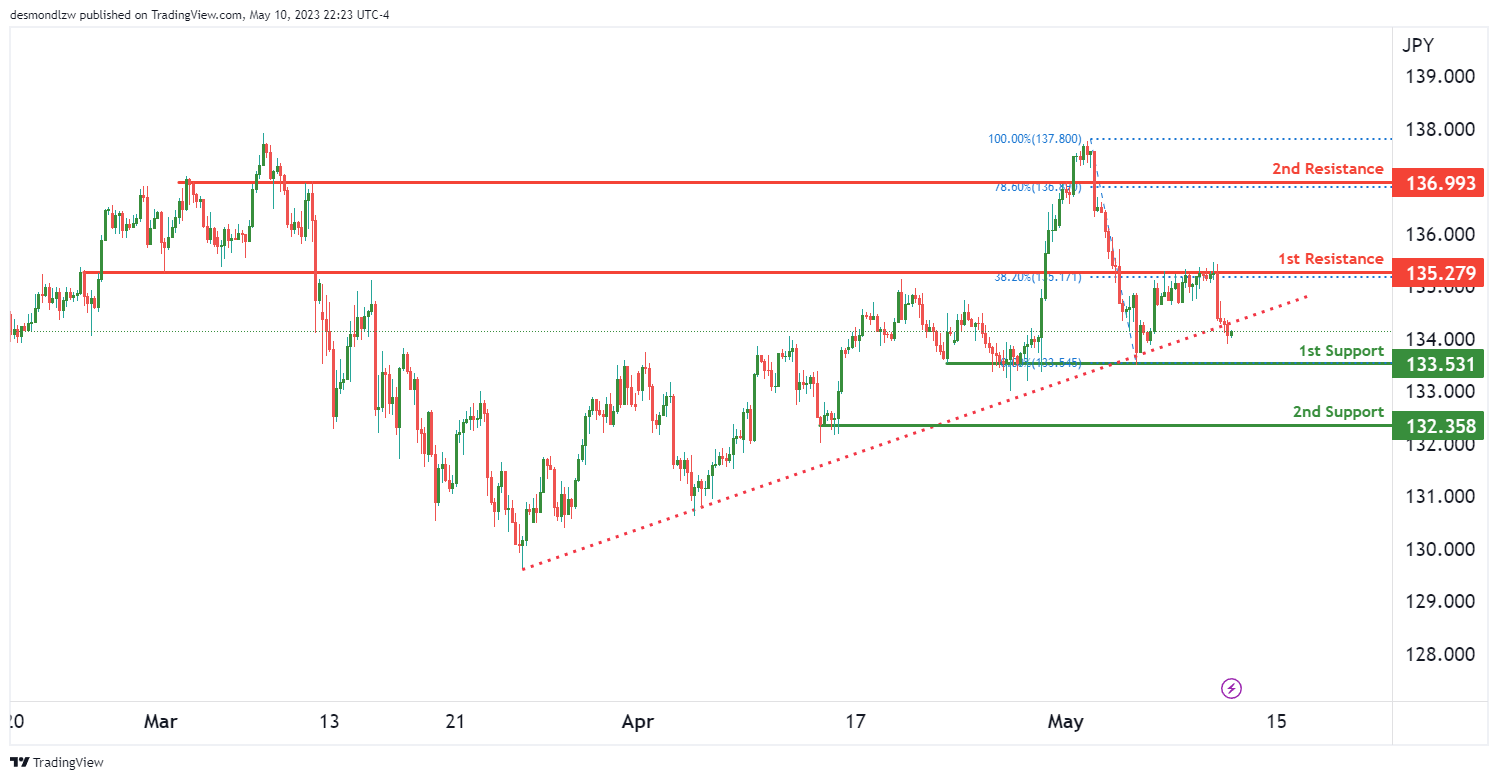
The USD/JPY chart is currently showing bearish momentum, with price having broken below an ascending support line, triggering a potential bearish move.
If this bearish momentum were to continue, price could potentially drop towards the 1st support level at 133.53, which is a multi-swing low support level. If price were to break through this support level, it could potentially drop further towards the 2nd support level at 132.35, which is also a multi-swing low support level.
On the resistance side, the 1st resistance level is at 135.27, which is an overlap resistance level and coincides with a 38.20% Fibonacci retracement. If price were to rise from the current level, it could potentially encounter resistance at this level.
The 2nd resistance level is at 136.99 and is also an overlap resistance level, coinciding with a 78.60% Fibonacci retracement. If price were to rise past the 1st resistance level, it could potentially encounter resistance at this level.
It’s worth noting that the USD/JPY chart is currently showing bearish momentum, with price potentially continuing its bearish trend towards the 1st support level.
AUD/USD:
The AUD/USD chart is currently showing bullish momentum, with price above a major ascending trend line suggesting further bullish momentum is on the cards.
If this bullish momentum were to continue, price could potentially rise towards the 1st resistance level at 0.6822, which is an overlap resistance level and coincides with a 127.20% Fibonacci extension. If price were to break through this resistance level, it could potentially rise further.
On the support side, the 1st support level is at 0.6749, which is an overlap support level and coincides with a 23.60% Fibonacci retracement. If price were to drop from the current level, it could potentially find support at this level.
The 2nd support level is at 0.6703, which is also an overlap support level and coincides with a 50% Fibonacci retracement. If price were to drop further, it could potentially find support at this level.
There is also an intermediate resistance level at 0.6793, which is a pullback resistance level. If price were to rise from the current level, it could potentially encounter resistance at this level.
It’s worth noting that the AUD/USD chart is currently showing bullish momentum, with price potentially rising towards the 1st resistance level.
NZD/USD
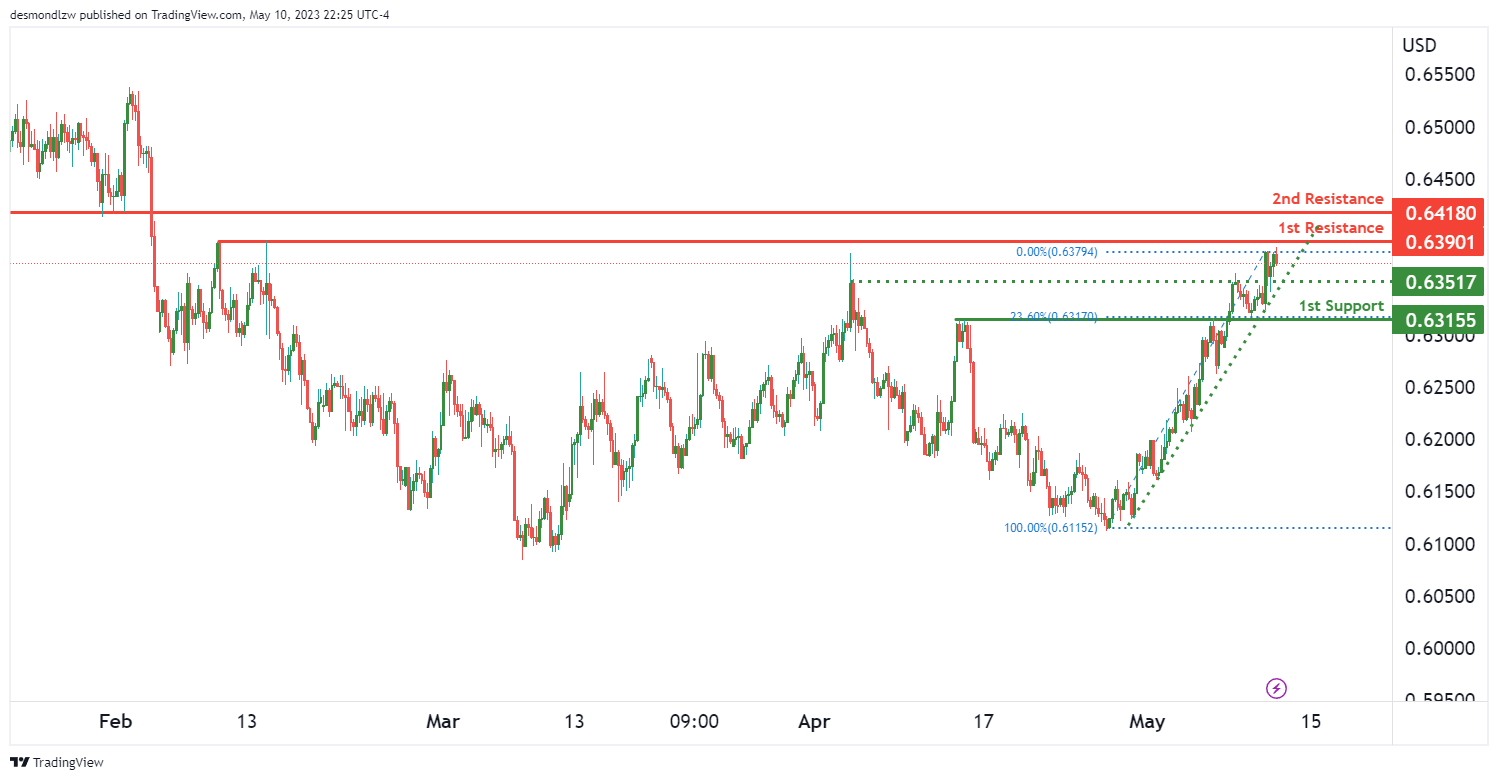
The NZD/USD chart is displaying a bullish momentum as the price is currently above a major ascending trend line, suggesting further potential bullish movement.
If this bullish trend continues, the price may have the potential to surpass the 1st resistance level at 0.6390, which is a multi-swing high resistance level, and potentially rise towards the 2nd resistance level at 0.6418, identified as a pullback resistance level.
For support levels, the 1st support level at 0.6315 is an overlap support level coinciding with a 23.60% Fibonacci retracement. Should the price drop from the current level, this level may provide potential support.
Additionally, an intermediate support level at 0.6351, identified as an overlap support level, may provide potential support if the price drops further.
.
USD/CAD:
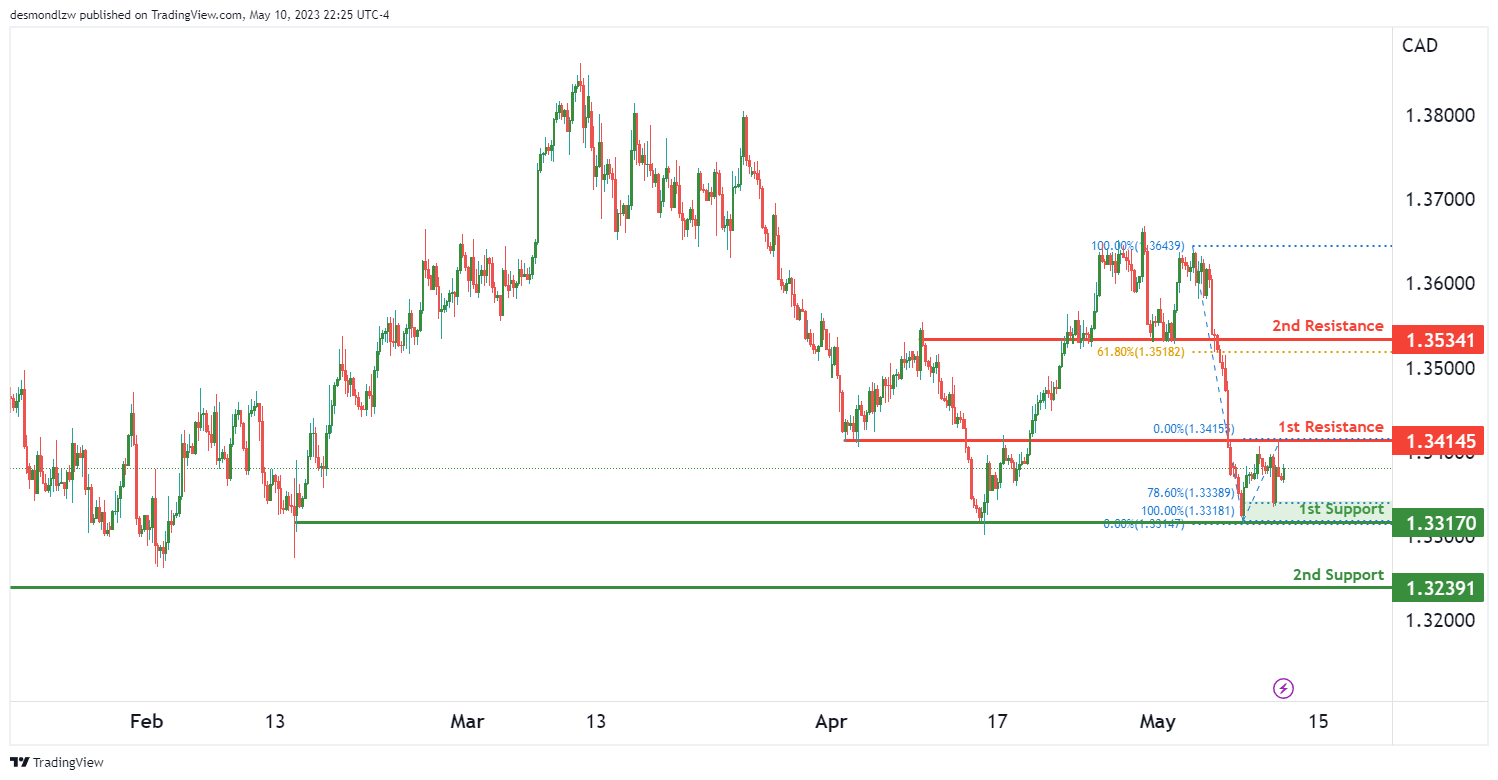
The USD/CAD chart currently displays neutral momentum, with price potentially fluctuating between the 1st resistance and 1st support levels.
On the support side, the 1st support level is at 1.3317, which is an overlap support level and coincides with a 78.60% Fibonacci retracement. This level may potentially provide support if the price were to drop.
An intermediate support level is also present at 1.3239, which is a swing low support level that may provide support if the price were to drop further.
For resistance levels, the 1st resistance level is at 1.3414, identified as an overlap resistance level. If the price were to rise, this level may potentially provide resistance.
There is also a 2nd resistance level at 1.3534, identified as a pullback resistance level, coinciding with a 61.80% Fibonacci retracement. This level may potentially provide stronger resistance if the price were to rise further.
DJ30:
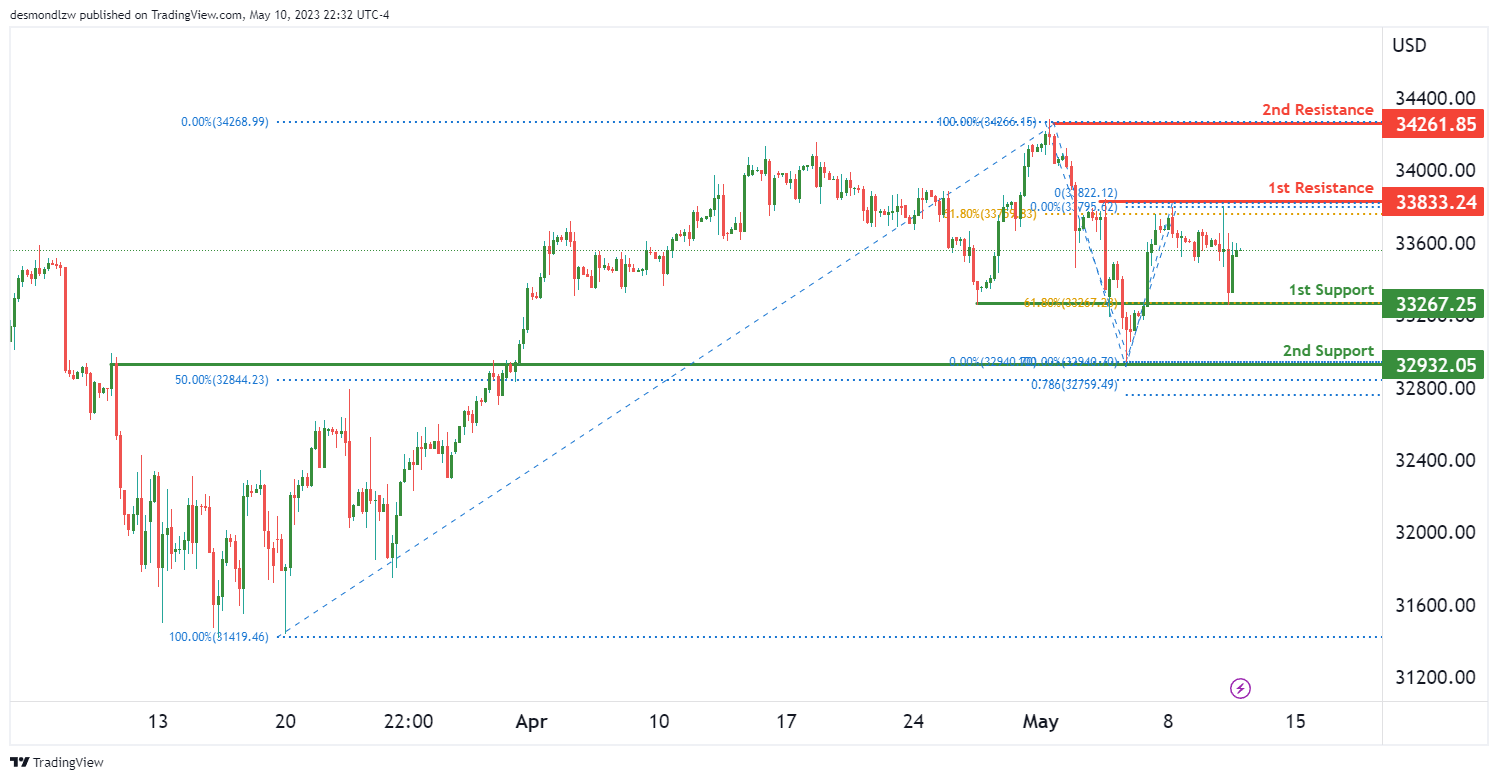
The DJ30 chart is currently showing a potential for a bullish continuation towards the 1st resistance level.
On the support side, the 1st support level is at 33267.25, which is an overlap support level and coincides with a 61.80% Fibonacci retracement. This level may potentially provide support if the price were to drop.
Another support level is present at 32932.05, which is an overlap support level coinciding with a 50% Fibonacci retracement and a 78.60% Fibonacci projection. This level shows Fibonacci confluence and may provide stronger support.
For resistance levels, the 1st resistance level is at 33833.24, identified as a multi-swing high resistance level, coinciding with a 61.80% Fibonacci retracement. If the price were to rise, this level may potentially provide resistance.
Another resistance level is present at 34261.85, identified as a swing high resistance level and coinciding with a 61.80% Fibonacci retracement. This level may potentially provide stronger resistance if the price were to rise further.
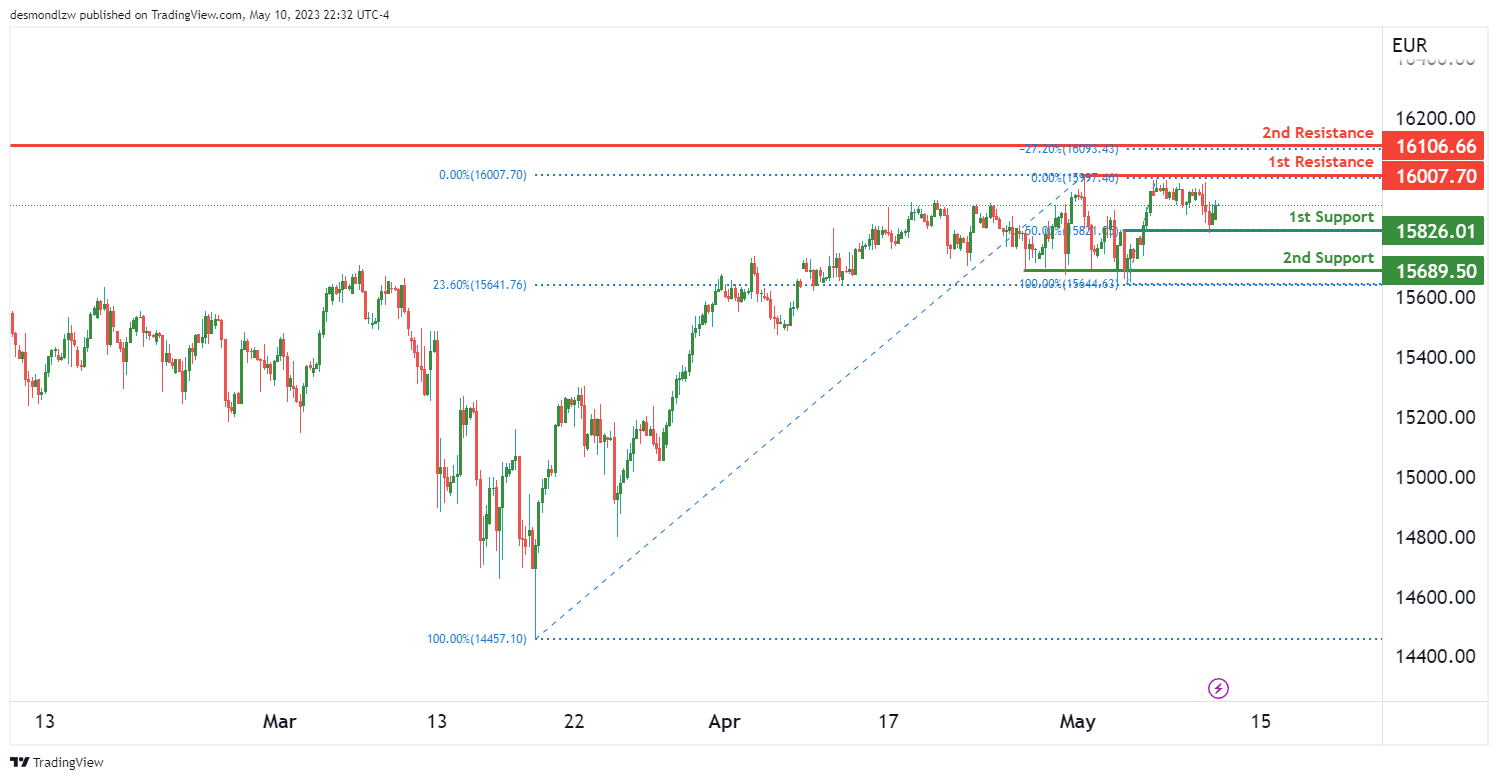
GER30:
The GER30 chart currently shows bullish momentum, with price potentially making a bullish continuation towards the 1st resistance level at 16007.70, which is a multi-swing high resistance level.
On the support side, the 1st support level is at 15826.01, which is an overlap support level and coincides with a 50% Fibonacci retracement. If price were to drop from the current level, it could potentially find support at this level.
There is also a second support level at 15689.50, which is a multi-swing low support level and coincides with a 23.60% Fibonacci retracement. If price were to drop further, it could potentially find support at this level.
It’s worth noting that the GER30 chart currently shows bullish momentum, with price potentially continuing towards the 1st resistance level. The 2nd resistance level is at 16106.66, which is a swing high resistance level and coincides with a -27% Fibonacci expansion.
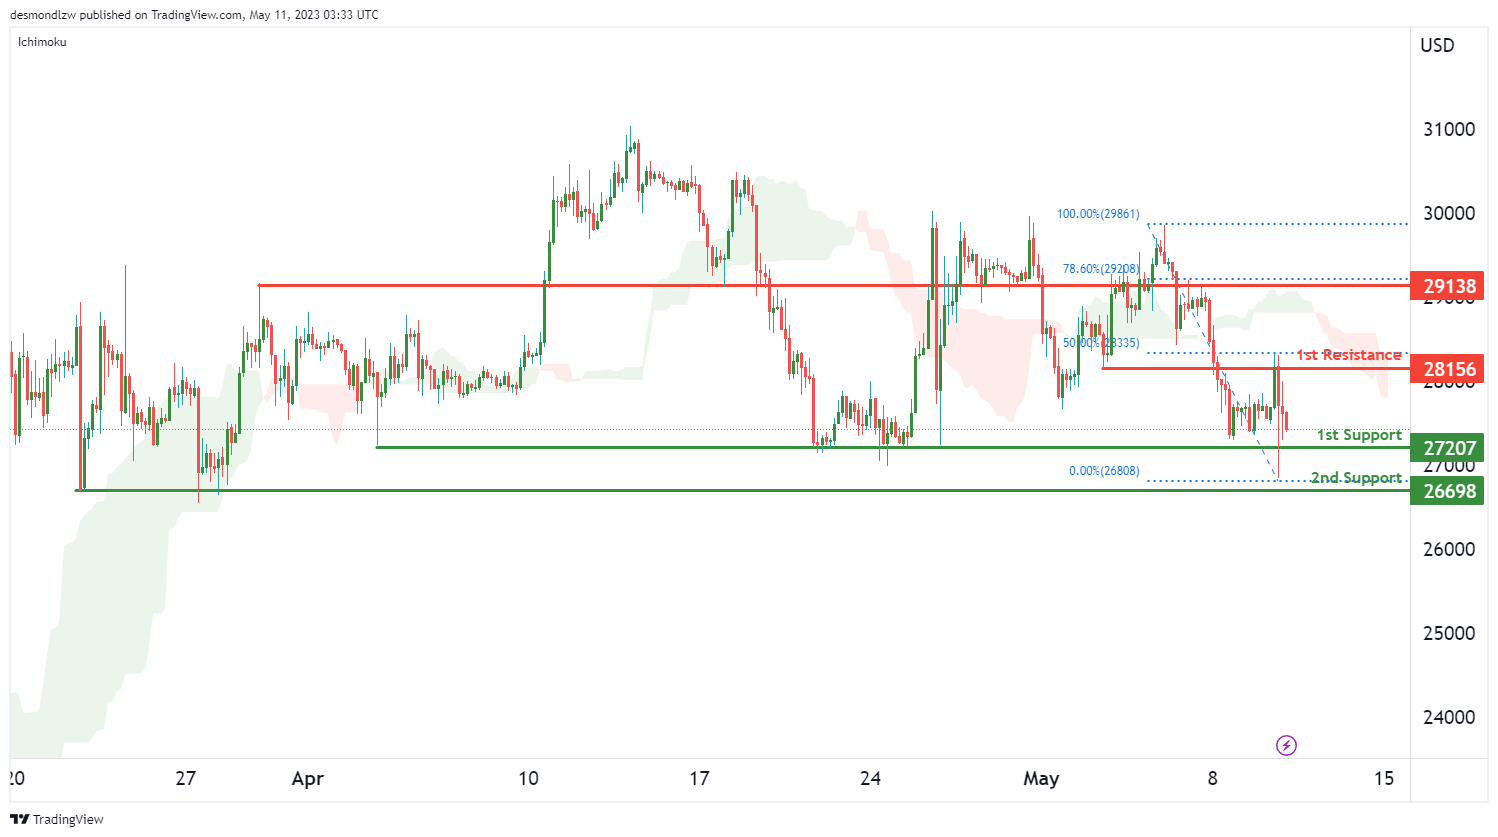
BTC/USD:
The BTC/USD chart is currently showing bearish momentum, with price below the bearish Ichimoku cloud. If this bearish momentum were to continue, price could potentially make a bearish continuation towards the 1st support level at 27207, which is a multi-swing low support level.
If price were to drop further, it could potentially find support at the 2nd support level at 26698, which is also a multi-swing low support level. On the resistance side, the 1st resistance level is at 28156, which is an overlap resistance level and coincides with a 50% Fibonacci retracement.
If price were to rise from the current level, it could potentially encounter resistance at this level. The 2nd resistance level is at 29138, which is also an overlap resistance level and coincides with a 78.60% Fibonacci retracement. If price were to continue rising from the current level, it could potentially encounter resistance at this level.
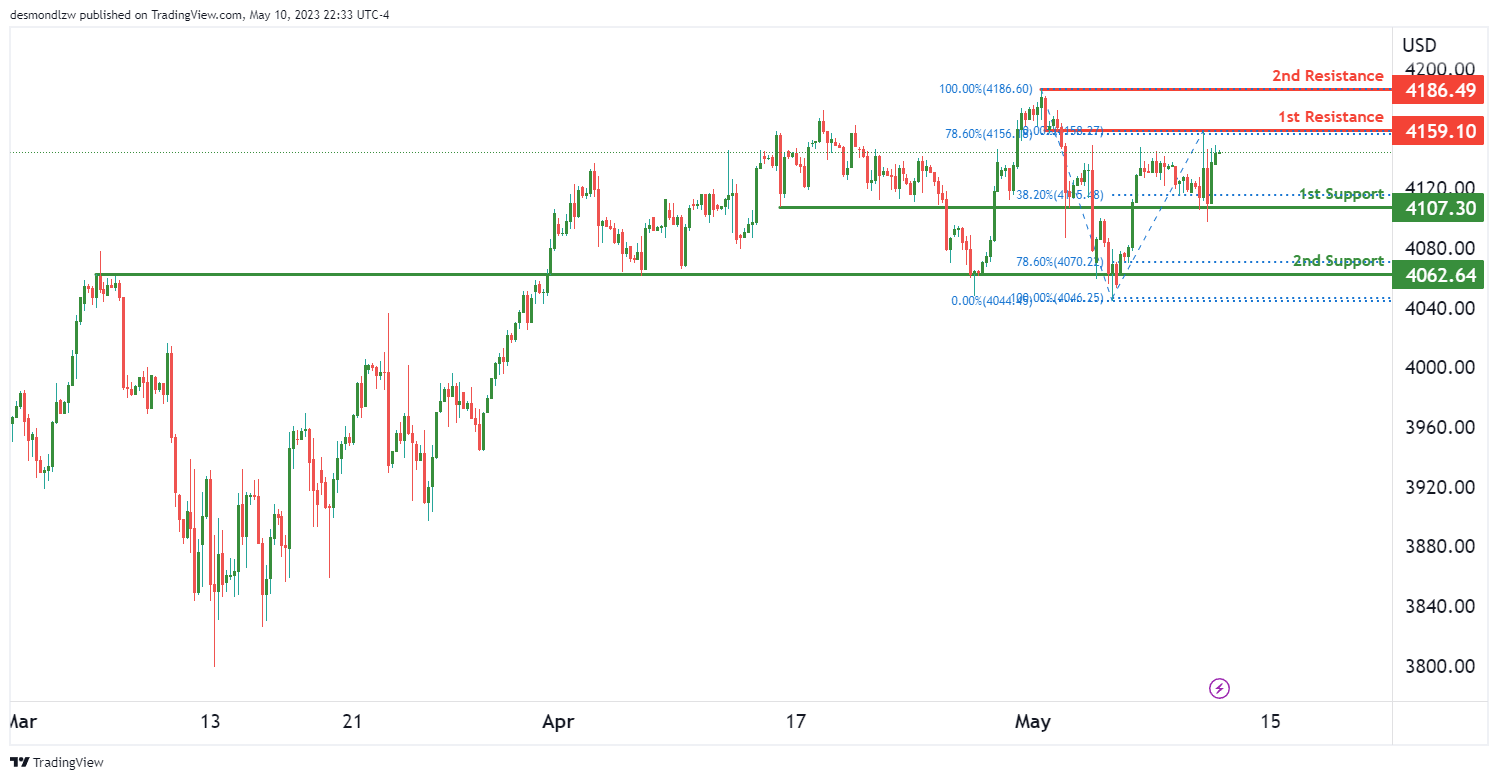
US500
The USD500 chart is currently showing bullish momentum, with the potential for a bullish continuation towards the 1st resistance level.
On the support side, the 1st support level is at 4107.30, which is an overlap support level and coincides with a 38.20% Fibonacci retracement. If price were to drop from the current level, it could potentially find support at this level. There is also a 2nd support level at 4062.64, which is an overlap support level and coincides with a 78.60% Fibonacci retracement. If price were to drop further, it could potentially find support at this level.
On the resistance side, the 1st resistance level is at 4159.10, which is an overlap resistance level and coincides with a 78.60% Fibonacci retracement. If price were to continue its bullish momentum, it could potentially break through this level and rise towards the 2nd resistance level at 4186.49, which is a swing high resistance level.
Overall, the USD500 chart is currently showing bullish momentum, with the potential for a bullish continuation towards the 1st resistance level.
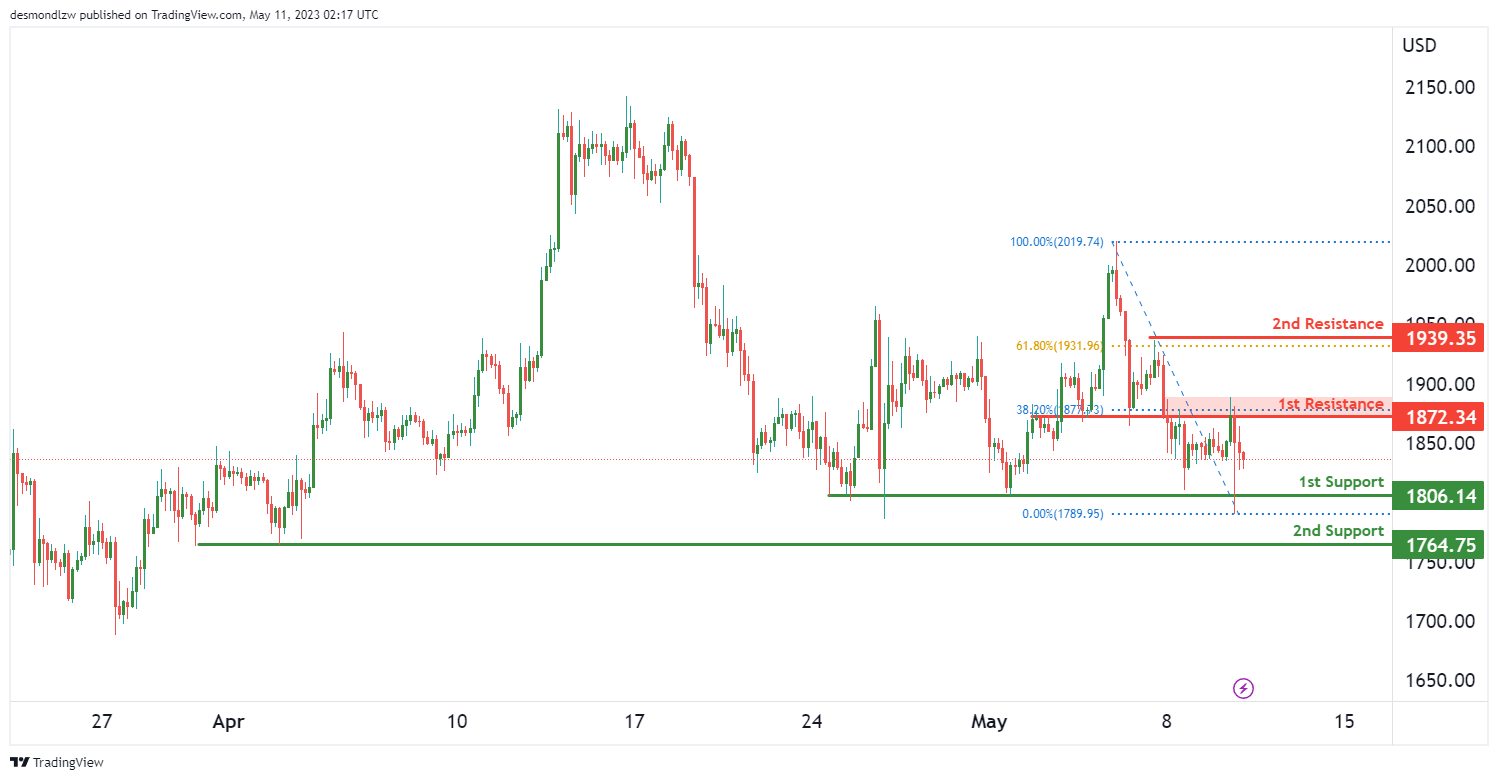
ETH/USD:
The ETH/USD pair is showing bearish momentum, with the potential for a bearish continuation towards the 1st support level.
The 1st support level is at 1806.14, which is a multi-swing low support level. If the price were to drop from the current level, it could potentially find support at this level.
There is also a 2nd support level at 1764.75, which is also a multi-swing low support level. If the price were to drop further, it could potentially find support at this level.
On the resistance side, the 1st resistance level is at 1872.34, which is an overlap resistance level and coincides with a 38.20% Fibonacci retracement level. If the price were to rise from the current level, it could potentially face resistance at this level.
There is also a 2nd resistance level at 1939.35, which is a swing high resistance level and coincides with a 61.80% Fibonacci retracement level. If the price were to continue rising, it could potentially face resistance at this level.
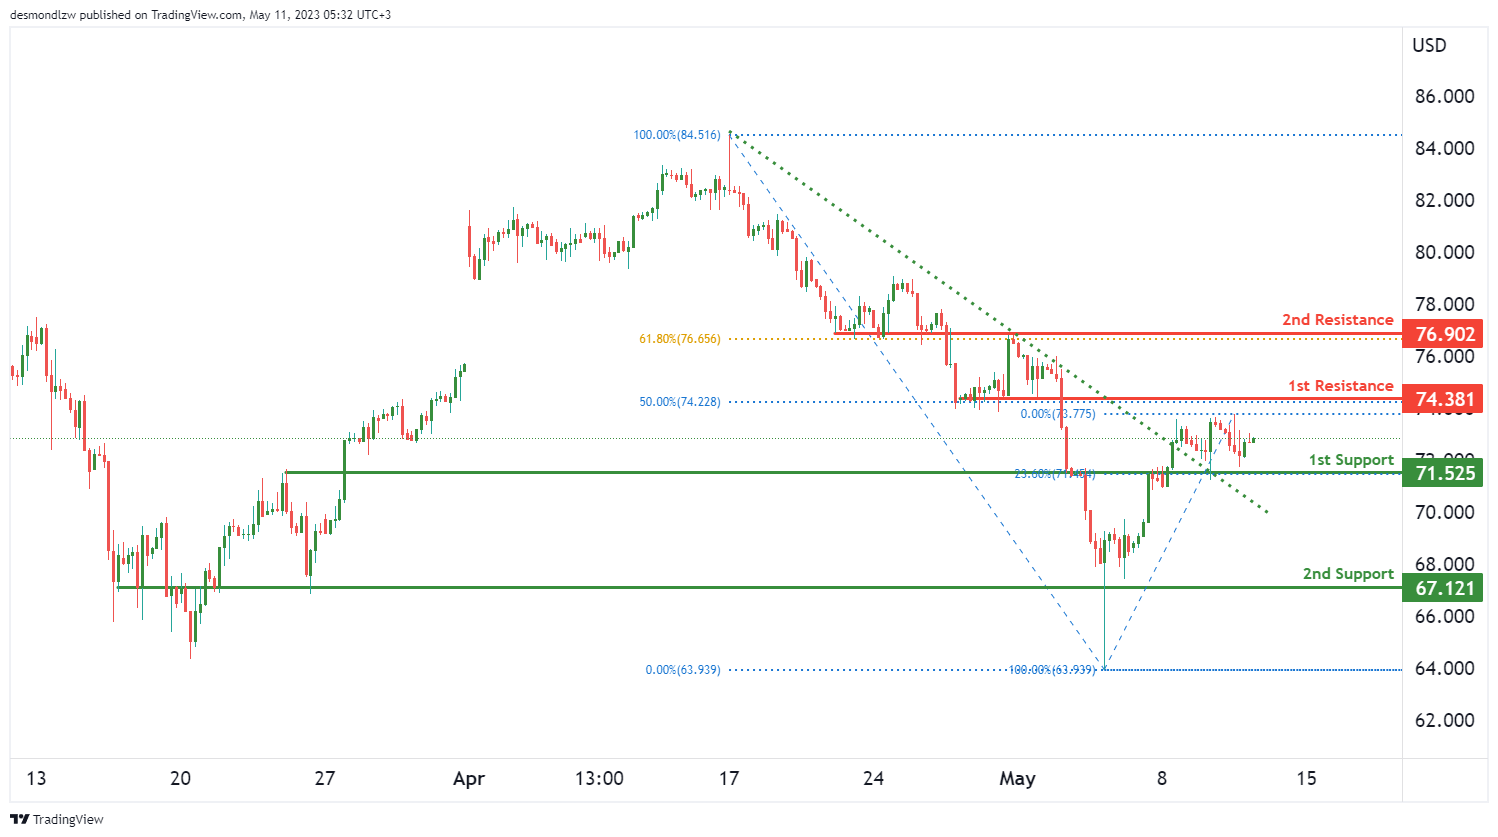
WTI/USD:
The WTI chart currently shows bullish momentum. The factors contributing to this momentum are that the price has broken above a descending resistance line, triggering a potential bullish move, and is currently on an ascending trend line which acts as support.
If this bullish momentum were to continue, the price could potentially make a bullish continuation towards the 1st resistance level at 74.38, which is a pullback resistance level and coincides with a 50% Fibonacci retracement.
On the support side, the 1st support level is at 71.52, which is an overlap support level and coincides with a 23.60% Fibonacci retracement. If the price were to drop from the current level, it could potentially find support at this level.
There is also a second support level at 67.12, which is an overlap support level. If the price were to drop further, it could potentially find support at this level.
It’s worth noting that the WTI chart currently shows bullish momentum and could potentially continue to rise towards the 1st resistance level at 74.38.
.
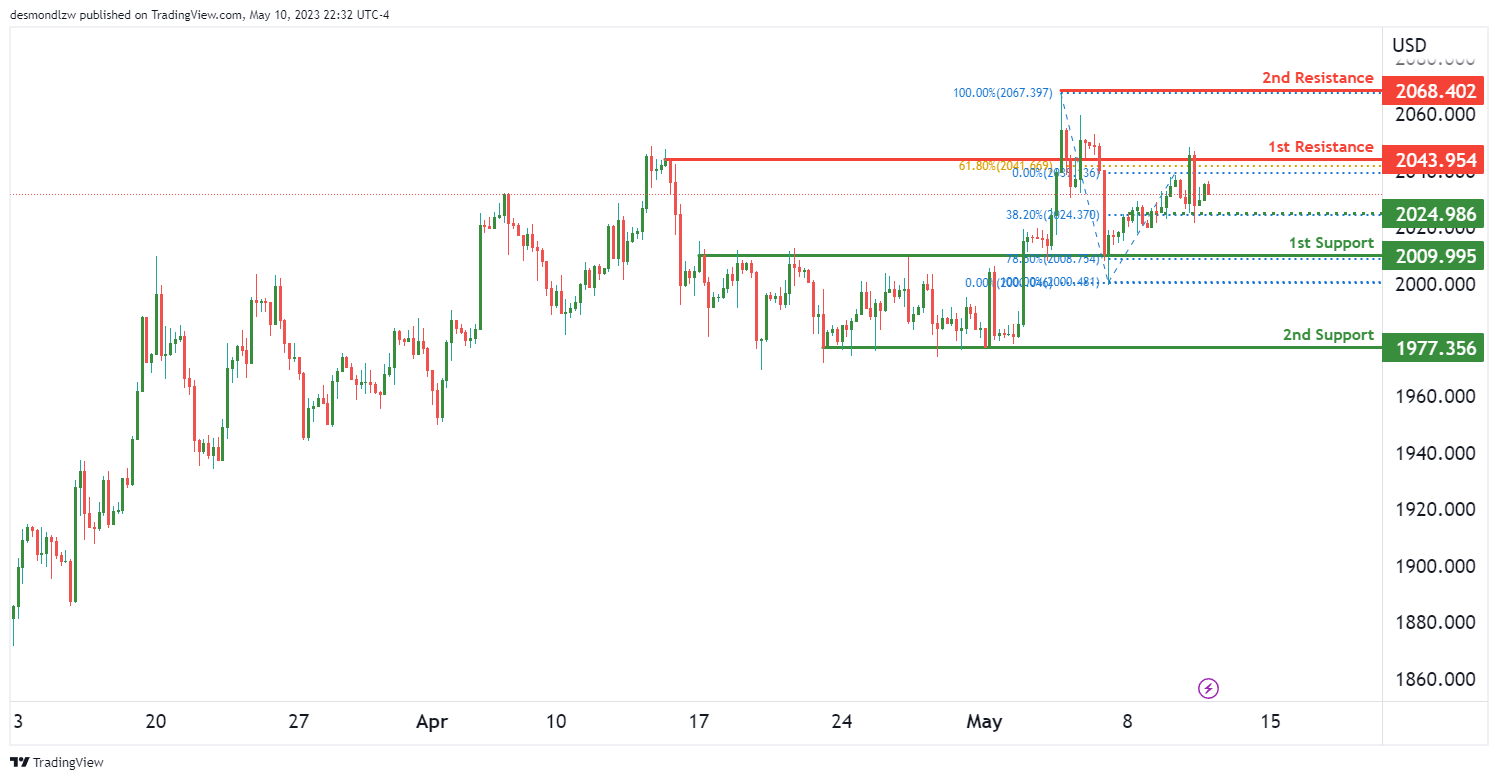
XAU/USD (GOLD):
The XAU/USD chart is currently showing bearish momentum, with price potentially continuing in that direction towards the 1st support level at 2009.99, which is an overlap support level and coincides with the 78.60% Fibonacci retracement. If price were to drop further, it could potentially find support at the 2nd support level at 1977.35, which is a multi-swing low support level.
On the resistance side, the 1st resistance level is at 2043.95, which is an overlap resistance level and coincides with the 61.80% Fibonacci retracement. If price were to rise from the current level, it could potentially face resistance at this level.
There is also a 2nd resistance level at 2068.40, which is a swing high resistance level and coincides with the 38.20% Fibonacci retracement. If price were to continue to rise, it could potentially face resistance at this level.
It’s worth noting that there is an intermediate support level at 2024.98, which is a pullback support level. If price were to drop from the current level, it could potentially find support at this level.
The accuracy, completeness and timeliness of the information contained on this site cannot be guaranteed. IC Markets does not warranty, guarantee or make any representations, or assume any liability regarding financial results based on the use of the information in the site.
News, views, opinions, recommendations and other information obtained from sources outside of www.icmarkets.com, used in this site are believed to be reliable, but we cannot guarantee their accuracy or completeness. All such information is subject to change at any time without notice. IC Markets assumes no responsibility for the content of any linked site.
The fact that such links may exist does not indicate approval or endorsement of any material contained on any linked site. IC Markets is not liable for any harm caused by the transmission, through accessing the services or information on this site, of a computer virus, or other computer code or programming device that might be used to access, delete, damage, disable, disrupt or otherwise impede in any manner, the operation of the site or of any user’s software, hardware, data or property.


