
Key risk events today:
SNB Financial Stability Report; Eurogroup Meetings; US Core PPI m/m and PPI m/m; US Unemployment Claims.
(Previous analysis as well as outside sources – italics).
EUR/USD:
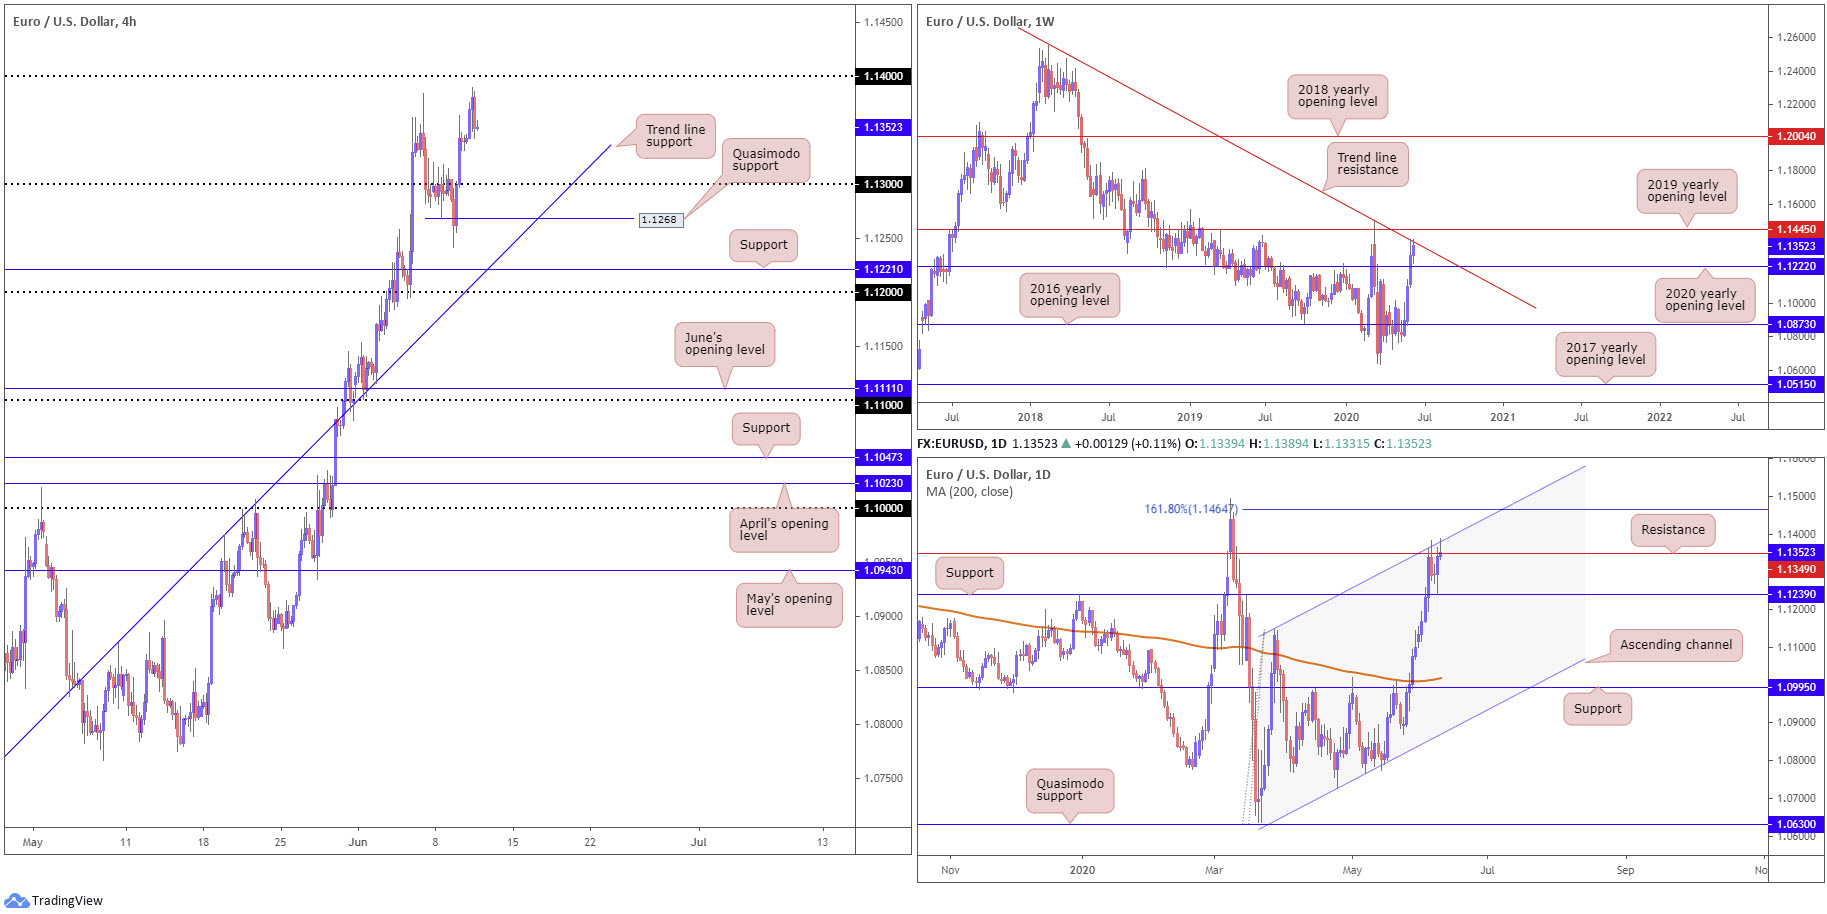
Fuelled by additional USD shorts, EUR/USD climbed to highs at 1.1389 Wednesday, levels not seen since early March. Leaving 1.14 unchallenged, buyers hit the ropes as the pair dived to lows at 1.1342. 1.13 remains a standout support on the H4 timeframe, sharing space with Quasimodo support at 1.1268 and trend line support, extended from the low 1.0727.
Having dipped a toe in waters above resistance at 1.1349, daily price movement also shook hands with channel resistance yesterday, taken from the high 1.1147, and is on track to produce a shooting star candlestick pattern. In conjunction with the daily timeframe, weekly price currently faces long-standing trend line resistance, stretched from the high 1.2555. Price trading lower from here has 1.1222 in sight (2020 yearly opening level). Further upside, though, could have the unit cross swords with the 2019 yearly opening level at 1.1445.
Areas of consideration:
The robust H4 bearish candle chalked up under 1.14 has drew attention, owing to the buy-stops tripped above Friday’s high at 1.1383 and, of course, given where we’re trading from on the weekly and daily timeframes right now.
This is likely to be considered a countertrend trade, with sellers targeting 1.13 as the initial port of call. As for protective stop-loss orders, many will be looking at territory above 1.14.
GBP/USD:
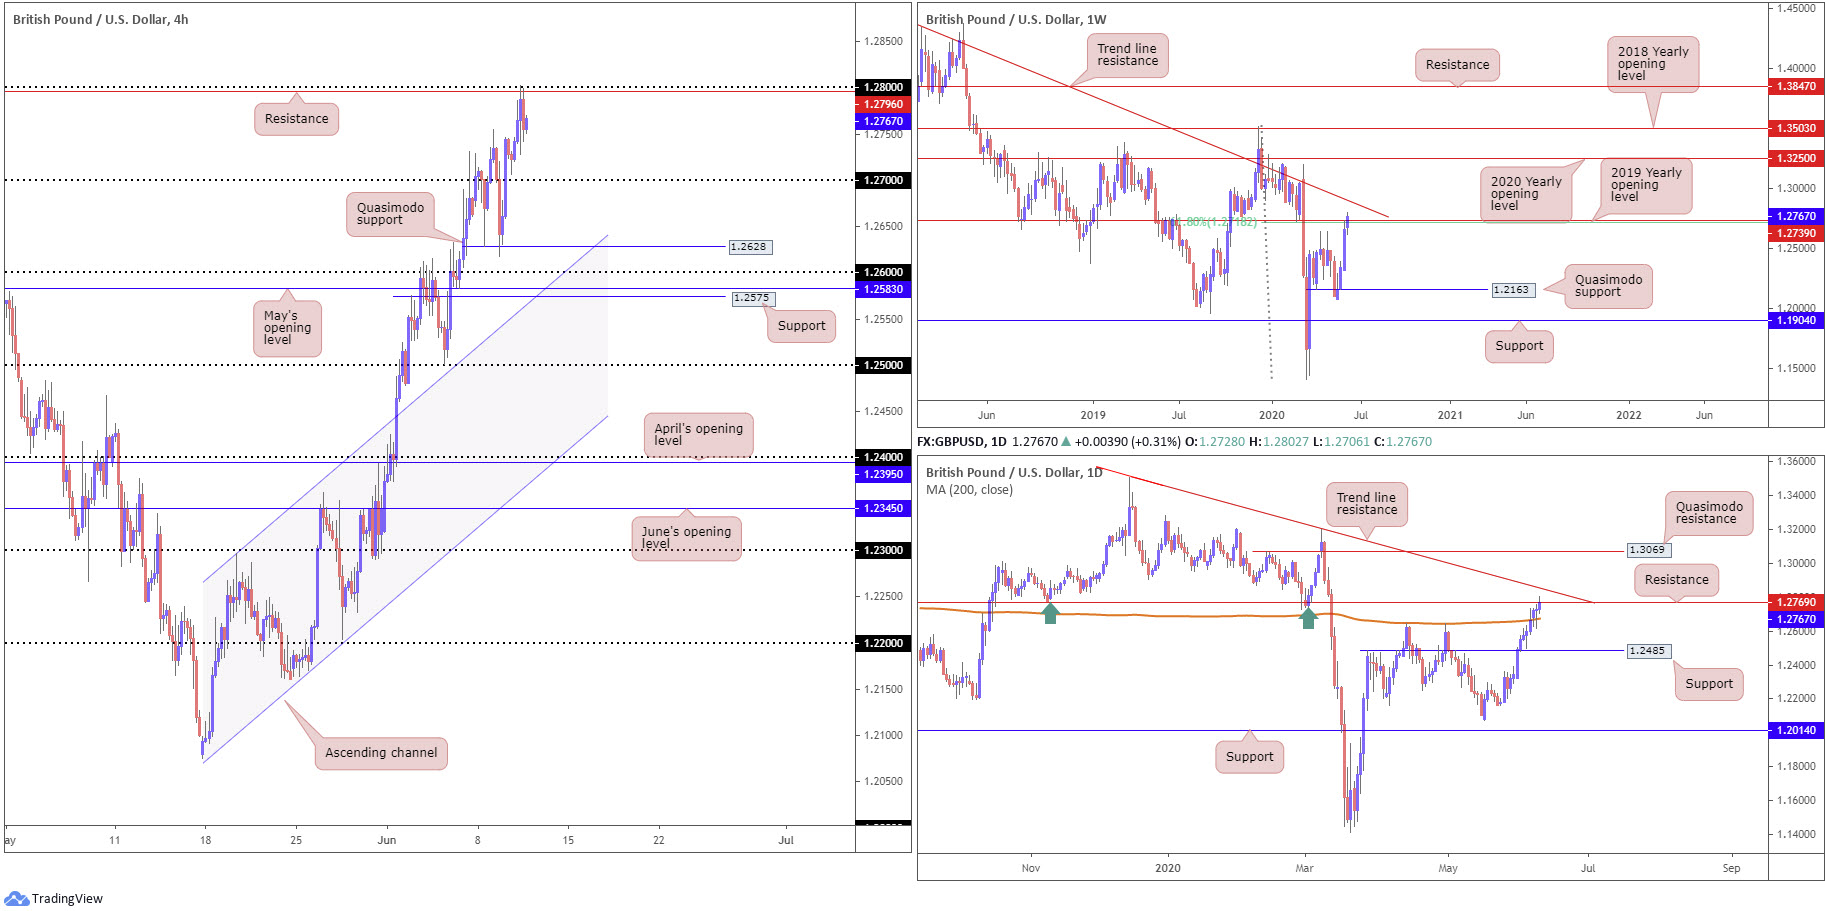
Cable put forward its tenth consecutive daily gain into London’s close Wednesday, led higher on the back of USD softness.
H4 stroked 1.28 and resistance close by at 1.2796 (prior Quasimodo support), retreating to the 1.2750s. This shines the headlights on 1.27 as possible support today, in the event sellers remain in the driving seat. Also, breaching 1.27 unlocks the risk of further declines to Quasimodo support at 1.2628 and channel resistance-turned support, etched from the high 1.2296.
The key observation on the weekly timeframe is price took on the 61.8% Fibonacci retracement ratio at 1.2718 and the 2019 yearly opening level at 1.2739 in recent movement. Continued bidding may see price welcome trend line resistance, extended from the high 1.5930.
Daily price continues to observe an upside bias after establishing support off the 200-day SMA (orange – 1.2674), with yesterday knocking on the door of resistance at 1.2769. This level, as highlighted in previous technical reports, could put a lid on gains owing to its history as a support/resistance level, dating as far back as September 2017. Though breaking higher places trend line resistance in the firing line, taken from the high 1.3514.
Areas of consideration:
Some traders will be interested in shorting the rejection off 1.28, likely due to converging H4 and daily resistance, eyeing 1.27 as a take-profit target. The other side of the table, however, will have traders betting on a breakout above 1.28, backed by weekly price establishing a reasonably firm position north of the 2019 yearly opening level at 1.2739. Above 1.28, according to the higher timeframes, we have room to reach 1.2855ish: the daily trend line resistance, followed by weekly trend line resistance around 1.29.
AUD/USD:
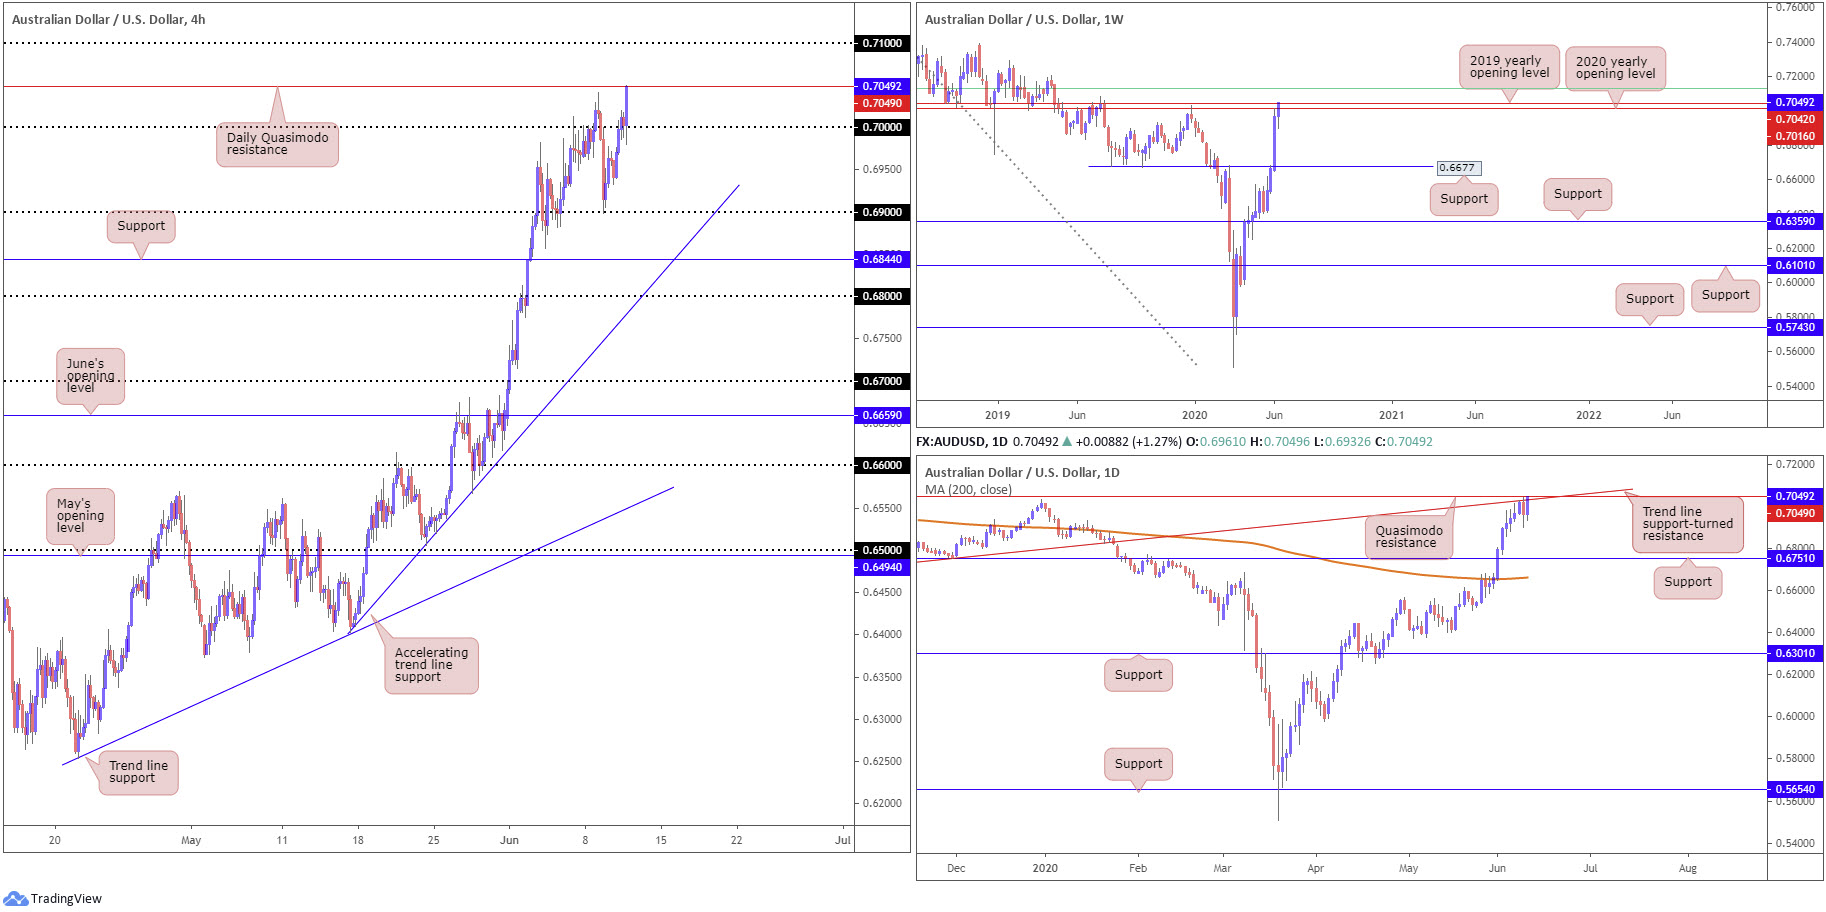
The weekly timeframe’s vibe continues to echo a strong bullish tone, despite facing considerable resistance in the shape of the 2020 yearly opening level and the 2019 yearly opening level at 0.7016 and 0.7042, respectively. Lifting higher from here could see buyers run into additional resistance by way of the 61.8% Fibonacci retracement ratio at 0.7128 (green).
Interestingly, daily price is also seen engaging with trend line support-turned resistance, taken from the low 0.6670, and Quasimodo resistance nearby at 0.7049 (also marked on the H4 timeframe). Additional bullish sentiment draws another Quasimodo resistance into the frame at 0.7168, quite a distance above the weekly 61.8% Fib level.
H4, following a dip into orders at the key figure 0.70 into early US hours Wednesday, is currently seen testing the waters around the daily Quasimodo resistance mentioned above at 0.7049 after breaching 0.7041, Tuesday’s session high. Clearance of daily orders on the H4 scale throws 0.71 into the pot as potential resistance to be mindful of today.
Areas of consideration:
While current action is one-sided, favouring a continuation to the upside, prudent traders are aware of higher-timeframe resistances in play. Combined, these levels could force buyers on the ropes and back to the 0.70 region. A decisive H4 close back under 0.70, however, would likely be needed before countertrend sellers commit.
Should we climb to 0.71, nevertheless, note that directly above this angle the pair has the 61.8% Fibonacci retracement ratio at 0.7128 in sight, plotted on the weekly timeframe. This could hamper breakout buying, causing a bull trap.
USD/JPY:
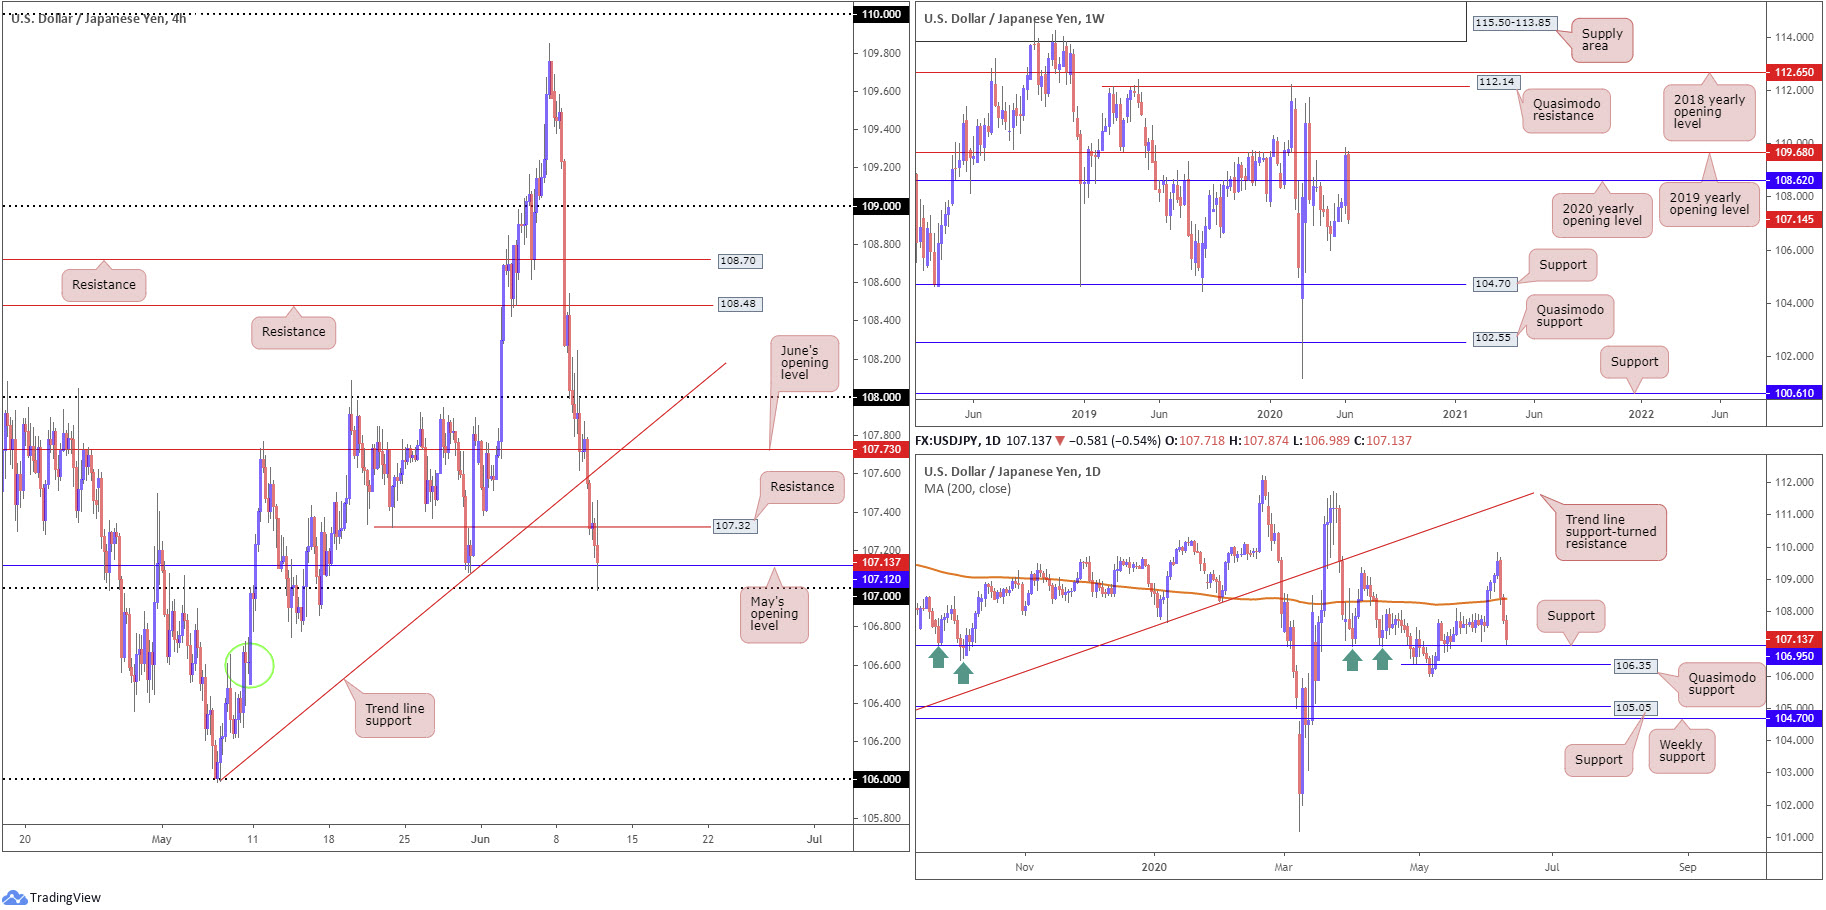
The US dollar pencilled in its third daily decline against the Japanese yen Wednesday, erasing 0.6%.
Down 2.3% on the week so far and erasing all of the prior week’s gains, weekly price, after firmly rejecting the 2019 yearly opening level at 109.68, cruised through the 2020 yearly opening level at 108.62, shifting focus to the 105.98 6th May low as the next downside target.
The landscape on the daily timeframe had the pair dip its toes under the 200-day SMA (orange – 108.40) Tuesday, tossing price towards support at 106.95 yesterday, closely followed by Quasimodo support at 106.35.
Sellers based on the H4 timeframe made quick work of June’s opening level at 107.73, as supply swarmed the base into European hours Wednesday. Follow-through movement ousted trend line support, taken from the low 105.99 and Quasimodo support posted at 107.32. This saw price surpass May’s opening level at 107.12 and test the 107 handle in recent hours. South of 107, demand is expected to occur around the 106.60ish region (green circle), with a break exposing the 106 base.
Areas of consideration:
The 107 handle is particularly appealing support today, having seen a close bond form with daily support at 106.95. Fakeouts through round numbers are common viewing, therefore a dip under 107 into daily support today may take shape before any serious recovery attempt is seen.
H4 closing beneath 107 is equally appealing, particularly if the move follows up with a retest at 107 that holds. Downside targets rest at H4 demand at 106.60, followed by daily Quasimodo support at 106.35 and then the 106 handle.
USD/CAD:
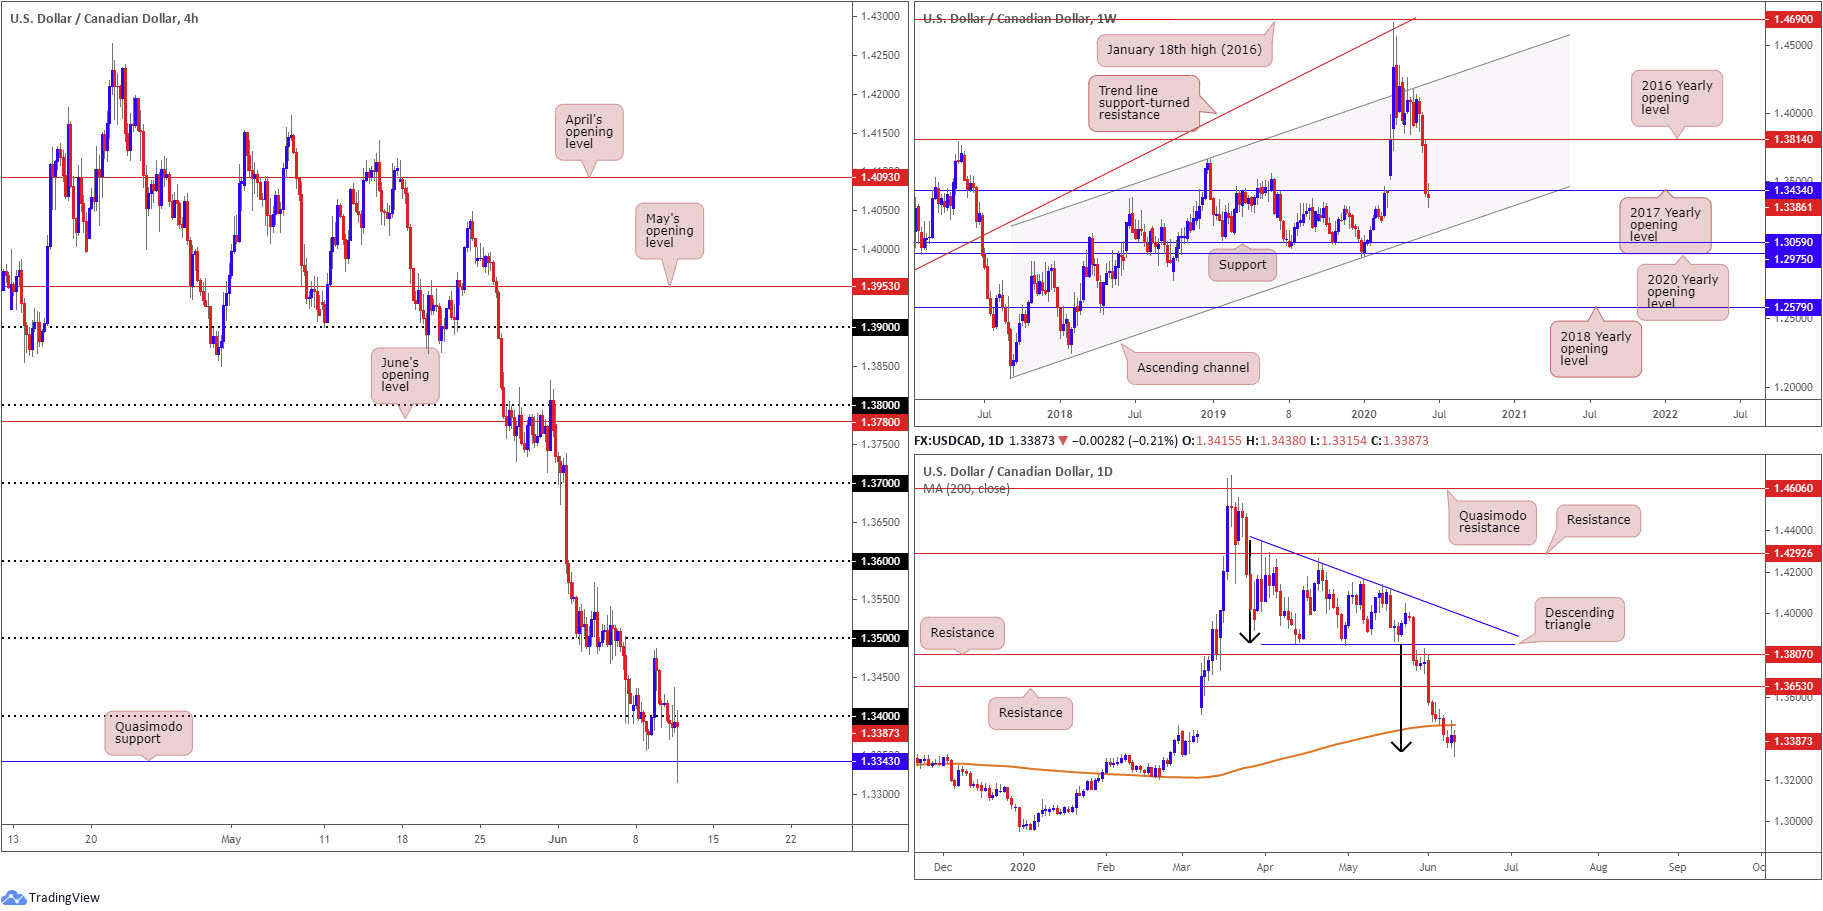
After retaking 1.34 to the downside Wednesday, H4 Quasimodo support elbowed its way into the spotlight at 1.3343, with price now tickling the underside of the aforementioned round number, as we write. According to the long-term trend, we are still bullish (weekly timeframe) we believe, though the medium-term trend points to further selling.
The technical landscape on the weekly timeframe reveals buyers and sellers battling for position a few pips under the 2017 yearly opening level at 1.3434. Right now, we’re seeing little generated from either side of the market, currently forming an indecision candle.
Meanwhile, on the daily timeframe, after cruising through the 200-day SMA (orange – 1.3465) and retesting the underside of the line as resistance on Tuesday, price spun into the descending triangle’s (between 1.4349 and 1.3855) take-profit base at 1.3332 (black arrows), completing the pattern. This, of course, could generate a wave of short covering today.
Areas of consideration:
With buyers and sellers battling for position around weekly support at 1.3434, effectively undecided, daily and H4 price have brought in supportive structure. This might clear offers out of 1.34 today and head for the 200-day SMA at 1.3465 and 1.3488 (Tuesday’s session high), followed by the 1.35 base.
Therefore, a H4 close back above 1.34 would be interesting, unlocking the trapdoor to potential buying opportunities, either as a breakout formation (entering long on the breakout candle’s close and tucking stops under its lower shadow) or on any retest seen at 1.34. Remember, though, entering long has you swimming alongside the longer-term trend, but at the same time against the medium-term trend.
USD/CHF:
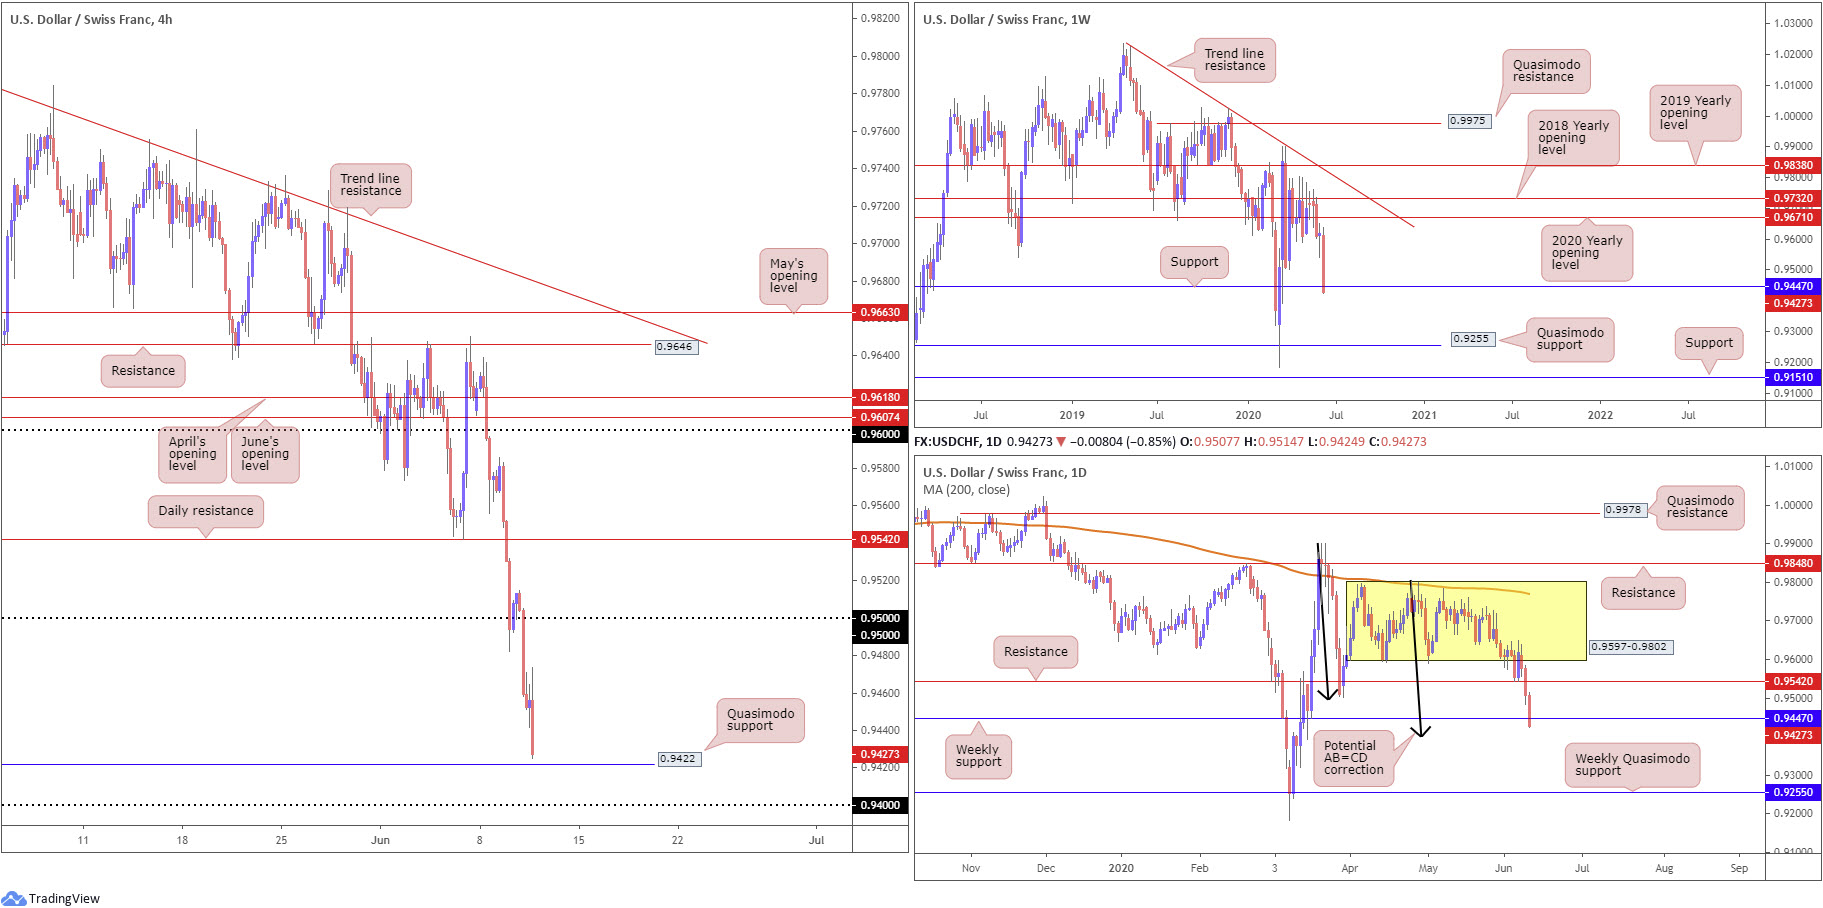
Broad dollar losses nudged USD/CHF to multi-month lows Wednesday, recording 2% losses on the week thus far and towing price marginally through 0.9447. The break of this weekly support has likely got sellers licking their lips in anticipation of further downside today. Yet, an AB=CD formation (black arrows) is in the process of completing its D-leg on the daily timeframe at 0.94.
Crossing over to the H4 timeframe we also have price steadying just north of Quasimodo support coming in at 0.9422, a level located ahead of the 0.94 handle. This follows Wednesday’s precipitous decline through 0.95, albeit after a half-hearted attempt at recovery. Note 0.94 on the H4 shares the same space with the AB=CD completion on the daily timeframe.
Areas of consideration:
As stated above, weekly price tunnelling through support at 0.9447 has likely excited sellers.
Nevertheless, buyers still have a hand in this fight, according to the H4 and daily timeframes. A fakeout through H4 Quasimodo support at 0.9422 into 0.94/ABCD daily support is likely sufficient to stimulate buyers today, perhaps enough to even tug price action back above weekly support, targeting 0.95 as an initial upside hurdle.
Dow Jones Industrial Average:
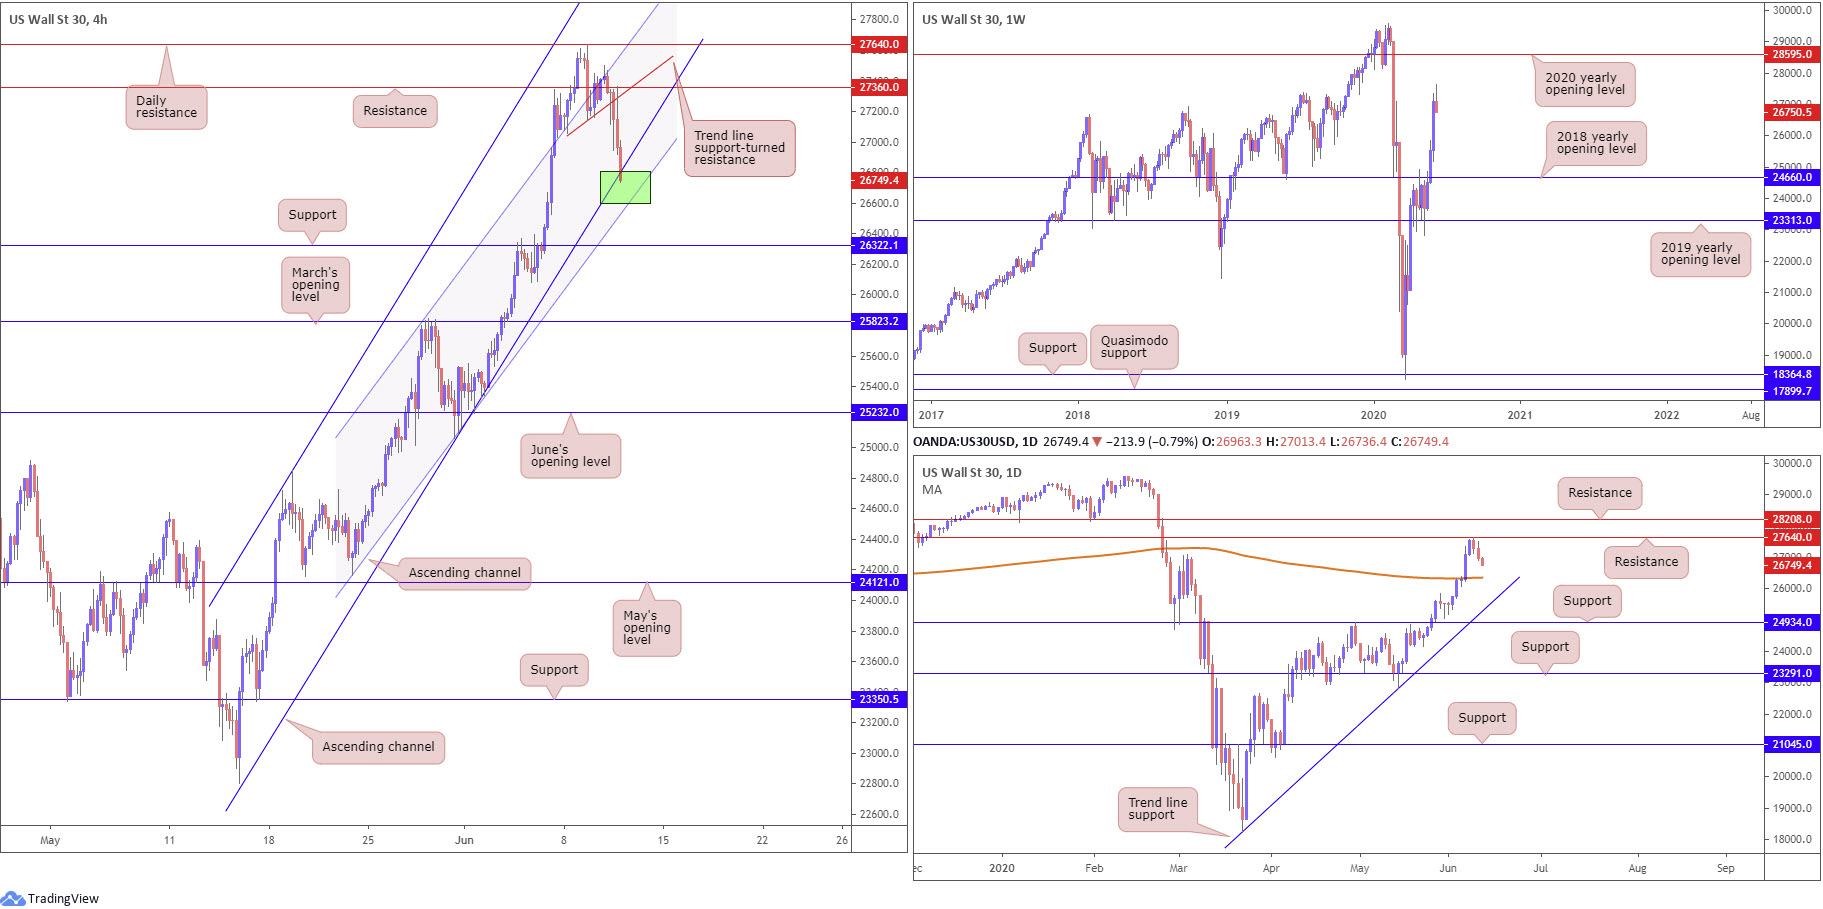
US equities tumbled for a second consecutive session Wednesday after the US Federal Reserve kept interest rates unchanged at 0.25%. The Fed also reiterated interest rates would be maintained through 2022, though did little to lift equities. The Dow Jones Industrial Average dropped 282.31 points, or 1.04%; the S&P 500 dipped 17.04 points, or 0.53%, while the tech-heavy Nasdaq 100 concluded higher by 127.08 points, or 1.28%.
After topping just south of daily resistance at 27640 Tuesday, Wednesday extended losses to lows at 26918 and threw the 200-day SMA (orange – 26360) in view as possible support, with a break exposing trend line support, taken from the low 18213.
From the weekly timeframe this morning, traders can see the 2020 yearly opening level at 28595 is, following three consecutive weeks of healthy gains, within reasonably close proximity, despite the recent pullback.
On the H4 timeframe, we recently elbowed through local trendline support, taken from the low 27053, and retested the level, along with resistance at 27360. This has since guided the candles towards channel support, drawn from the low 22803, followed by another channel support (24165). Beyond these levels we can see support resides at 26322.
Areas of consideration:
The two H4 channel supports (green) may prompt a recovery today, having seen the weekly timeframe showing room to nudge higher.
Should we break beneath the said H4 lines today, however, breakout sellers may want to tread carefully owing to the 200-day SMA lurking close by, followed by H4 support at 26322.
XAU/USD (GOLD):
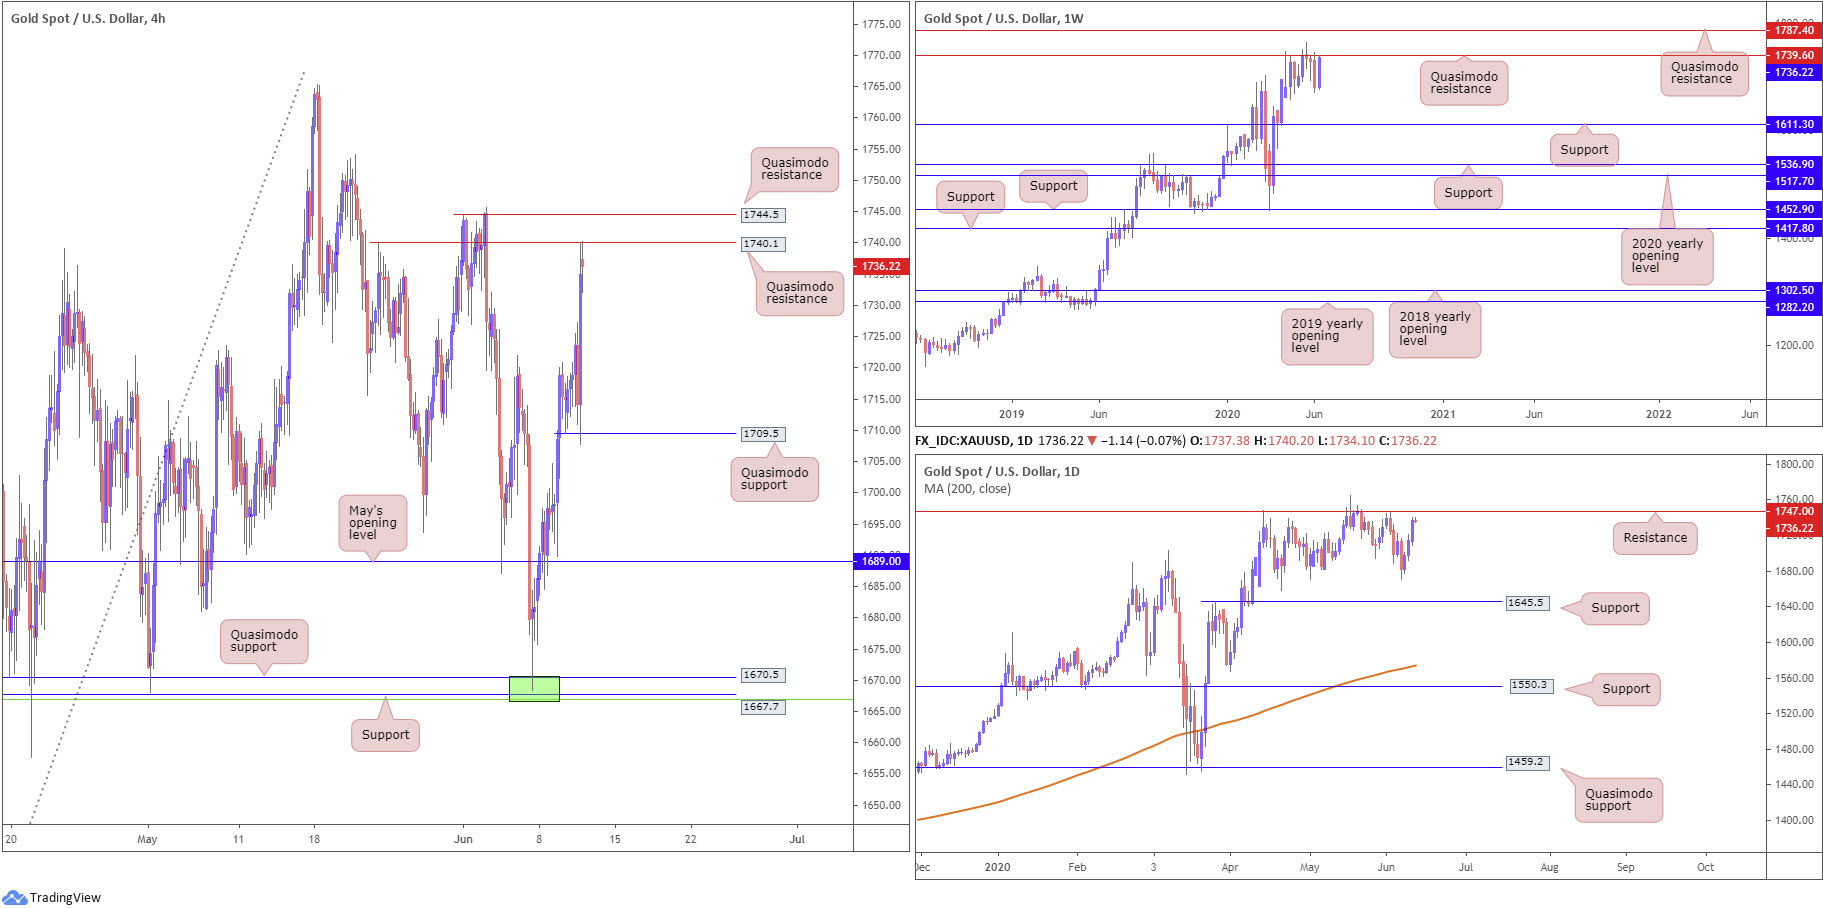
Recording its third consecutive daily gain Wednesday, bullion reached highs at 1739.9 and laid claim to Quasimodo resistance on the H4 timeframe at 1740.1, located south of another Quasimodo resistance at 1744.5. A turn lower from current price could see Quasimodo support at 1709.5 call for attention.
What’s also interesting is weekly price reconnected with a Quasimodo resistance level at 1739.6, sited under another layer of Quasimodo resistance at 1787.4. At the same time, daily price is fast approaching resistance coming in at 1747.0.
Areas of consideration:
Although the trend has faced north since 2016, another bump lower from resistances seen across weekly, daily and H4 timeframes is possible today, targeting H4 Quasimodo support at 1709.5 as an initial port of call. Sellers here will likely tuck protective stop-loss orders above 1745.5.
The accuracy, completeness and timeliness of the information contained on this site cannot be guaranteed. IC Markets does not warranty, guarantee or make any representations, or assume any liability regarding financial results based on the use of the information in the site.
News, views, opinions, recommendations and other information obtained from sources outside of www.icmarkets.com.au, used in this site are believed to be reliable, but we cannot guarantee their accuracy or completeness. All such information is subject to change at any time without notice. IC Markets assumes no responsibility for the content of any linked site.
The fact that such links may exist does not indicate approval or endorsement of any material contained on any linked site. IC Markets is not liable for any harm caused by the transmission, through accessing the services or information on this site, of a computer virus, or other computer code or programming device that might be used to access, delete, damage, disable, disrupt or otherwise impede in any manner, the operation of the site or of any user’s software, hardware, data or property.


