
A note on lower timeframe confirming price action…
Waiting for lower timeframe confirmation is our main tool to confirm strength within higher timeframe zones, and has really been the key to our trading success. It takes a little time to understand the subtle nuances, however, as each trade is never the same, but once you master the rhythm so to speak, you will be saved from countless unnecessary losing trades. The following is a list of what we look for:
- A break/retest of supply or demand dependent on which way you’re trading.
- A trendline break/retest.
- Buying/selling tails/wicks – essentially we look for a cluster of very obvious spikes off of lower timeframe support and resistance levels within the higher timeframe zone.
- Candlestick patterns. We tend to only stick with pin bars and engulfing bars as these have proven to be the most effective.
We search for lower timeframe confirmation between the M15 and H1 timeframes, since most of our higher-timeframe areas begin with the H4. Stops are usually placed 5-10 pips beyond confirming structures.
EUR/USD:
Boosted by an overall weaker dollar the shared currency continued to march north yesterday, reaching highs of 1.1190 by the day’s end. Despite the recent two-day advance, upside momentum may diminish today since price looks set to cross swords with the 1.12 handle and its neighboring H4 resistances: H4 Quasimodo resistance level at 1.1197/H4 78.6% Fib resistance at 1.1192. Not only this but there’s nearby H4 support seen on the USDX at 95.48 (a bounce higher from support on this index generally pushed the EUR lower), and let’s not forget that daily action has established itself within the confines of a daily resistance area coming in at 1.1224-1.1104.
Taking into account that weekly price shows potential to continue north up to the weekly resistance area at 1.1533-1.1278, a bounce lower is all that’s expected from the above said H4 levels today. Another key thing to note is that around 1.30pm GMT today, the US jobless claims will take the spotlight, which is likely cause volatility.
Our suggestions: As we’ve highlighted above, a bounce from the 1.12 region today is possible. This is something we’ll be looking to take advantage of. Nevertheless, given the weekly picture (see above), waiting for lower timeframe confirmation to take shape before risking capital here (see the top of this report) is, in our opinion, a far safer route to take.
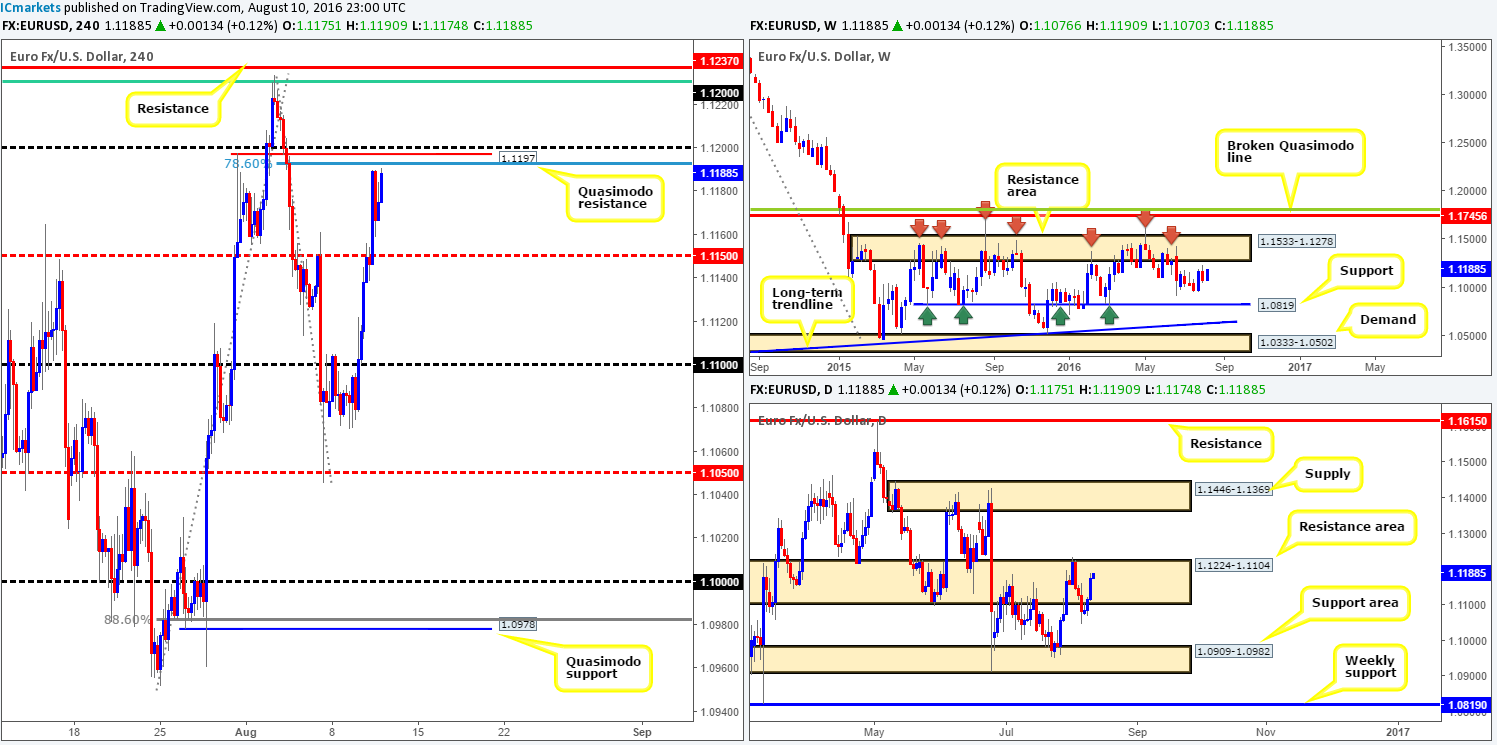
Levels to watch/live orders:
- Buys: Flat (Stop loss: N/A).
- Sells: 1.12/1.1192 region [Tentative – confirmation required] (Stop loss: dependent on where one confirms this area).
GBP/USD:
Cable, once again, found resistance around the H4 supply zone at 1.3064-1.3109 yesterday, which, as you can see, eventually forced the pair back down to the key figure 1.30. While 1.30 is currently bid, we feel this will be short lived. Our reasoning lies within the higher-timeframe structures. Over on the daily chart, there’s little support stopping a move being seen down to a nearby daily demand zone at 1.2789-1.2928. Meanwhile, up on the weekly chart, support is literally nonexistent as far as we can see until the 1.20 region. All of this coupled with a relatively strong bearish trend makes the downside more favorable in our book.
A break below 1.30 would likely prompt a move down to a H4 harmonic Gartley reversal zone fixed between 1.2864/1.2934. This green buy zone comprises of a H4 Quasimodo support, the 1.29 handle and a H4 78.6% Fib support. Planted beautifully on top of the daily demand zone mentioned above, it’s highly likely to produce a bounce to the upside. Aggressive traders may look to place stops around the 1.2844 region, while more conservative traders might look to set stops below the X point of the harmonic formation at 1.2778.
Our suggestions: Since this harmonic bullish pattern has formed within a bearish downtrend we’d highly recommend waiting for lower timeframe confirmation to form before placing capital on the line. This could be in the form of an engulf of supply followed by a retest, a trendline/break retest or simply a collection of well-defined buying tails seen around the harmonic reversal zone. This, in our opinion, will likely get you in at a better price and potentially avoid unnecessary drawdown.
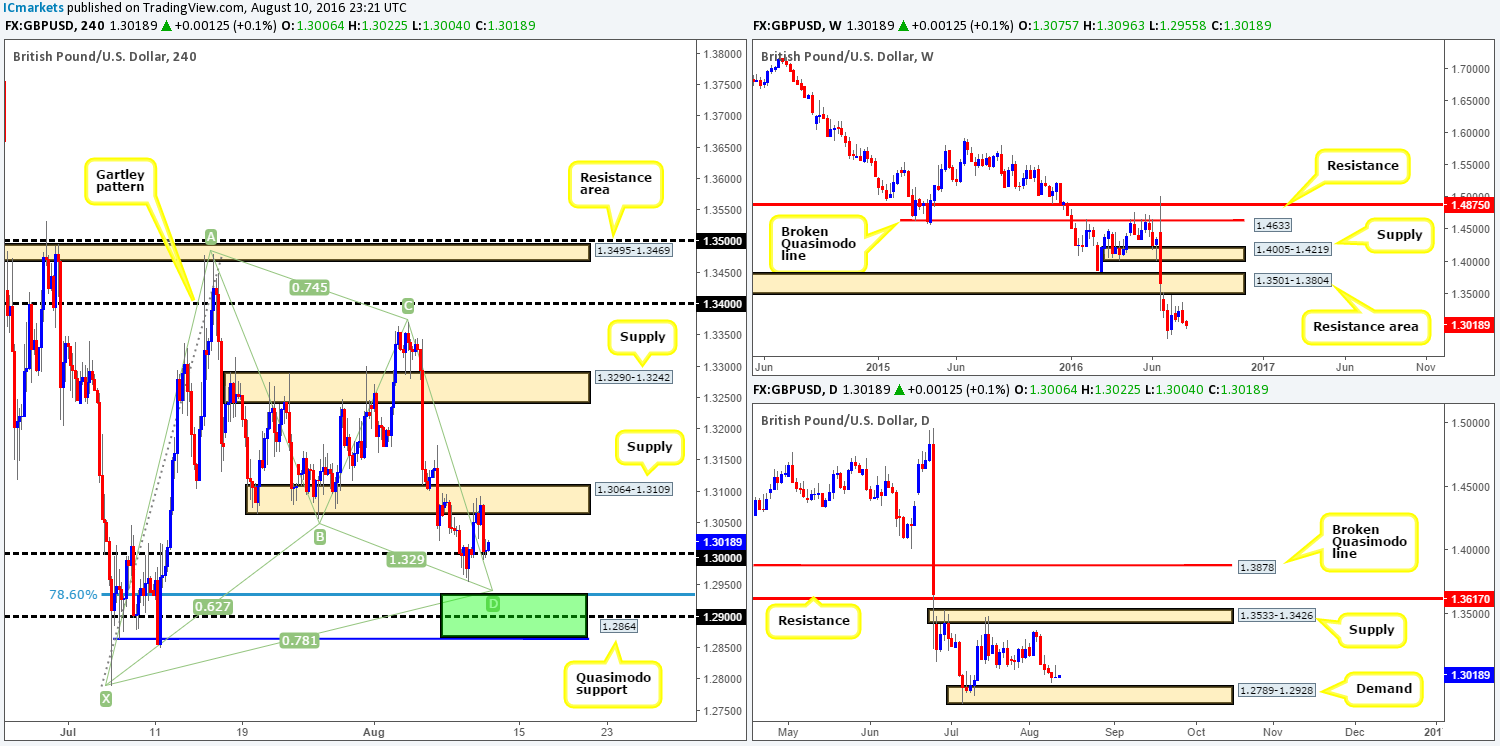
Levels to watch/live orders:
- Buys: 1.2864/1.2934 [Tentative – confirmation required] (Stop loss: dependent on where one confirms this area).
- Sells: Flat (Stop loss: N/A).
AUD/USD:
Working our way from the top this morning, we can see that weekly movement recently connected with a weekly trendline resistance taken from the high 0.8895. Should offers hold ground here, a push back down to test the weekly support boundary at 0.7604 may be on the cards. Looking down to the daily chart, the commodity-linked currency recently spiked above a daily supply zone drawn from 0.7719-0.7665. This – coupled with the overhead weekly trendline resistance, could help force prices lower today.
Turning our attention to the H4 chart, yesterday’s upside momentum swallowed the 0.77 handle and went on to collide with a H4 channel resistance line extended from the high 0.7565. As is shown on the chart, bids/offers appear even right now as price seesaws between the above said H4 channel resistance and the 0.77 number.
Our suggestions: Watch for price to close below 0.77 today. Accompanied with a retest followed by a lower timeframe sell signal (see the top of this report), the Aussie will likely drop lower to at least test the H4 mid-way support at 0.7650, which makes for a beautiful first take-profit target.
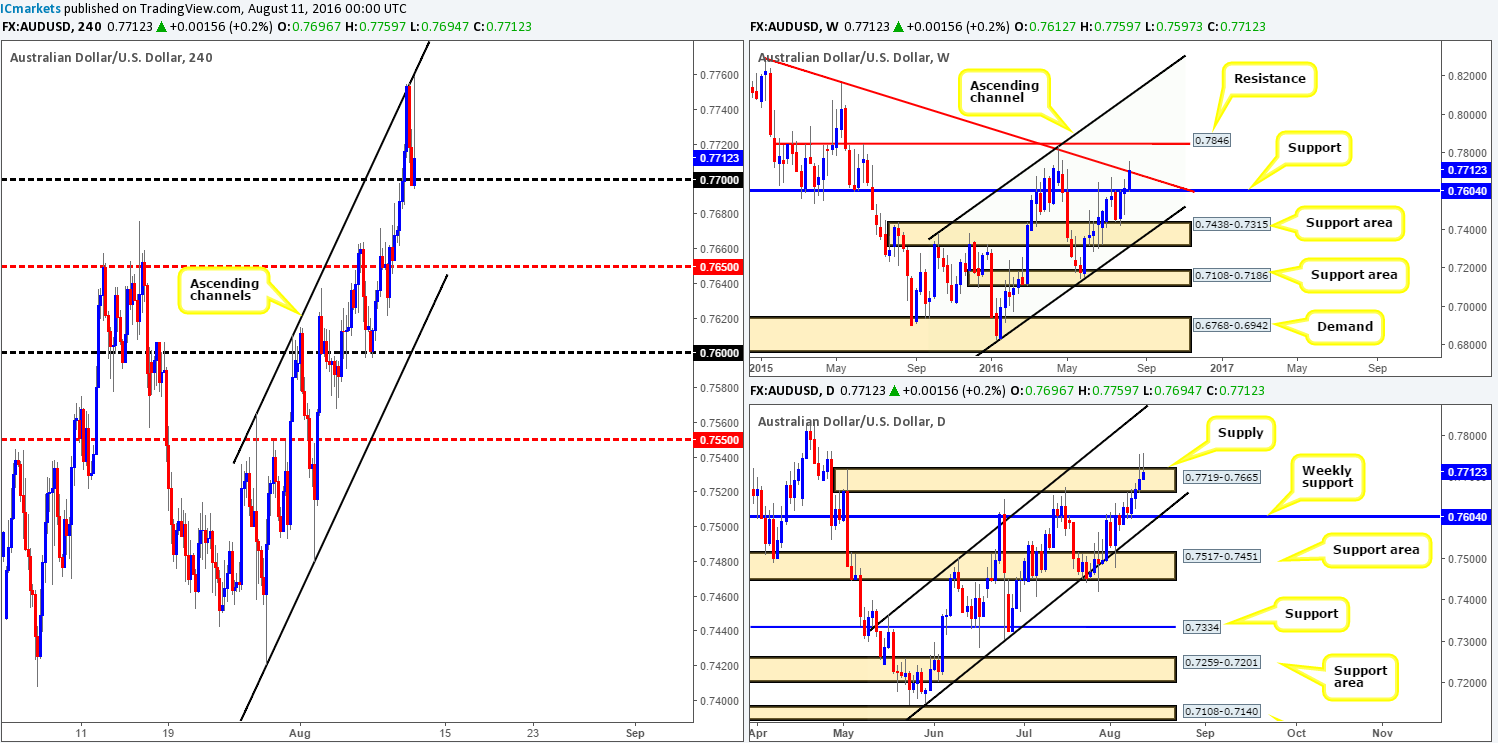
Levels to watch/live orders:
- Buys: Flat (Stop loss: N/A).
- Sells: Watch for price to close below the H4 mid-way support 0.7650 and look to trade any retest seen thereafter (lower timeframe confirmation required).
USD/JPY:
Following two consecutive days of losses, the USD/JPY is now seen trading between a H4 resistance line at 101.40 and the 101 handle. With both weekly and daily price still looking set to drop lower to touch gloves with a weekly support level at 100.61 right now, the 101 boundary is likely to be consumed today.
Should the above come to fruition, the current weekly support line potentially lays a foundation here for a buy trade. Despite it being a higher-timeframe structure, however, waiting for lower timeframe confirmation to take shape is still highly recommended (see the top of this report), since a fakeout down to the H4 Quasimodo support at 100.19, or even the key figure 100 could be seen. In the event that our team manages to pin down a buy from the weekly level, take-profit areas to keep an eye on are: the 101 level, the H4 resistance at 101.40 and the 102 boundary.

Levels to watch/live orders:
- Buys: 100.61 region [Tentative – confirmation required] (Stop loss: dependent on where one confirms this area).
- Sells: Flat (Stop loss: N/A).
USD/CAD:
Going into the early hours of yesterday’s London session, the USD/CAD retested the underside of the recently broken H4 channel support (1.2767) and sold off down to the key figure 1.30. For those who read our previous report on the loonie you may recall that this was a noted move to watch for. We also went on to highlight 1.30 as a particularly interesting buy zone considering that it merged nicely with a daily trendline support extended from the low 1.2460. Well done to any of our readers who managed to net either of the above trades!
In view of weekly price trading south from weekly supply at 1.3295-1.3017 and daily candles rebounding from the above said daily trendline support, medium-term direction is limited.
Our suggestions: Watch for shorts around the underside of the aforementioned H4 channel support today. Building a case for entry here we have a H4 38.2% Fib resistance at 1.3070 and of course weekly price occupying the above said weekly supply zone. Now, in light of daily action bouncing from a daily trendline support recently, our team requires a lower timeframe sell signal to short the above said H4 channel line following the retest. This could be in the form of an engulf of demand followed by a retest, a trendline/break retest or simply a collection of well-defined selling wicks seen around the higher-timeframe line.
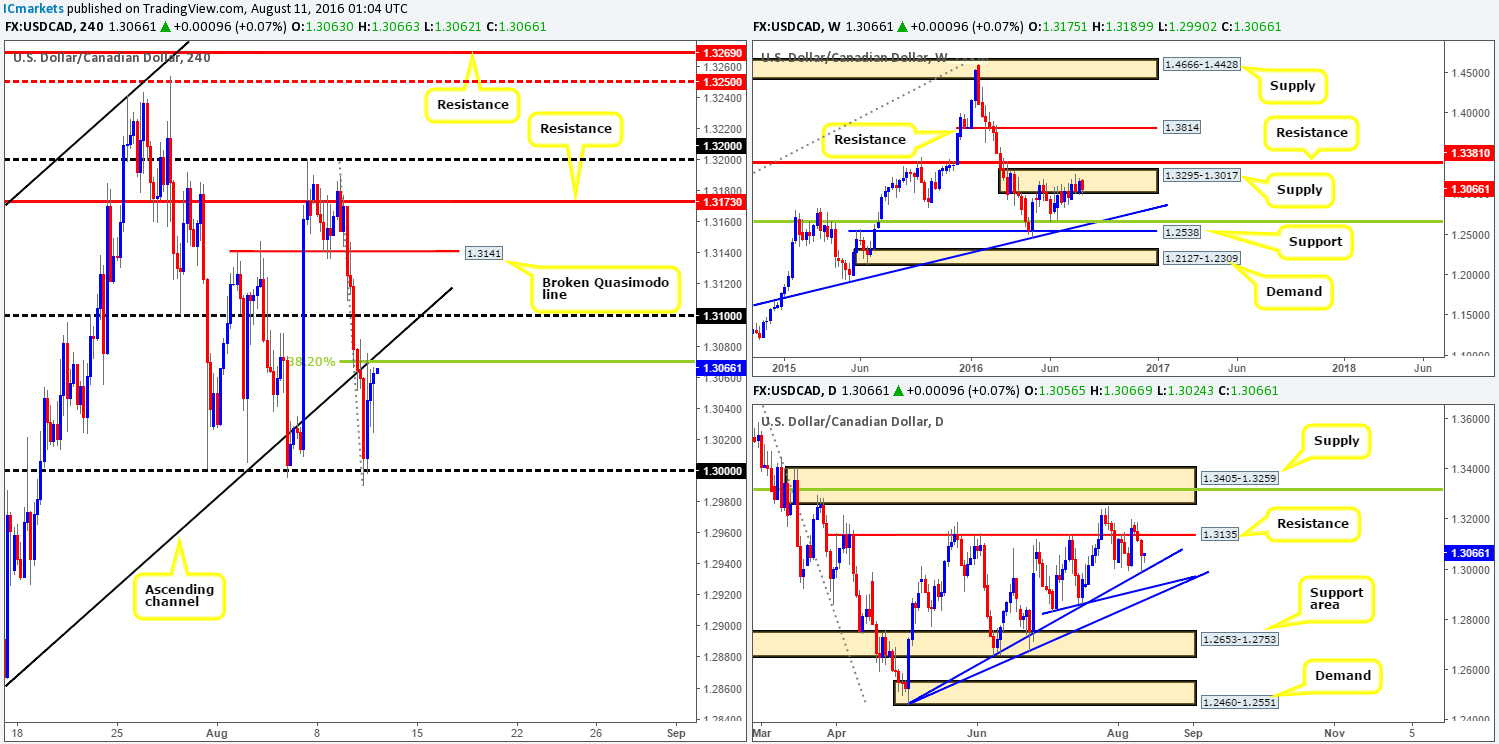
Levels to watch/live orders
- Buys: Flat (Stop loss: N/A).
- Sells: Watch for a confirmed short entry from the underside of the H4 support (1.2767). Waiting for lower timeframe confirmation is recommended.
USD/CHF:
For those who read our previous report on the Swissy pair, you’ll likely recall that our team noted to watch for a decisive close below 0.98 yesterday, followed by a retest and a lower timeframe sell signal. As you can see from the H4 chart, this played out just beautifully. Also, take a look at the lower timeframe confirmation that formed on the M15 chart: a break of the low 0.9792 (demand), which was quickly followed up by another retest of the 0.98 boundary. Well done to any of our readers who managed to net this move as price just recently connected with the take-profit target: the H4 demand zone at 0.9721-0.9734 (sits just above the daily support area at 0.9648-0.9708).
In regard to today’s sessions, price could very well rebound from the current H4 demand given that it’s bolstered by the aforementioned daily support area. Trading from here, we’d be looking for price to reverse back up to the 0.98 region. In addition to this, we also like the look of the H4 support at 0.9710 and the nearby 0.97 handle for a long trade. The reason being is that this small region represents the top edge of the aforementioned daily support area.
Being conservative traders, we would still opt to wait for a lower timeframe buy signal (see the top of this report) when considering longs from either of the above said levels. The main reason as to why comes down to simply trying to avoid the fakeout, which is likely to be seen.
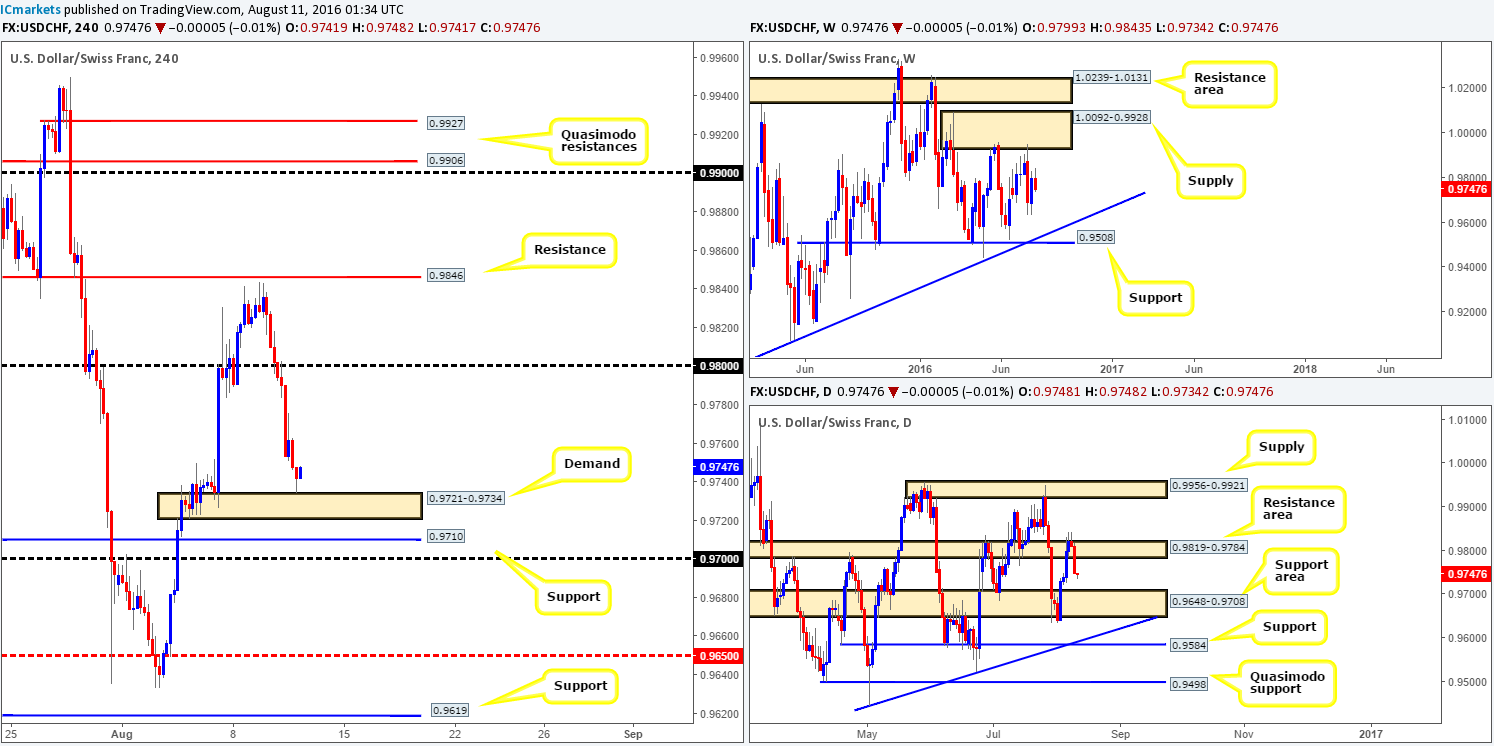
Levels to watch/live orders:
- Buys: 0.9721-0.9734 [Tentative – confirmation required] (Stop loss: dependent on where one confirms this area). 0.97/0.9710 [Tentative – confirmation required] (Stop loss: dependent on where one confirms this area).
- Sells: Flat (Stop loss: N/A).
DOW 30:
In recent trading, we can see that price retested the H4 broken Quasimodo line at 18482 and has so far held firm, which was a noted support level to watch for in Wednesday’s report. The other key thing to note on the H4 timeframe is the approach: a perfect AB=CD bullish formation! Now, to become a buyer here our team stated that a lower timeframe buy signal (see the top of this report) would need to take shape before any capital was put on the table. As of yet, lower timeframe confirmation is absent.
In addition to the above H4 structure, the weekly chart shows that price printed a nice-looking weekly buying tail last week from a weekly support area drawn from 18365-18158. Down on the daily chart, the DOW appears to be stalling ahead of the all-time high 18636. From a technical standpoint, there’s very little active supply seen to the left of current price so a move higher is still likely on the cards.
Our suggestions: Quite simply, keep a close eye on the lower timeframe price around the current H4 broken Quasimodo line. Should a buy signal come into view, our team would jump in long targeting the 18540 region as an immediate take-profit zone. Following this, we’d want to see price break above the H4 supply at 18601-18551 (black arrow), before deciding on where to cash in the next portion of our position.
Should the H4 level fail to hold, all eyes will then be on the H4 demand at 18443-18458 for a possible buy trade.
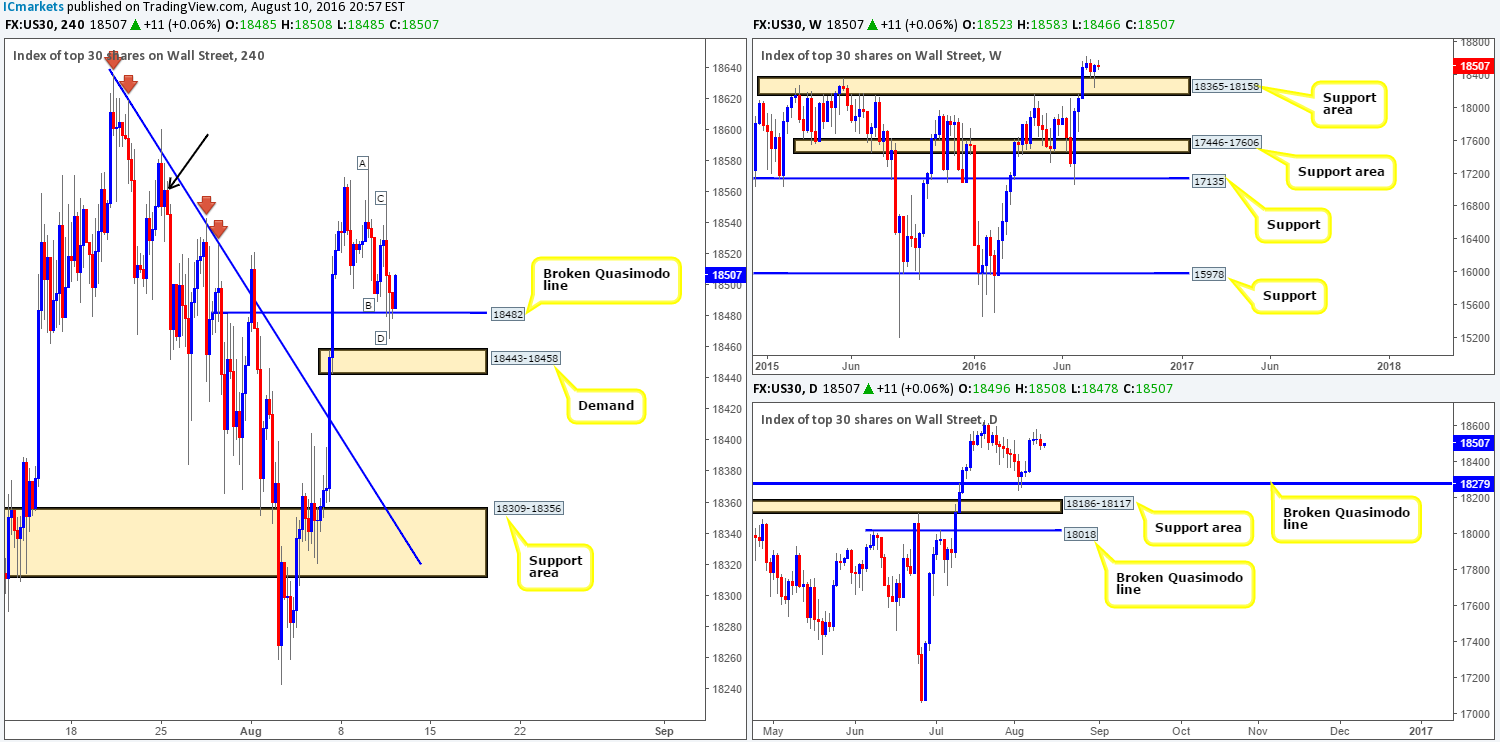
Levels to watch/live orders:
- Buys: 18428 region [Tentative – confirmation required] (Stop loss: dependent on where one confirms this area). 18443-18458 region [Tentative – confirmation required] (Stop loss: dependent on where one confirms this area).
- Sells: Flat (Stop loss: N/A).
GOLD:
During the course of yesterday’s sessions, price tagged offers around the daily resistance level given at 1354.6, which, as you can see, managed to rotate the yellow metal to the downside. At the time of writing, the buyers and sellers are seen battling for position within a H4 support area at 1347.0-1342.4. However, in view of the rebound seen from the current daily resistance barrier, alongside room being seen for this market to move lower on the weekly chart, we feel this H4 zone is likely on the verge of giving way.
With the above points in mind, the next downside target to have your eyeball on is the H4 mid-range Quasimodo line at 1332.3. Nevertheless, a buy from here is not really something that interests us. What we are fond of right now is the H4 demand seen below it at 1315.6-1319.6 (positioned within the daily demand area at 1305.3-1322.8 – the next downside target on the daily timeframe), since it merges almost perfectly with a H4 harmonic Gartley reversal zone!
Our suggestions: Since the more likely direction is south today, we’re going to be watching for the following:
- A break below and retest of the current H4 support area. Should this come into light, we’ll look to enter short following a lower timeframe sell signal, targeting the 1332.3 mark and then the H4 demand area mentioned above at 1305.3-1322.8.
- Also, as we mentioned above, a buy from the H4 mid-range Quasimodo line at 1332.3 is not somewhere our team would consider a high-probability level for a reversal. As such, we’ll be looking for price to break below this line followed by a retest and a lower timeframe sell signal, targeting the above said H4 demand.
Should price reach this H4 demand base, all short positions are to be liquidated and traders are recommended to begin hunting for long positions from the lower timeframes. In regard to lower timeframe entries, we usually look for the following: an engulf of a supply or demand followed by a retest, a trendline/break retest or simply a collection of well-defined selling wicks/buying tails seen around the higher-timeframe area of interest.
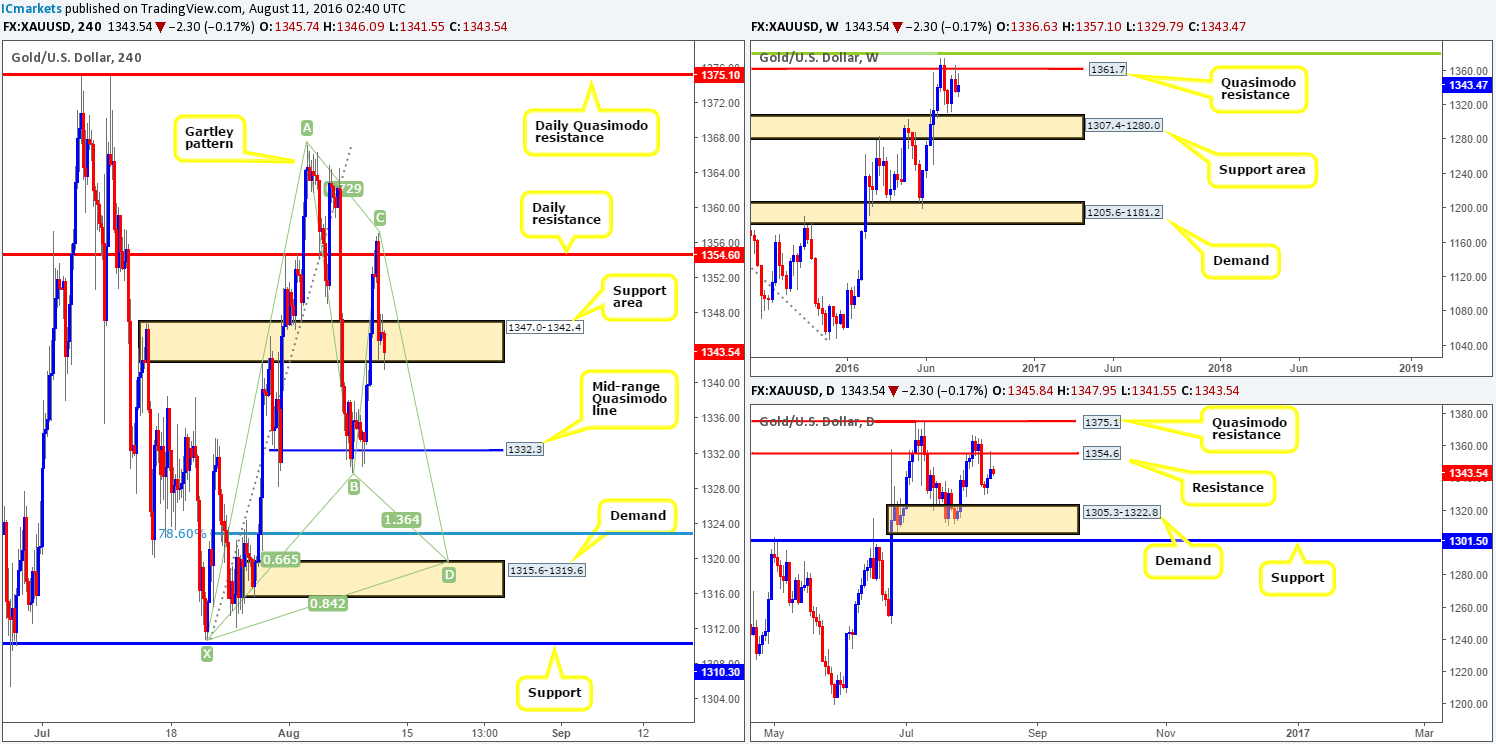
Levels to watch/live orders:
- Buys: 1315.6-1319.6 [Tentative – confirmation required] (Stop loss: dependent on where one confirms this area).
- Sells: Watch for price to close below the H4 support area at 1347.0-1342.4and look to trade any retest seen thereafter (lower timeframe confirmation required). Watch for price to close below the H4 mid-range Quasimodo support at 1332.3 and look to trade any retest seen thereafter (lower timeframe confirmation required).


