
Key risk events today:
ECB Main Refinancing Rate, Monetary Policy Statement and Press Conference; US Core PPI m/m and PPI m/m; US Unemployment Claims; Crude Oil Inventories; BoC Gov. Macklem Speaks; ECB President Lagarde Speaks.
(Previous analysis as well as outside sources – italics).
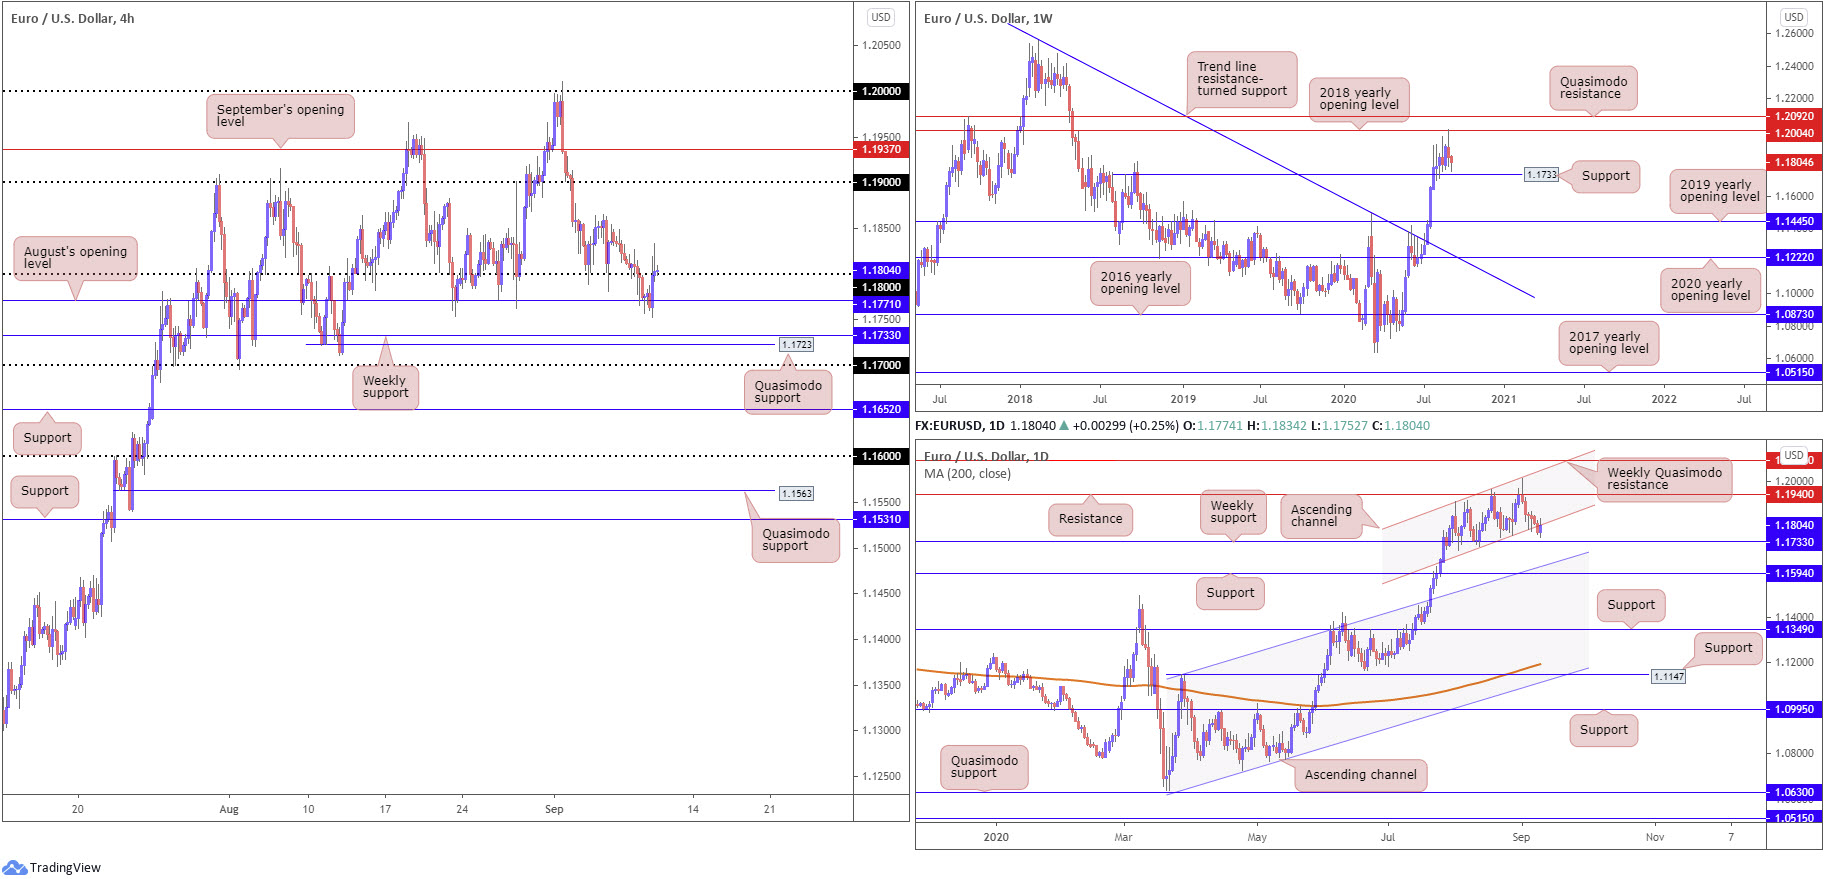
EUR/USD:
Upbeat comments from ECB officials, together with the US dollar index receding from 93.66 session peaks, had EUR/USD switch into positive territory heading into Wednesday’s European close.
August’s opening level at 1.1771 on the H4 provided support, consequently moving the pair back to 1.18. Buyers, as you can see though, have struggled to regain position north of the round number, fading session peaks at 1.1834. Should we manage to overthrow selling pressure around 1.18, the 1.1865 early September peaks could be seen, with a break exposing 1.19.
Should 1.18 prove too much for buyers and price takes over August’s opening level, weekly support at 1.1733 could make an appearance, closely shadowed by H4 Quasimodo support at 1.1723. The reason buyers are struggling to regain a footing above 1.18 on the H4, technically speaking, could be due to daily price retesting channel support-turned resistance, extended from the low 1.1711.
Areas of consideration:
Breakout buyers above 1.18, those who remain in their position, are possibly anxious right now. Weekly action exhibits scope to drop to 1.1733, and daily price tests channel resistance. Multi-timeframe traders, therefore, are likely to seek bearish themes at current price, in favour of a dip through August’s opening level at 1.1771 to weekly support. Conservative intraday sellers, however, might opt to wait and see if we close below 1.1771 before pulling the trigger.
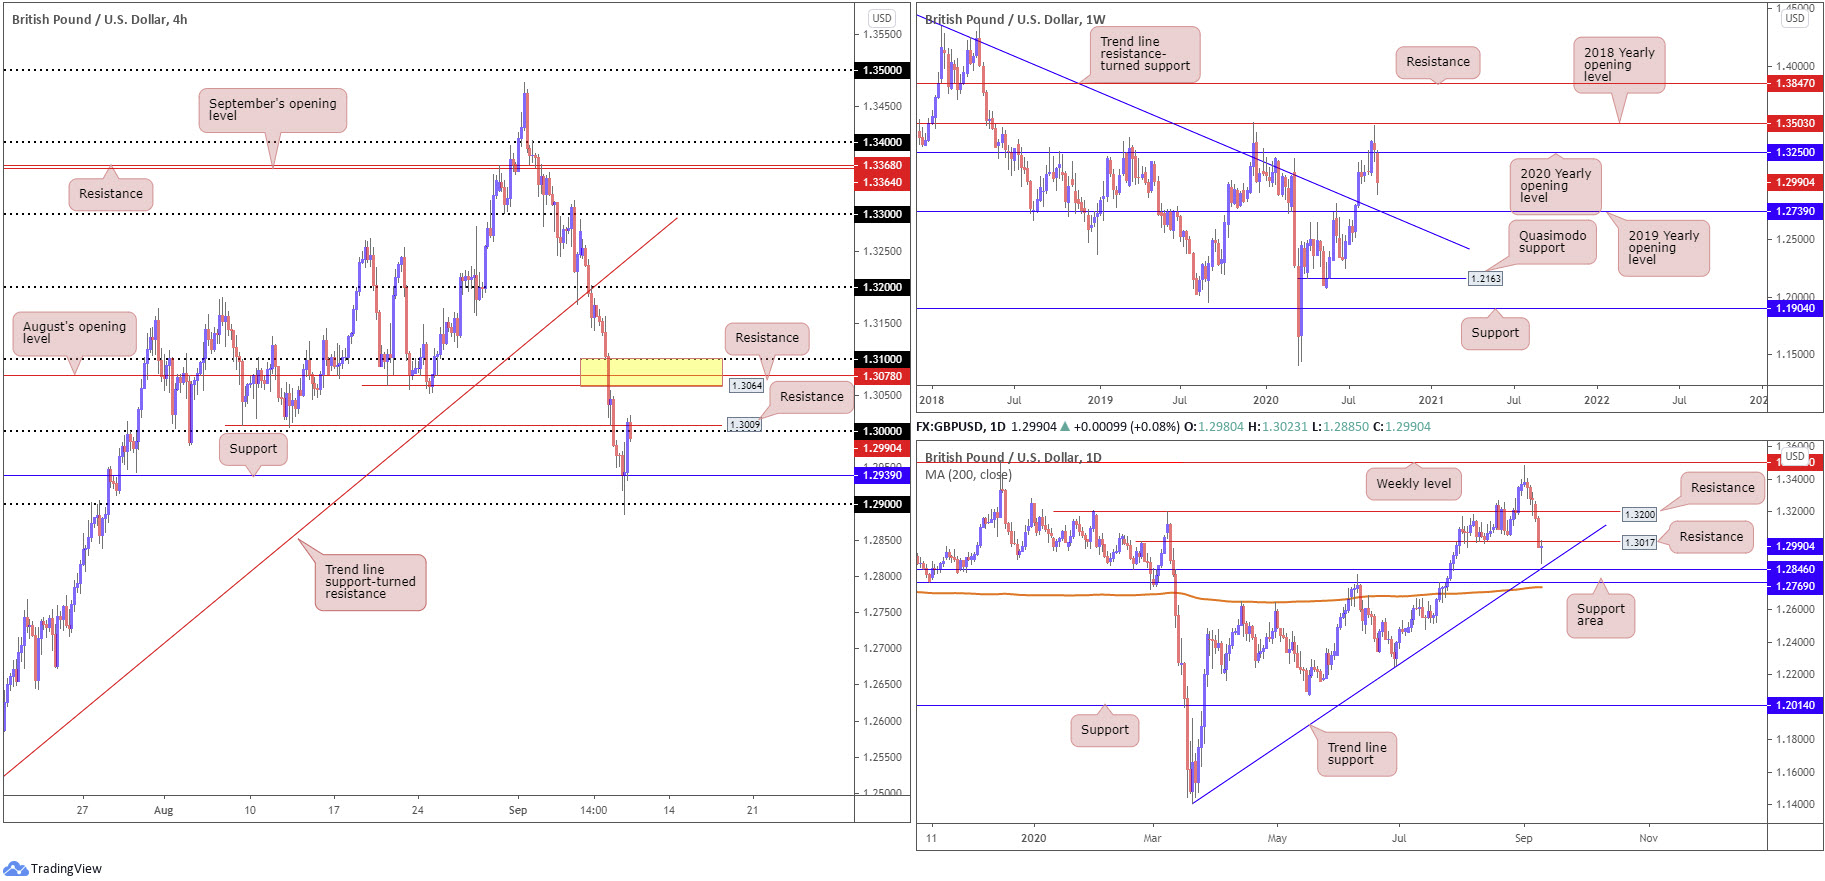
GBP/USD:
After clocking session lows at 1.2885 Wednesday, a move that marginally pierced orders at the 1.29 handle and tested H4 support coming in at 1.2939, the pair staged a relatively impressive recovery to the key figure 1.30. While 1.30 echoes strong resistance, bolstered by H4 resistance at 1.3009, a prior Quasimodo support level, another area of resistance on the H4 timeframe is worth noting: 1.31/1.3064 (1.31 handle, August’s opening level at 1.3078 and a resistance level at 1.3064 [yellow]).
Technical studies on the weekly timeframe show that we could perhaps sink to deeper waters this week. South of the 2020 yearly opening value at 1.3250, limited support is visible until reaching the 2019 yearly opening value at 1.2739, merging closely with trend line resistance-turned support, extended from the high 1.5930.
Yet, on the daily timeframe, we’re recovering north of trend line support, taken from the low 1.1409, positioned close by a support area coming in at 1.2769/1.2846 and a 200-day SMA (orange – 1.2737). In support of sellers, however, 1.3017 could serve as resistance.
Areas of consideration:
Despite the recent recovery, sellers still appear to have the upper hand.
Selling from 1.30 is likely on the watchlist for many traders going forward. The fact we have H4 resistance at 1.3009 and daily resistance at 1.3017 offers healthy confluence to work with, targeting H4 support at 1.2939 as an initial take-profit zone.
Failing to hold at 1.30, however, will perhaps have sellers pursue bearish scenarios out of the H4 resistance area at 1.31/1.3064, targeting 1.30 as an initial point.
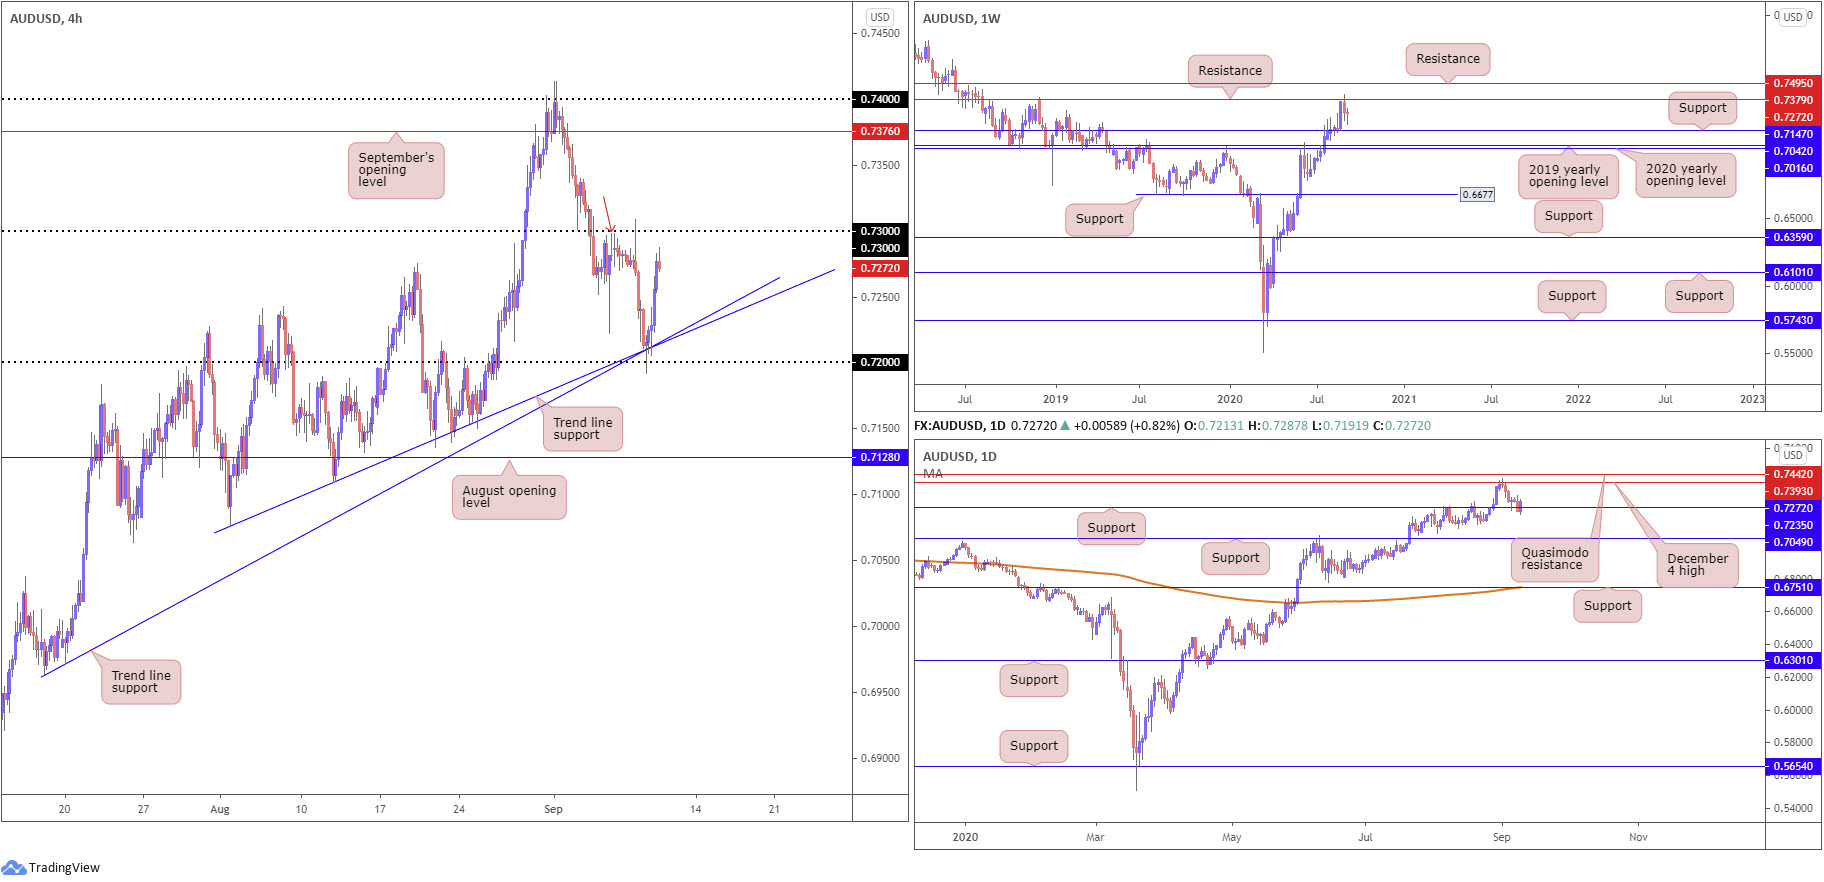
AUD/USD:
Amidst a risk recovery and soft DXY, AUD/USD encountered robust support off the 0.72 handle and two nearby H4 trend line supports (0.7076/0.6963) on Wednesday. Although we left weekly support at 0.7147 unchallenged, daily support coming in from 0.7235 likely helped reinforce technical buying.
Upside targets fall in at the 0.73 handle on the H4, located nearby Quasimodo resistance at 0.7298 (red arrow). Breaking 0.73 targets September’s opening level at 0.7376, followed by weekly resistance at 0.7379 and then 0.7393 resistance on the daily timeframe, the December 4 high.
Areas of consideration:
Buyers from 0.72 have possibly reduced risk to breakeven and locked in partial profits. Technically, further buying could still be seen to 0.73, however.
Overrunning the latter today is likely to attract fresh buying opportunity, targeting the 0.74/0.7376 region on the H4. Conservative buyers may opt to wait and see if a 0.73 retest occurs before committing.
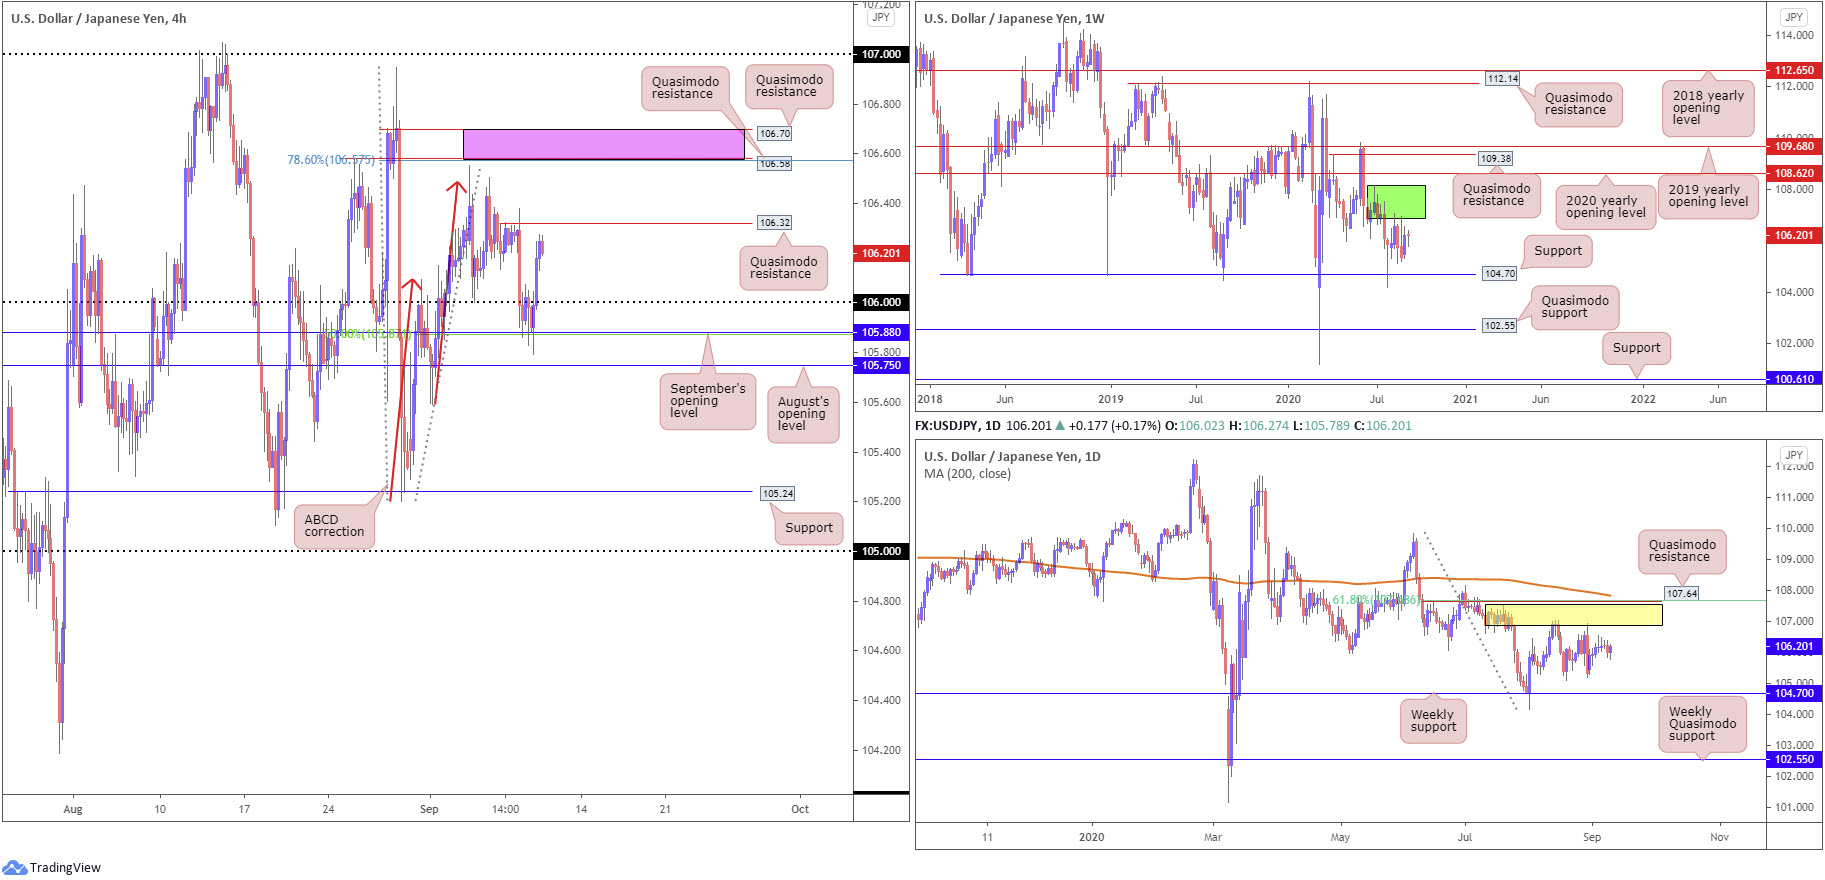
USD/JPY:
Following a period of indecision between September’s opening level at 105.88 (and a 50% retracement at 105.86) and the 106 handle, USD/JPY entered an offensive phase going into European hours Wednesday as demand for the Japanese yen diminished amid a rally in global equities.
This has landed H4 candles within touching distance of Quasimodo resistance at 106.32, with a break potentially underlining two Quasimodo formations at 106.58 (merges with 78.6% Fibonacci resistance at 106.57) and 106.70 (pink).
Further afield on the higher timeframes, little change has been seen from a technical perspective. Consequently, the analysis put forward earlier this week remains valid.
Weekly timeframe:
Snapping a two-week bearish phase, USD/JPY bulls went on the offensive last week and, despite leaving support at 104.70 unchallenged, added nearly 100 pips. Supply remains prominent on the weekly timeframe at 108.16-106.88 (dark green) after price made its way off support at 104.70 at the end of July. Should buyers hold recent upside, the 2020 yearly opening level at 108.62 may eventually enter view, closely tracked by Quasimodo resistance at 109.38.
Daily timeframe:
Supply at 107.55/106.89 (yellow), an area housed within the lower boundary of weekly supply mentioned above at 108.16-106.88, has proved a tough nut to crack on the daily timeframe. Downside from current price could target weekly support underlined above at 104.70. In the event buyers climb, Quasimodo resistance at 107.64 might enter play, reinforced by a 61.8% Fibonacci retracement ratio at 107.68 and 200-day SMA (orange – 107.84).
Areas of consideration:
A reaction from H4 Quasimodo resistance at 106.32 is possible, though many traders will seek additional confirmation before shorting, given the level’s lack of confluence, both locally and on the higher timeframes.
Should buyers take out H4 Quasimodo resistance at 106.32, bullish scenarios may be on the cards to 106.70/106.58, followed by a possible run to the underside of higher timeframe supplies around 106.88ish and 107 resistance (H4).
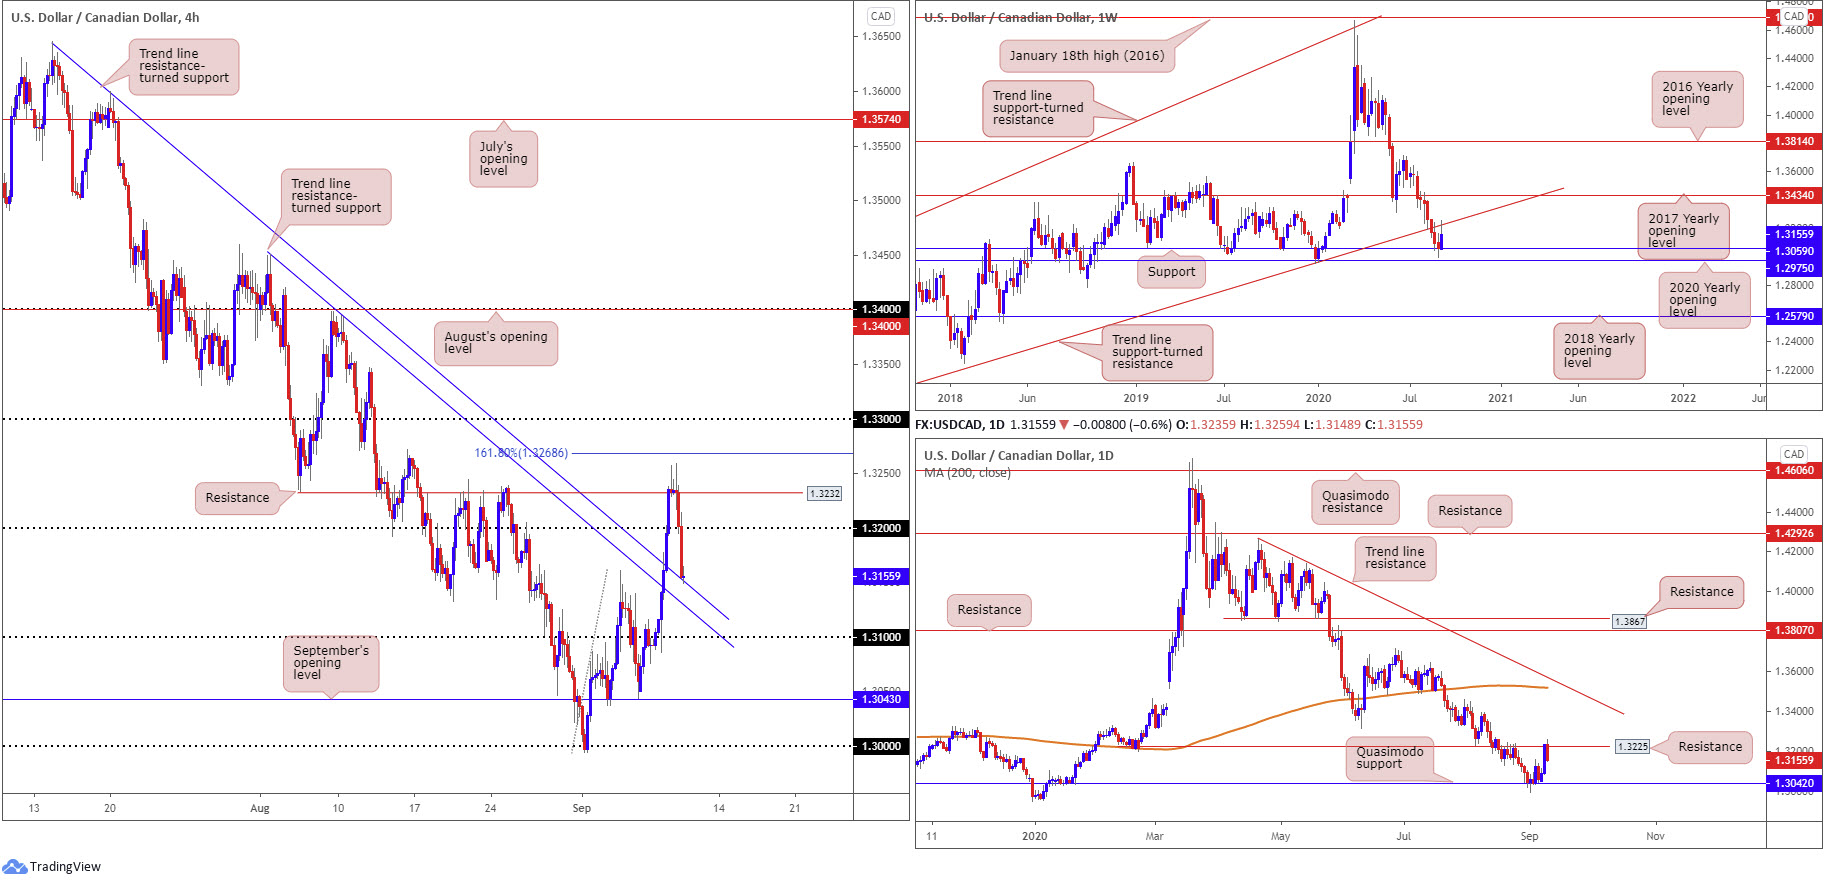
USD/CAD:
The combination of trend line support-turned resistance, taken from the low 1.2061, on the weekly timeframe, daily resistance at 1.3225, a prior Quasimodo support, H4 resistance at 1.3232, along with the DXY turning lower and WTI advancing to $38.00 a barrel, weighed on USD/CAD Wednesday.
The aforementioned confluence led H4 candles through 1.32 to tackle trend line resistance-turned support, extended from the high 1.3646, located close by another trend line resistance-turned support, from the high 1.3451.
The higher timeframes indicate selling could be seen to around the 1.3050 region, underscoring the possibility of 1.31 entering the fold on the H4 and the aforesaid H4 trend lines giving way.
Areas of consideration:
Those currently short this market have likely reduced risk to breakeven upon closing sub 1.32. A retest at the round number today is a move current sellers may welcome to pyramid their position; it may also prompt fresh bearish themes.
Downside targets rest at 1.31 on the H4, followed by 1.3059 support on the weekly timeframe and then 1.3042 Quasimodo support from the daily timeframe.
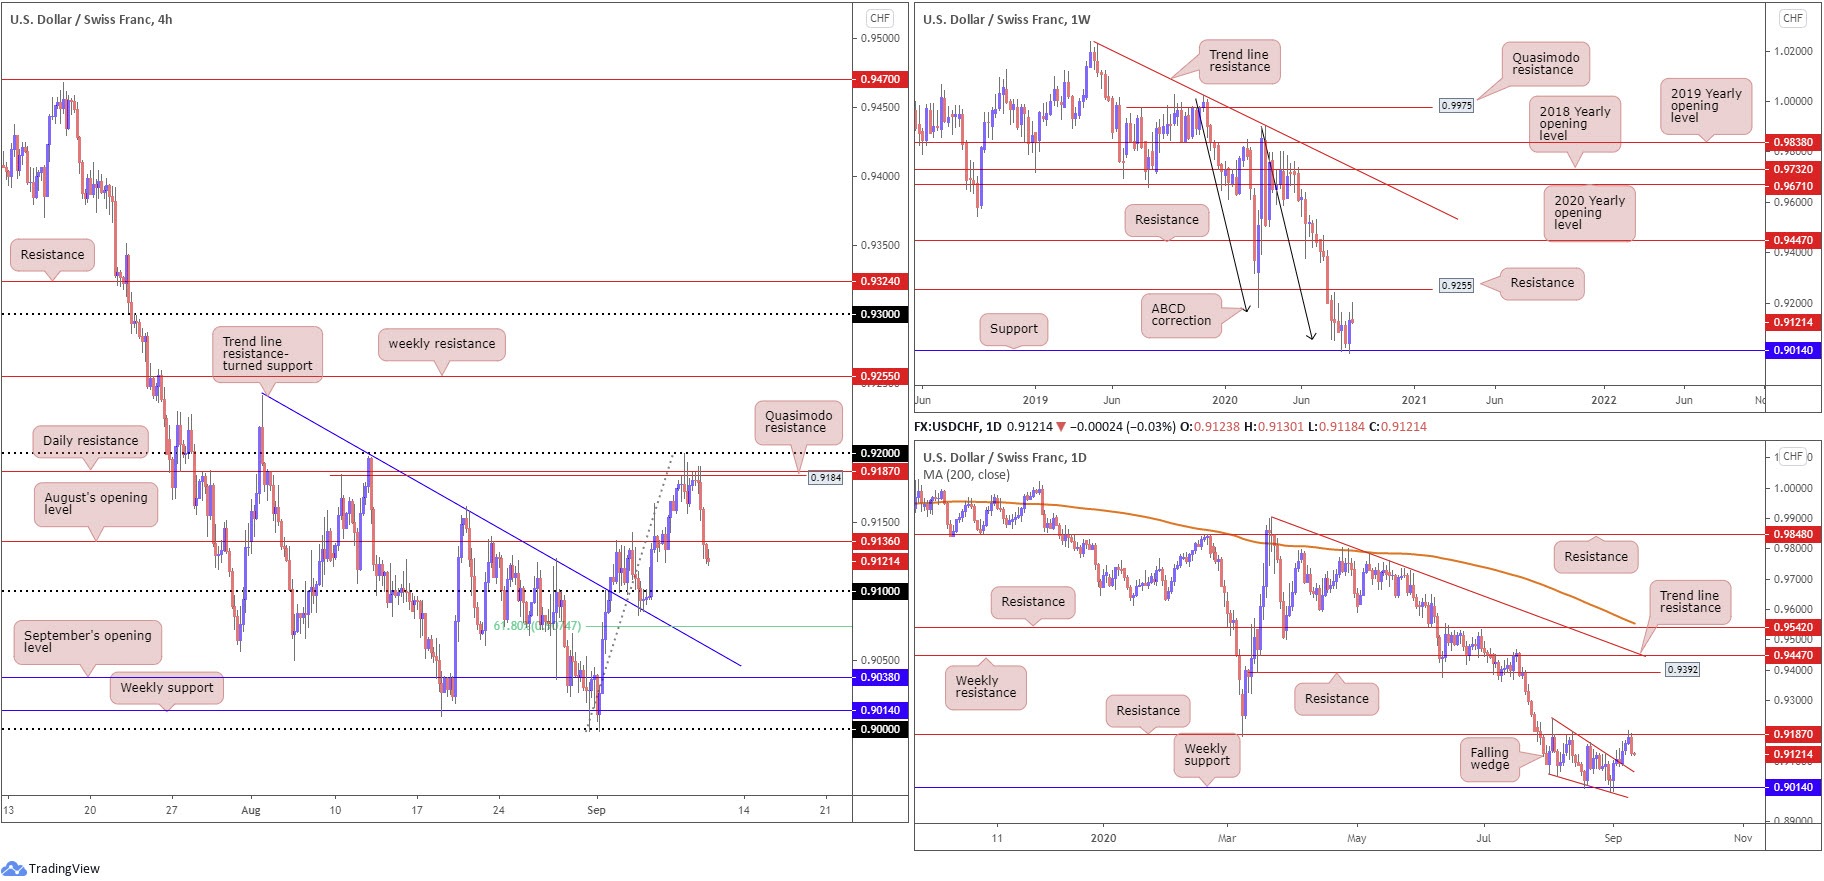
USD/CHF:
USD/CHF rotated south on Wednesday, following optimistic comments from ECB officials and a soft USD. Fading 0.92 on the H4, along with daily resistance priced in at 0.9187 and H4 Quasimodo resistance at 0.9184, had H4 activity submerge August’s opening level at 0.9136 and is currently suspended north of the 0.91 handle.
Further out on the weekly timeframe, we can see upside momentum has diminished ahead of resistance at 0.9255 (a prior Quasimodo support level), despite last week’s recovery from support at 0.9014/ABCD support at 0.9051 (black arrows). On the daily timeframe, resistance at 0.9187 is proving a tough nut to crack, with price recently snapping a three-day bullish phase, following the breakout above a falling wedge pattern pencilled in from the high 0.9241 and a low of 0.9056.
Areas of consideration:
According to the H4 timeframe, follow-through downside could be in the offing today, taking aim at 0.91, followed by a 61.8% Fibonacci retracement ratio at 0.9074. Retesting August’s opening value at 0.9136 may also be a welcomed sight, allowing conservative intraday sellers entry into the market.
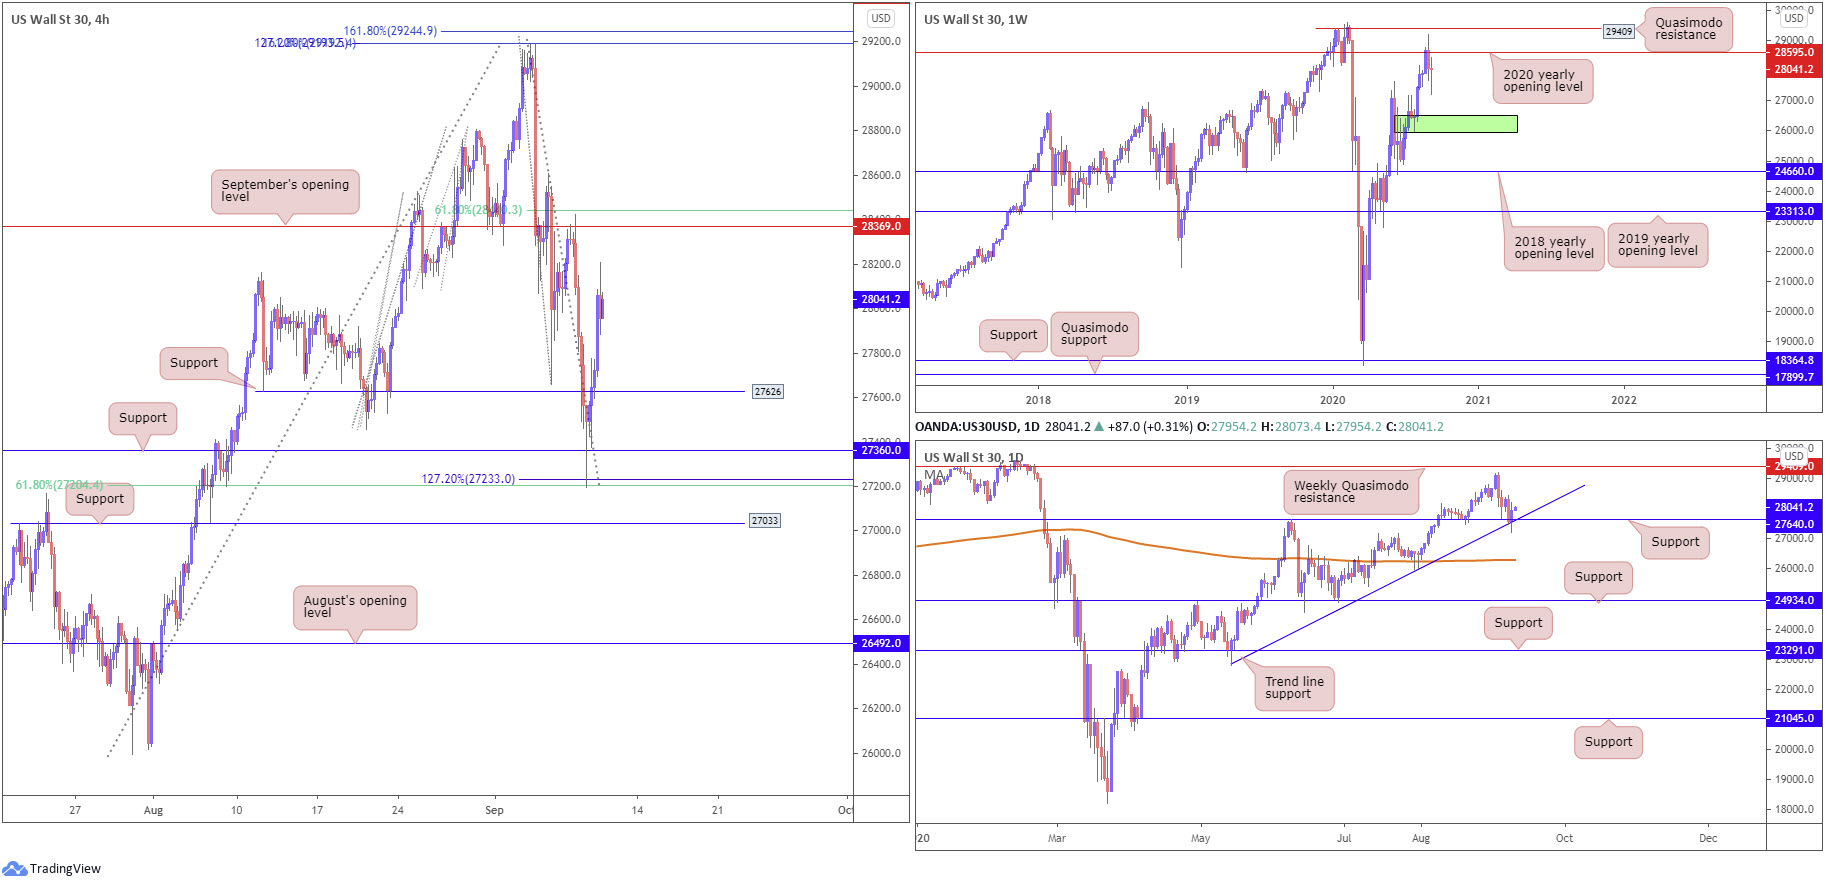
Dow Jones Industrial Average:
US equities pencilled in sharp gains on Wednesday, snapping recent losses. The Dow Jones Industrial Average added 439.58 points, or 1.6%; the S&P 500 advanced 67.12 points, or 2.01% and the Nasdaq traded higher by 293.87 points, or 2.71%.
- The weekly timeframe reveals price movement hovering a touch south of the 2020 yearly opening value at 28595 (sited just under Quasimodo resistance at 29409). Interestingly, downside movement could retreat as far south as demand (green) at 25916-26523.
- From the daily timeframe, we crossed swords with trend line support, taken from the low 22803, and support at 27640 yesterday. An extension higher today could eventually draw things to the 29193 September peak, followed by weekly Quasimodo resistance mentioned above at 29409. If a break lower comes to pass, this could bring light to the 200-day SMA (orange – 26296).
- The H4 timeframe found support from a 127.2% Fibonacci extension point at 27233 and 61.8% Fibonacci retracement ratio at 27204, placed south of support at 27360. The recovery from here nudged through 27626 resistance, recently striking highs at 28206 and shining the spotlight on September’s opening level at 28369 as the next upside target.
Areas of consideration:
Weekly suggests sellers may attempt to explore lower levels off resistance at 28595, yet daily price reveals a support/trend line support combination in motion.
September’s opening level at 28369 on the H4 could be of interest today, having seen its connection with a 61.8% Fibonacci retracement ratio at 28440. Alternatively, a dip to H4 support at 27626 could be seen, given daily support is priced at 27640.
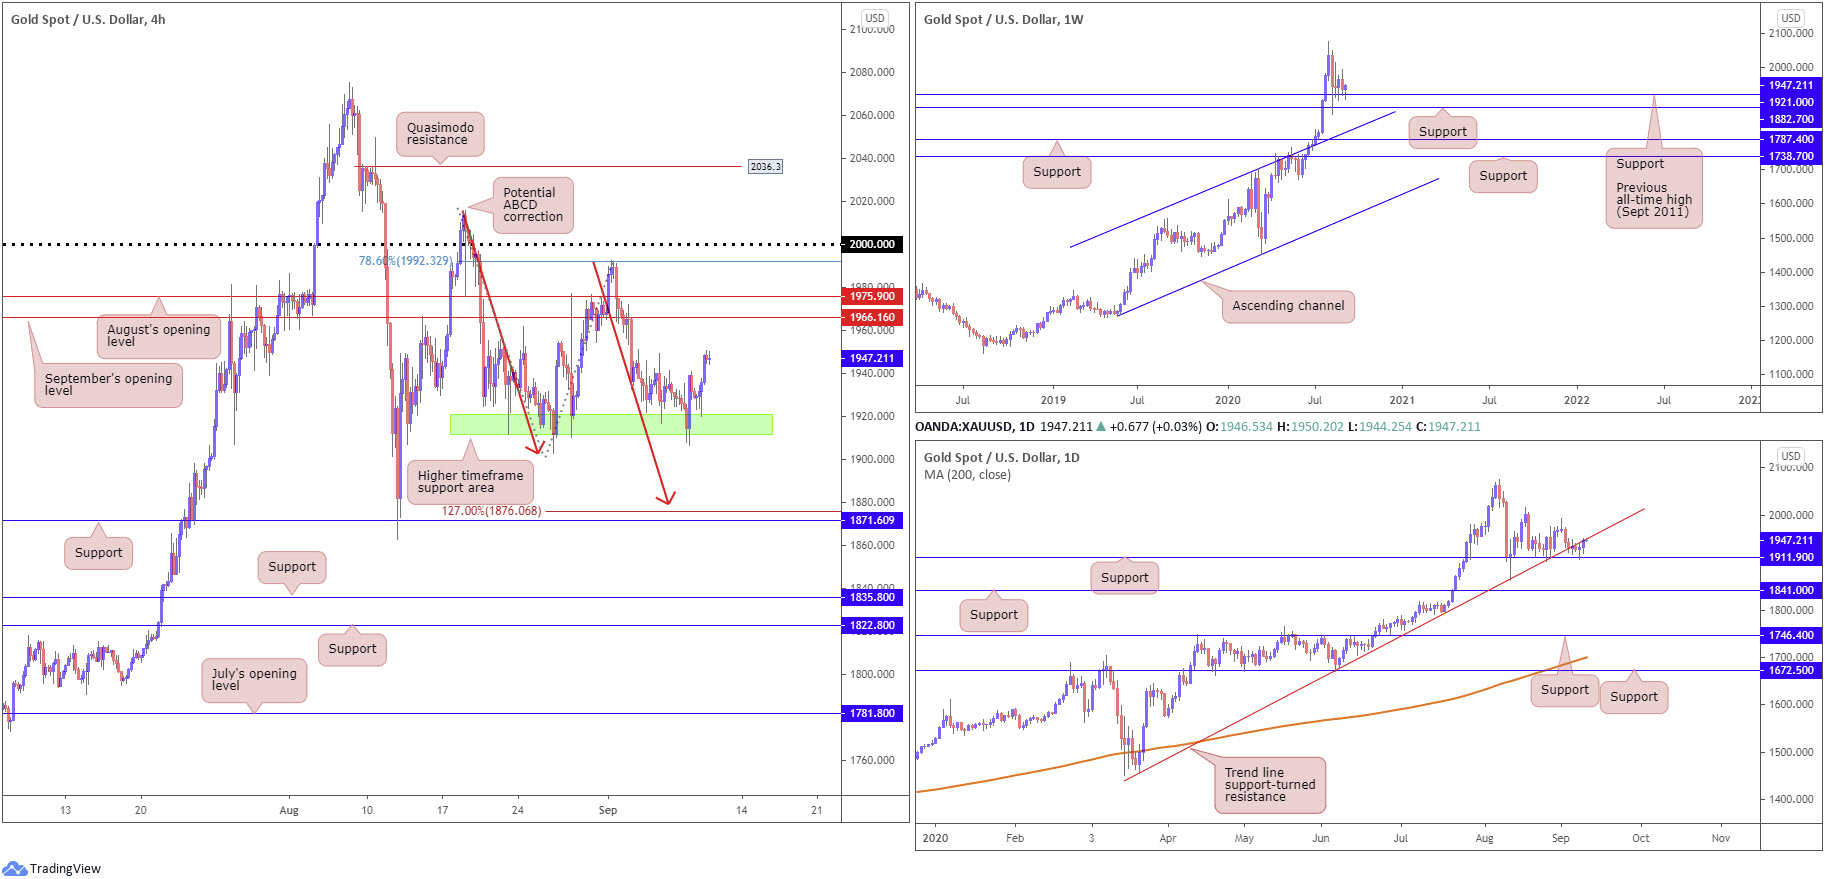
XAU/USD (GOLD):
Spot gold extended Tuesday’s recovery gains on Wednesday, adding more than $14.
Technically, weekly structure remains unchanged:
Support at $1,921.00, the previous major all-time high (September 2011), remains in play on the weekly timeframe, located ahead of support at $1,882.70. With the current trend trekking north since 2016, the combination of $1,882.70 and $1,921.00 may still be enough to encourage additional buying, with most targeting all-time peaks at $2,075.28 as the initial point. Failure to hold gains could see weekly channel resistance-turned support, etched from the high $1,703.28, enter view.
Price movement on the daily timeframe shows the unit challenged support at $1,911.90 on Tuesday, with Wednesday greeting trend line support-turned resistance, taken from the low $1,455.32. Breaking lower has support at $1,841.00 to target, whereas exploring higher might have the $1,992.56 September 1 high denote possible resistance, with a break pushing for the $2,015.72 August 18 high.
From the H4 timeframe:
Only recently have we seen H4 action make headway above a familiar area of higher timeframe support at $1,911.90-$1,921.00 (green). This was a noted base to keep eyeballs on. Of particular interest was Tuesday’s strong bullish rejection. Areas to keep a tab on should an advance materialise are September’s opening value at $1,966.16, and August’s opening value coming in at $1,975.90.
Areas of consideration:
Overall, this remains a buyers’ market, according to the current trend – higher since bottoming in 2016.
Traders long this market from the $1,911.90-$1,921.00 are likely targeting the above noted resistances in bold. Clearing the aforementioned resistances could see price make its way back to the $2,000.00 level.
The accuracy, completeness and timeliness of the information contained on this site cannot be guaranteed. IC Markets does not warranty, guarantee or make any representations, or assume any liability regarding financial results based on the use of the information in the site.
News, views, opinions, recommendations and other information obtained from sources outside of www.icmarkets.com.au, used in this site are believed to be reliable, but we cannot guarantee their accuracy or completeness. All such information is subject to change at any time without notice. IC Markets assumes no responsibility for the content of any linked site.
The fact that such links may exist does not indicate approval or endorsement of any material contained on any linked site. IC Markets is not liable for any harm caused by the transmission, through accessing the services or information on this site, of a computer virus, or other computer code or programming device that might be used to access, delete, damage, disable, disrupt or otherwise impede in any manner, the operation of the site or of any user’s software, hardware, data or property.


