
EUR/USD:
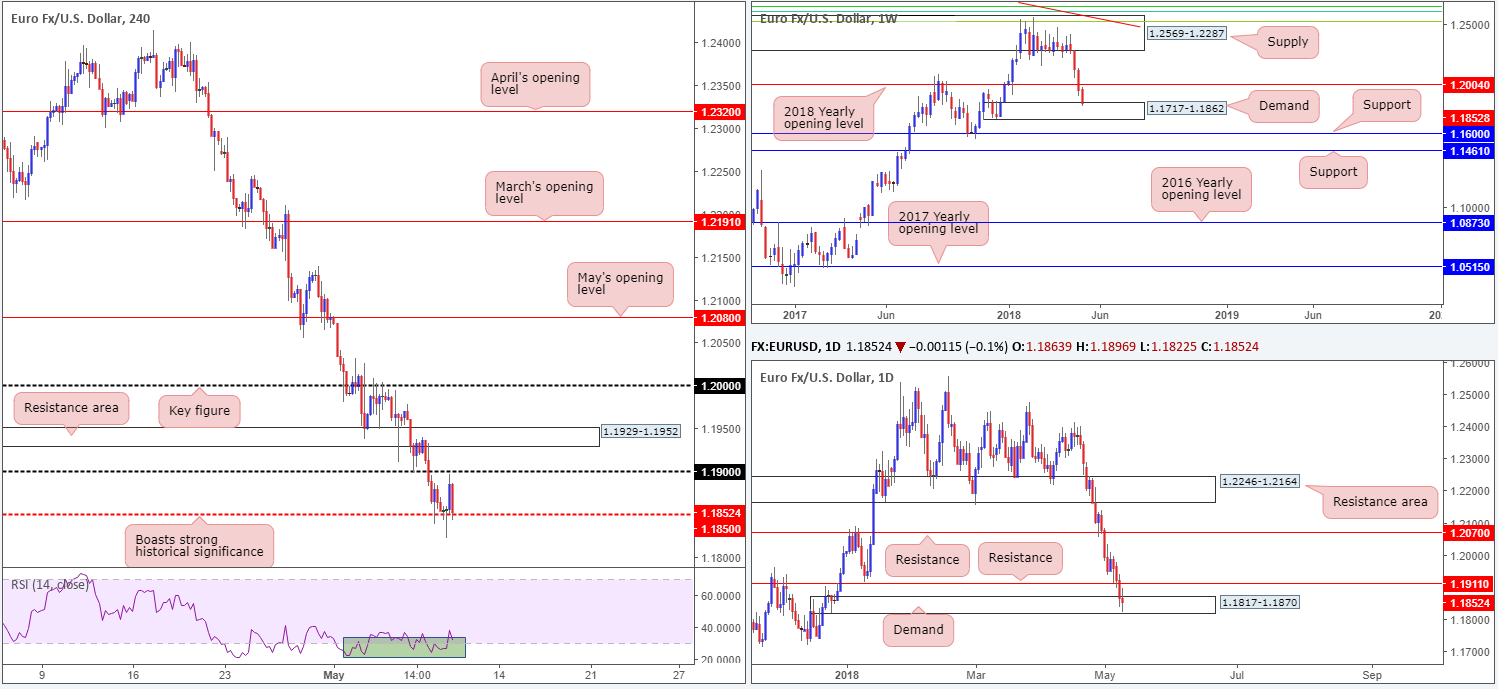
Followed by a clear-cut H4 bullish pin-bar formation that pierced through H4 mid-level support at 1.1850, the euro attempted to recover against its US counterpart on Wednesday. Despite reaching highs of 1.1897, aided by a lower-than-expected US PPI reading for the month of April, upside momentum diminished and quickly saw the market pare recent gains.
1.1850 remains an interesting support, regardless of the recent correction. This is largely due to its position on the longer-term picture. Weekly demand at 1.1717-1.1862 was recently brought into view – note this area’s strength exhibited in the form of robust momentum derived from its base. Further adding to this, it might also be worth noting that glued to the top edge of the weekly demand zone there’s a daily demand area seen at 1.1817-1.1870. Before we all begin heading over to the buyers’ camp, though, traders might want to note that upside is, to some extent, limited by a nearby daily resistance level plotted at 1.1911.
Potential trading zones:
Longer term, the team has noted that the outlook remains bullish until a break of the Nov 7 (2017) low at 1.1553 is witnessed.
From a technical standpoint, we do expect the bulls to make an appearance in the vicinity of the current weekly demand. A daily close above daily resistance at 1.1911 would be a green flag in terms of bullish intent, potentially highlighting a move up to the 2018 yearly opening level seen on the weekly timeframe at 1.2004 (the next upside target on the weekly scale).A failure of the weekly demand area, nevertheless, would immediately expose weekly support at 1.1600 – not a good sign for the bulls!
On account of the above, entering into short positions, knowing that we’re interacting with higher-timeframe demands is not a trade we’d label high probability, regardless of current sentiment. With that being the case, the 1.1850 neighborhood remains a point of interest for potential intraday longs, targeting 1.19, followed closely by daily resistance at 1.1911 and then the H4 resistance zone at 1.1929-1.1952. In order to achieve optimal risk/reward, drilling down to the lower timeframes for entry may be necessary.
Data points to consider today: The majority of European banks are closed in observance of Ascension Day; US CPI m/m; US unemployment claims.
GBP/USD:
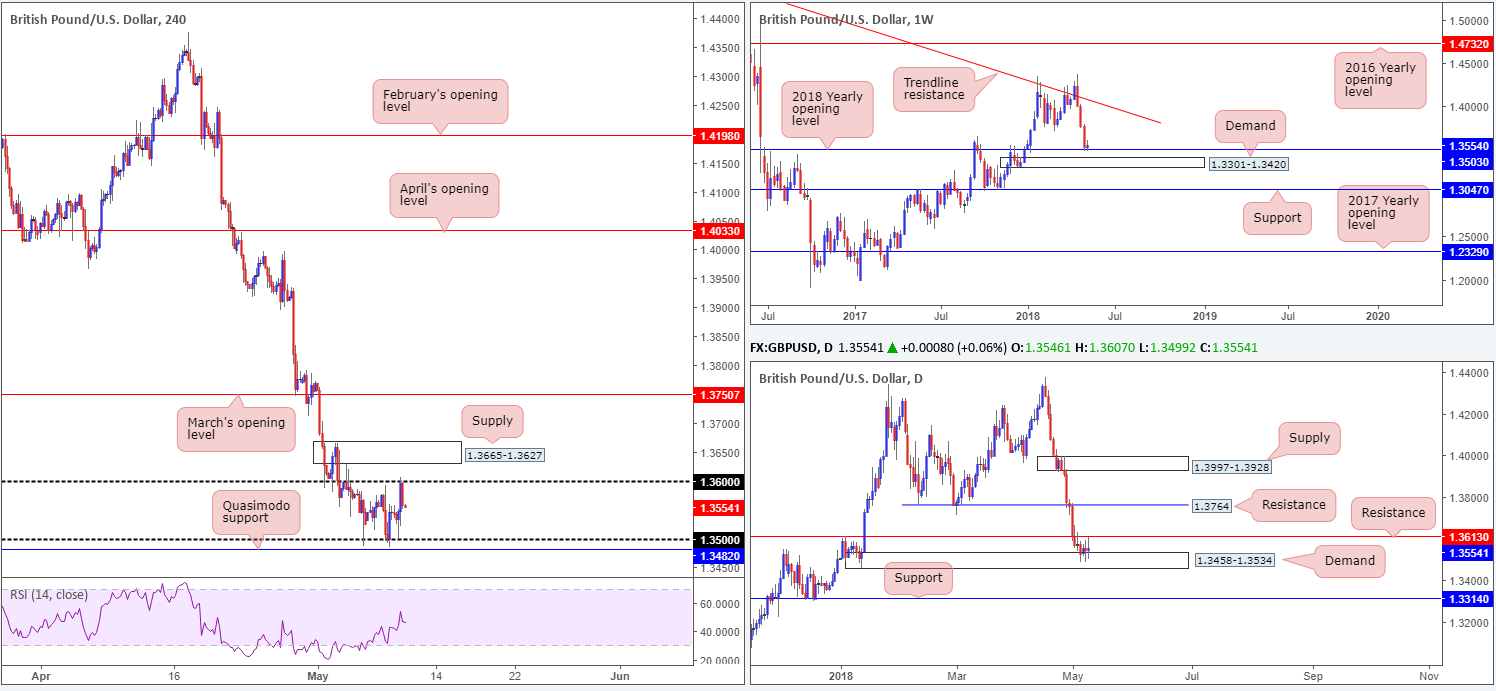
In recent movement the British pound recovered a full big figure to 1.36, likely assisted by a somewhat waning greenback. 1.36, as can be seen on the H4 timeframe, proved too much for the bulls this time, holding firm as a point of resistance thus far.
Apart from 1.36 being a watched number across the board, additional resistance was seen nearby on the daily timeframe priced in at 1.3613. Collectively, these barriers could obstruct upside from the 2018 yearly opening level placed on the weekly timeframe at 1.3503.
Potential trading zones:
Through the lens of a technical trader, the pendulum still favors a correction to the upside given the supportive structures seen in this market. As a reminder, not only do we have a yearly opening level present on the weekly timeframe, we also have a robust daily demand that encapsulates the weekly level. Further to this, though, let’s not forget nearby support seen on the H4 timeframe at 1.35 and a H4 Quasimodo level at 1.3482. Thus, the 1.3482/1.35 neighborhood could be an area to consider for long opportunities today.
However, today is super Thursday for the GBP as the Bank of England announces its interest-rate decision. As a result, technicals may take a back seat during and leading up to the release. The BoE is expected to keep monetary policy unchanged – vote split expected to be 7-2. Of the 41 analysts surveyed by Reuters, 39 expected the MPC to stand pat on rates with just two looking for a hike.
To be on the safe side, we would strongly recommend putting any technical trade ideas on the back burner until the Central bank has had its time. Should our noted supports remain in play; the 1.35 region will continue be a watched level for possible long plays.
Data points to consider today: UK manufacturing production m/m; UK goods trade balance; BoE inflation report; MPC official bank rate votes; BoE monetary policy summary and official bank rate decision; US CPI m/m; US unemployment claims.
AUD/USD:
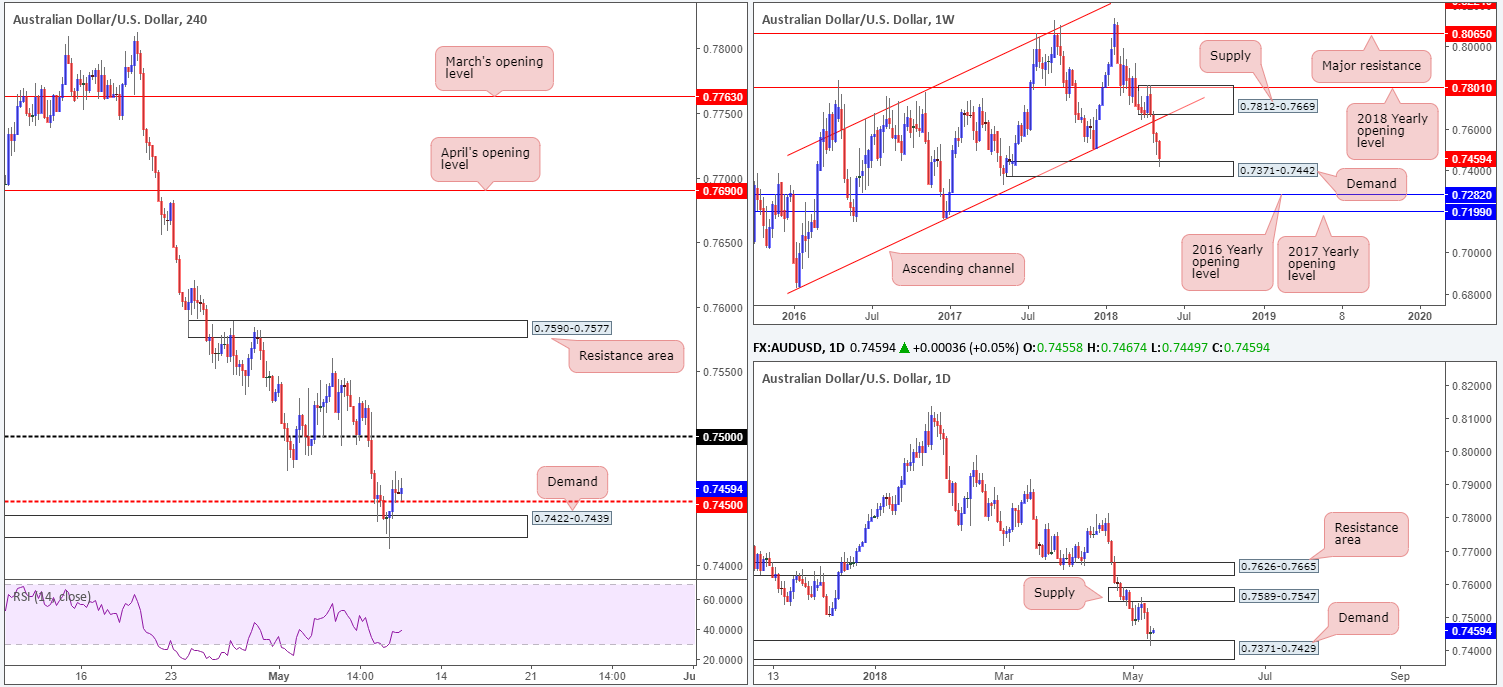
Kicking this morning’s report off with a look at the weekly timeframe, it’s clear to see that weekly price is attempting to correct from the top edge of weekly demand at 0.7371-0.7442. Sustained buying from this point could eventually see the commodity currency head towards weekly supply at 0.7812-0.7669.
Secured firmly within the lower limit of the aforementioned weekly demand, we can see that there’s a daily demand drawn from 0.7371-0.7429 that held price higher on Wednesday. Further upside from this base is plausible, targeting daily supply pinned at 0.7589-0.7547.
Glued to the top edge of the current daily demand and also positioned within the top limit of the noted weekly demand, H4 demand seen at 0.7422-0.7439 held ground on Wednesday, despite a marginal breach to the downside. Boosted by a rally in Crude oil prices, H4 mid-level resistance at 0.7450 was engulfed and is currently being retested as support. Defensive action seen from this angle may entice buyers into the market and soon bring 0.75 into the picture.
Potential trading zones:
Based on current technicals, 0.7450 has a strong chance of holding firm as support and pushing higher toward 0.75 and maybe even reaching as high as daily supply at 0.7589-0.7547. Though, at this point we’ve seen little meaningful price rotation to the upside (H4 full or near-full-bodied bull candles). Without evidence of bullish intent printed from 0.7450, engaging in a long position is chancy since let’s remember that overall sentiment (the current trend) clearly faces a southerly direction at present.
Data points to consider today: Chinese inflation figures; US CPI m/m; US unemployment claims.
USD/JPY:
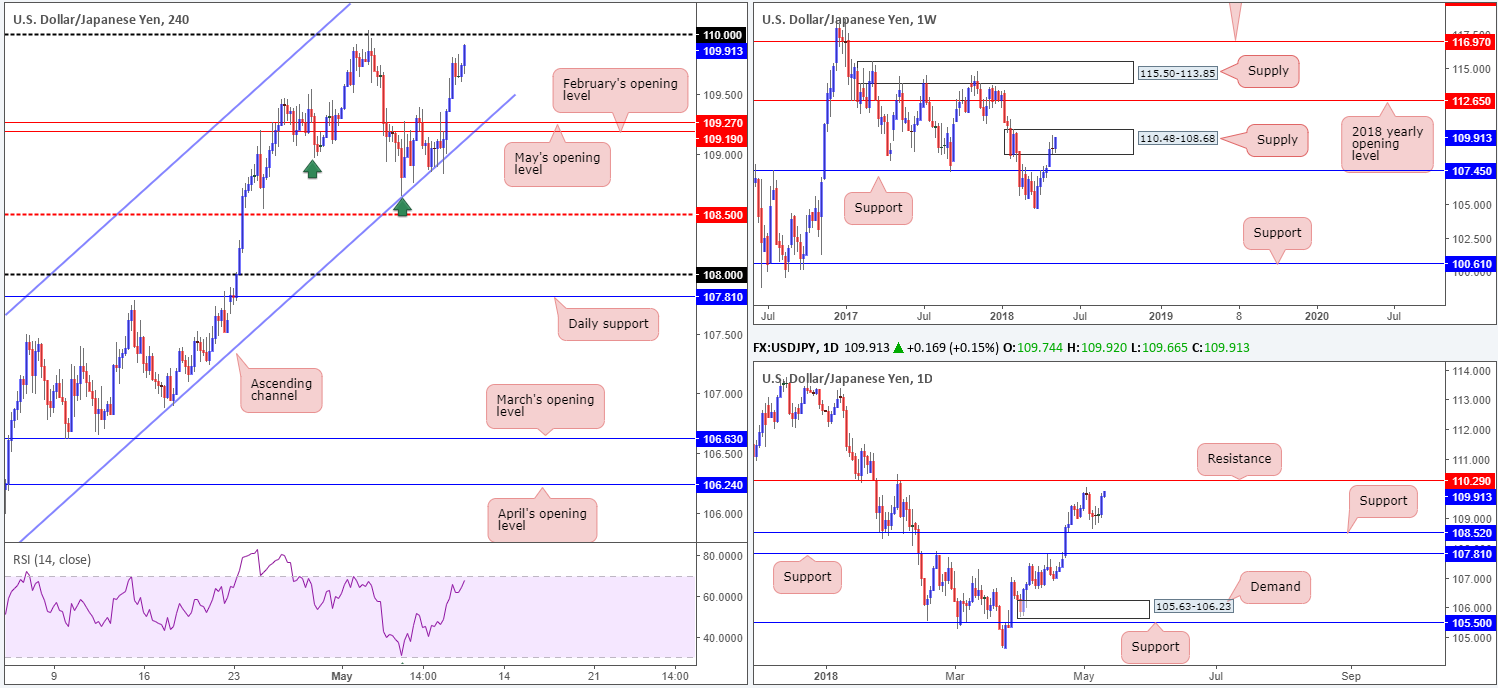
Bolstered by a positive tone in US equities and rising US Treasury yields, the USD/JPY aggressively chewed through nearby H4 resistance (109.19/109.27: February and May’s opening levels) and made tracks for higher levels over the course of Wednesday’s sessions. Rallying 0.66% on the day, the pair is now facing credible resistance from 110.
Weekly supply at 110.48-108.68 appears strained right now, as price climbs higher within its boundary. A topside breach of this base clearly exposes the 2018 yearly opening level at 112.65. Daily movement, on the other hand, shows clean resistance remains within the noted weekly supply marked at 110.29.
Potential trading zones:
The 110 neighborhood is a watched number today. Some traders will be looking to fade the level given the recent lower low printed on the H4 timeframe at 108.65 (see green arrows). With that being said, however, both momentum to the upside on the current pullback is incredibly strong, and there is a chance that price could engulf 110 to connect with daily resistance mentioned above at 110.29. For that reason, caution is recommended on the sell-side of this market.
As for buying, unfortunately things are just as delicate. Entering long into 110, or even on the break above it, is a chancy move. This is simply down to overhead higher-timeframe areas offering little room for maneuver (daily resistance and currently trading within weekly supply).
In light of the above points, opting to stand on the sidelines may be the better path to take according to the noted timeframes.
Data points to consider today: US CPI m/m; US unemployment claims.
USD/CAD:
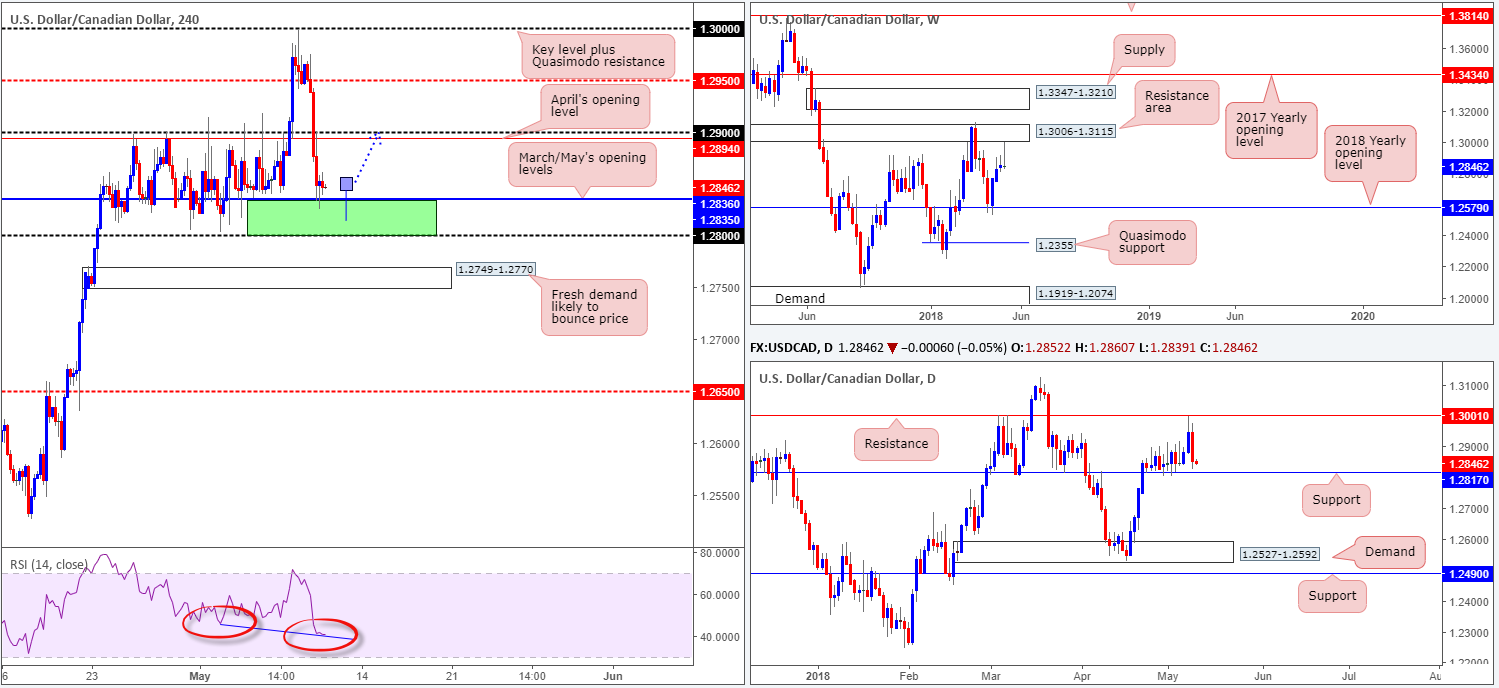
The Canadian dollar is among the top performers vs. the greenback on Wednesday, supported by sharply higher crude prices post-confirmation of the US exiting from the Iranian nuclear deal, and on a better-than-expected Canadian data: building approvals.
USD/CAD selling pushed into a higher gear as trade entered London hours, erasing orders from the H4 mid-level support at 1.2950, and wiping out the 1.29 area. We only saw the unit begin to stabilize after shaking hands with March/May’s opening levels at 1.2835/1.2836.
Weekly price, thanks to yesterday’s move lower, chalked up an eye-catching selling wick just south of a weekly resistance area printed at 1.3006-1.3115. Continuation to the downside is possible, according to this scale, and has the 2018 yearly opening level plotted at 1.2579 to target. On the daily timeframe, however, supportive structure is seen nearby at 1.2817, which, as you can see, has had a responsive history of late.
Potential trading zones:
Although weekly price suggests further selling could be on the horizon, H4 and daily structure is likely to delay this theory. In fact, between 1.28 and March/May’s opening levels on the H4 timeframe (marked in green) at 1.2836, we feel a rotation to the upside is likely, targeting 1.29 and possibly higher. An ideal buy signal from here, as far as we can see, would be a H4 bullish pin-bar formation that pierces through 1.2836 and taps the daily support mentioned above at 1.2817 (as drawn on the chart). Also worth noting is the H4 RSI supports a bounce to the upside in the shape of bullish divergence.
Data points to consider today: US CPI m/m; US unemployment claims; CAD NHPI m/m.
USD/CHF:
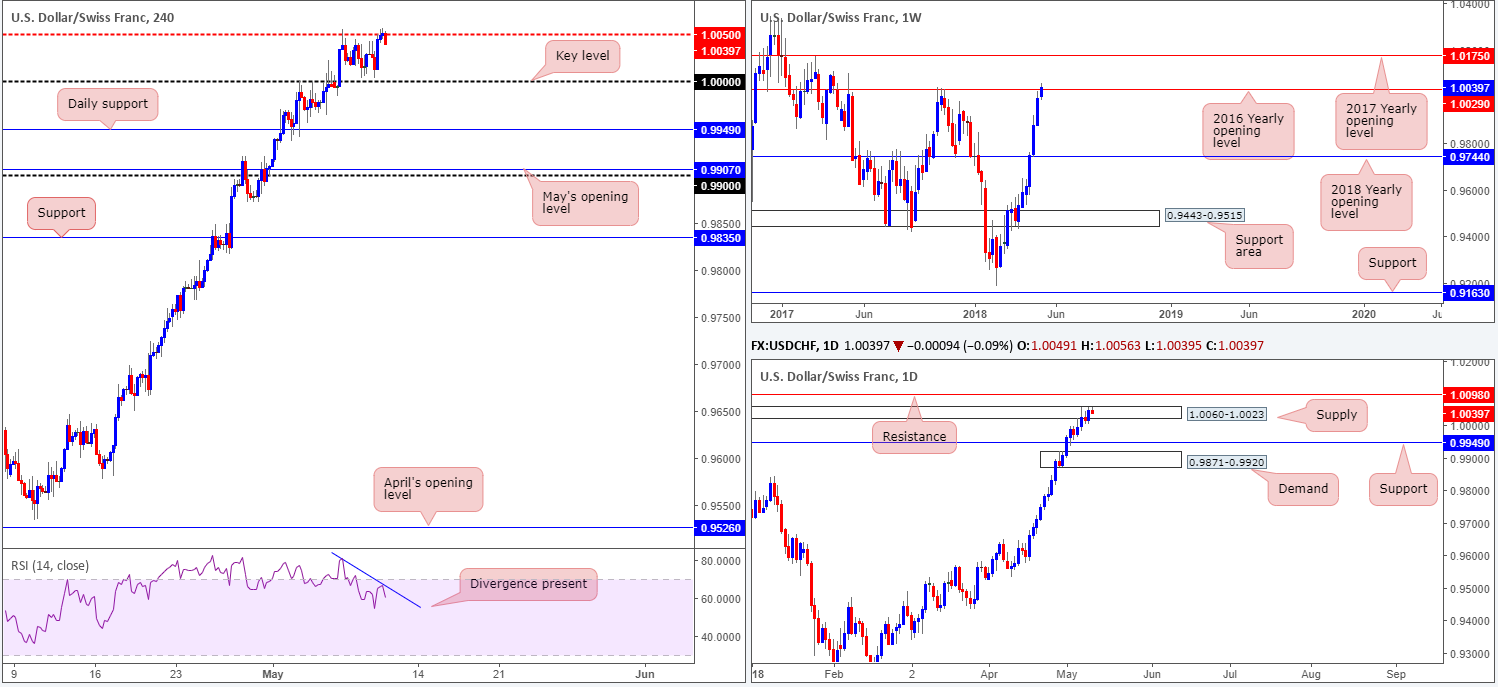
Leaving parity unchallenged, the USD/CHF rose higher on Wednesday. The H4 mid-level number 1.0050, however, once again proved a difficult barrier to overcome! Traders may have also noticed that the H4 RSI is exhibiting a downside move at the moment, possibly emphasizing a divergence reading in motion.
Likely helping the bears establish resistance off 1.0050 is the 2016 yearly opening level on the weekly timeframe at 1.0029. This is not a level one should overlook! Check out the clean rejection formed on October 2017 which dropped price in excess of 800 pips! Turning the focus over to the daily timeframe, the candles remain within the walls of a daily supply carved from 1.0060-1.0023 (encapsulates current weekly level), but appears in a fragile state. The next upside target on this scale falls in at 1.0098: a daily resistance.
Potential trading zones:
While both weekly and daily price are seen interacting with higher-timeframe resistances, price action has printed little to reflect that. A decisive H4 close above 1.0050 today would, in our opinion, likely ‘seal the deal’ for a test of daily resistance at 1.0098 – effectively representing the 1.0100 handle on the H4 timeframe.
A close above 1.0050 followed up with a retest as support offers a potential intraday long play to consider, targeting 1.01s. In the event of a downside move being observed from 1.0050, parity remains appealing for a retest play to the upside, with 1.0050 being the obvious (initial) intraday target.
Data points to consider today: US CPI m/m; US unemployment claims; Swiss banks closed in observance of Ascension Day.
DOW 30:
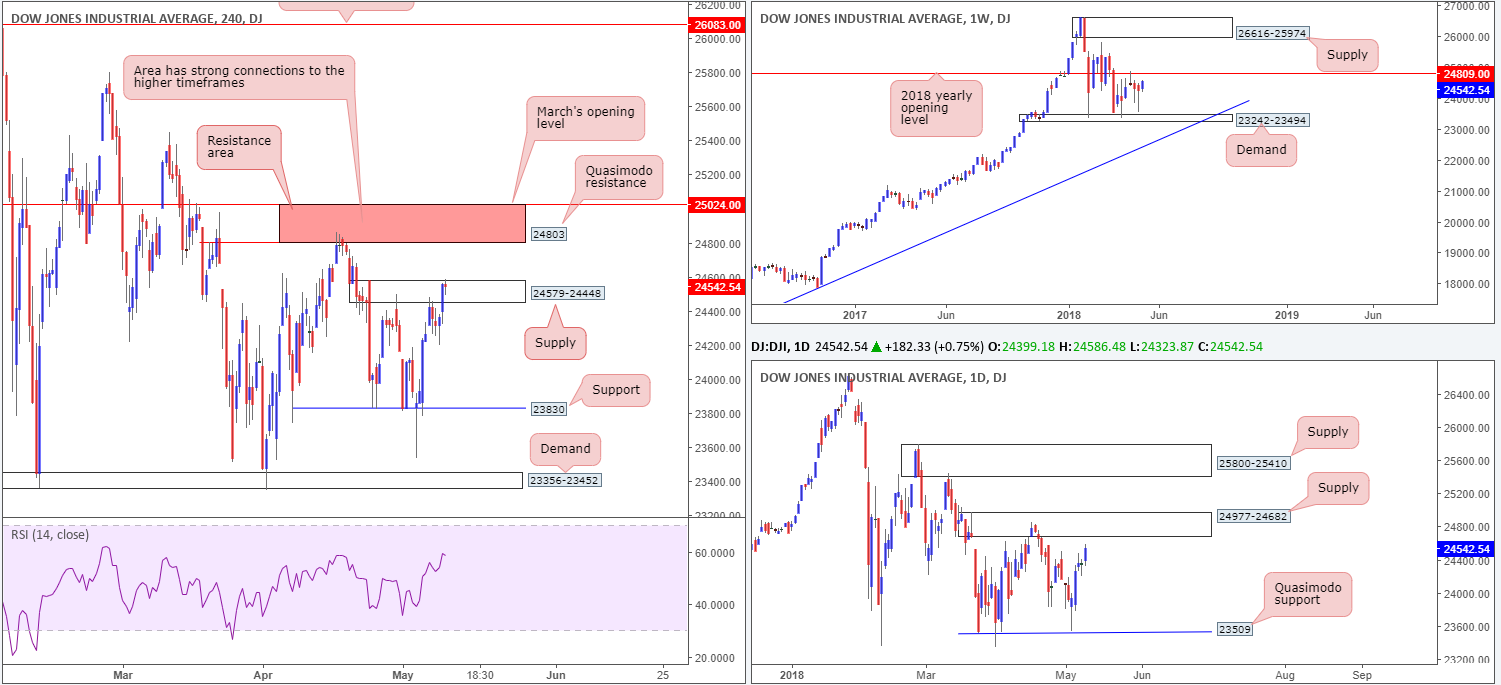
The Dow Jones Industrial Average started Wednesday’s segment on strong footing. Crude oil prices soared higher in reaction to US President Trump’s decision to abandon the Iran nuclear deal, which supported today’s modest gains as energy stocks advanced. Despite a favorable start to the day, however, upside momentum diminished in the second half of the session as strong oil prices lifted inflation expectations.
The H4 candles remain capped at H4 supply marked from 24579-24448, despite a marginal breach to the upside. This area, as visible on the chart, has already proven its value (see April 30) and therefore could still potentially send prices lower once more. Regardless of this, the area we continue to advertise is the H4 resistance zone marked in red from 25024/24803 (comprised of March’s opening level and a H4 Quasimodo resistance). The reason behind this comes down to its connections with daily supply noted at 24977-24682,and also due to the H4 zone housing the 2018 yearly opening level at 24809 seen on the weekly timeframe.
Potential trading zones:
Having seen the confluence surrounding the current H4 resistance area, shorting from the H4 supply below it at 24579-24448 might not be the best path to take.
As a result, traders may want to consider placing alerts for potential sell trades at the underside of the H4 resistance area. Stop-loss orders, technically speaking, would be best placed above 25024, clearing not only the top edge of daily supply but also the H4 resistance zone as well.
Data points to consider today: US CPI m/m; US unemployment claims.
GOLD:
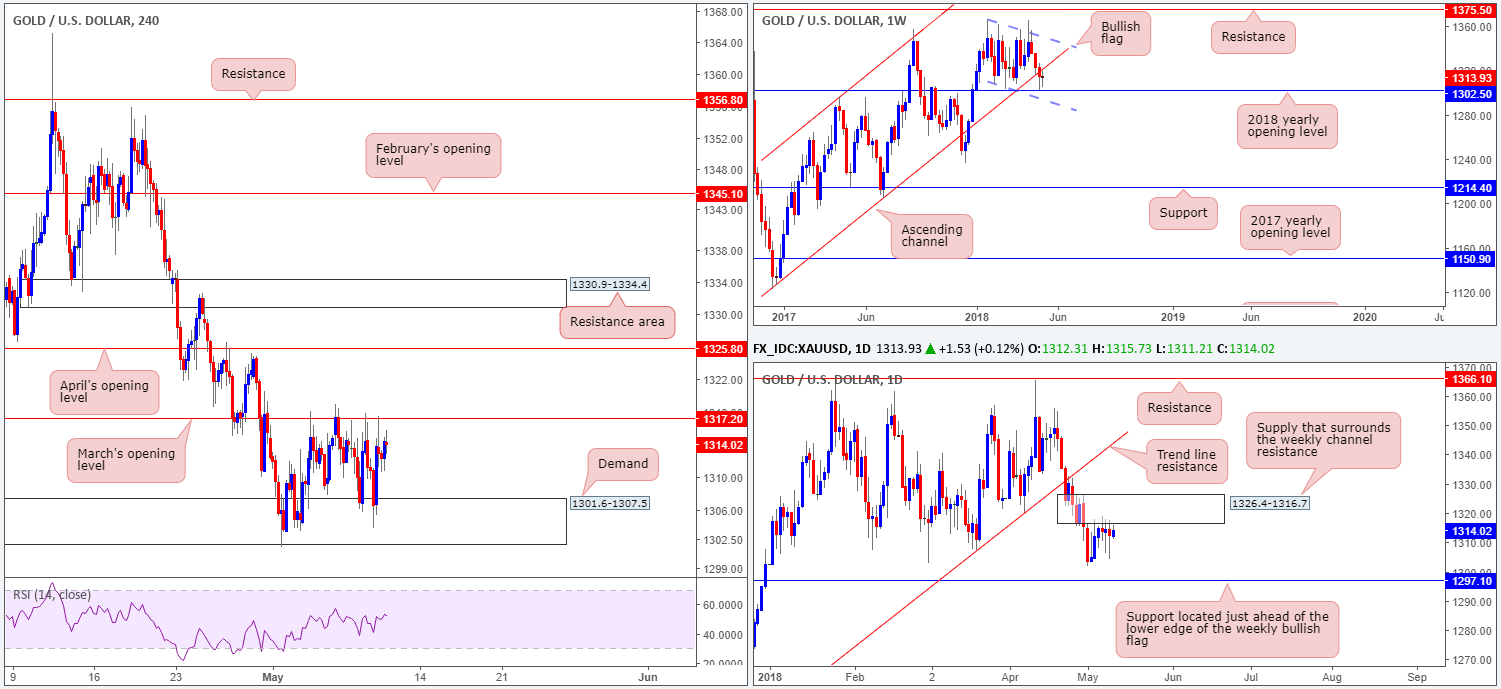
As is clearly evident on the H4 timeframe, the yellow metal is currently emphasizing a directionless state in the form of a consolidation. Since the beginning of the month the H4 candles have been oscillating amid H4 demand at 1301.6-1307.5, and March’s opening level plotted at 1317.2 (seen positioned within the lower limit of daily supply at 1326.4-1316.7, which itself surrounds the weekly channel support taken from the low 1302.5).
A violation of March’s band may call for a move towards April’s opening level plotted at 1325.8; whereas a move below the current H4 demand has daily support at 1297.1 in sight (happens to be located just ahead of the lower edge of the weekly bullish flag taken from the low 1307.2).
Potential trading zones:
Selling from the aforementioned daily supply seems the more logical route at the moment, in view of its connection to weekly structure. However, H4 players may struggle to short here – the H4 demand mentioned above at 1301.6-1307.5 leaves little room for the sellers to stretch their legs! Given this, the team continues to look for H4 price to break higher and test April’s opening level for possible shorting opportunities (positioned within upper limit of noted daily supply). That way, H4 price should have room to work and bring prices lower.
Stop-loss orders are best positioned above the daily supply (1326.4). Conservative traders, on the other hand, may want to consider waiting for a H4 bearish rotation candle (preferably a full-bodied formation) to form before pulling the trigger.
This site has been designed for informational and educational purposes only and does not constitute an offer to sell nor a solicitation of an offer to buy any products which may be referenced upon the site. The services and information provided through this site are for personal, non-commercial, educational use and display. IC Markets does not provide personal trading advice through this site and does not represent that the products or services discussed are suitable for any trader. Traders are advised not to rely on any information contained in the site in the process of making a fully informed decision.
This site may include market analysis. All ideas, opinions, and/or forecasts, expressed or implied herein, information, charts or examples contained in the lessons, are for informational and educational purposes only and should not be construed as a recommendation to invest, trade, and/or speculate in the markets. Any trades, and/or speculations made in light of the ideas, opinions, and/or forecasts, expressed or implied herein, are committed at your own risk, financial or otherwise.
The use of the site is agreement that the site is for informational and educational purposes only and does not constitute advice in any form in the furtherance of any trade or trading decisions.
The accuracy, completeness and timeliness of the information contained on this site cannot be guaranteed. IC Markets does not warranty, guarantee or make any representations, or assume any liability with regard to financial results based on the use of the information in the site.
News, views, opinions, recommendations and other information obtained from sources outside of www.icmarkets.com.au, used in this site are believed to be reliable, but we cannot guarantee their accuracy or completeness. All such information is subject to change at any time without notice. IC Markets assumes no responsibility for the content of any linked site. The fact that such links may exist does not indicate approval or endorsement of any material contained on any linked site.
IC Markets is not liable for any harm caused by the transmission, through accessing the services or information on this site, of a computer virus, or other computer code or programming device that might be used to access, delete, damage, disable, disrupt or otherwise impede in any manner, the operation of the site or of any user’s software, hardware, data or property.


