
DXY:
The DXY chart is presently characterized by a neutral overall momentum, implying a lack of discernible directional bias. In light of this neutral stance, it is conceivable that the price may exhibit fluctuations within the range defined by the 1st resistance at 102.78 and the 1st support at 102.31. Notably, the 1st support level derives its significance as an overlap support and is reinforced by the presence of a 38.20% Fibonacci retracement level. In addition, a secondary support at 101.95 reinforces this range as an overlap support. On the opposite spectrum, the 1st resistance at 102.78 is identified as an overlap resistance. Furthermore, an additional layer of resistance is found at the 2nd resistance level of 103.43, distinguished as a multi-swing high resistance.

EUR/USD:
The EUR/USD chart currently reflects a neutral overall momentum, suggesting an absence of a clear directional bias. Given this neutrality, there is a potential for the price to oscillate within the range defined by the 1st resistance at 1.1038 and the 1st support at 1.0959. The 1st support level is notable as an overlap support, with a secondary support at 1.0917 also enhancing its significance. Correspondingly, the 1st resistance at 1.1038 is identified as an overlap resistance. Moreover, an intermediate resistance is noted at 1.1007, distinguished by its alignment as a multi-swing high resistance.
In addition to these observations, a symmetrical triangle chart pattern is evident, which typically signifies a phase of consolidation before a subsequent breakout or breakdown. Notably, a bullish breakout might be indicated by a breach above the upper trendline of the pattern, while a bearish breakdown could be suggested by a breach below the lower trendline.

EUR/JPY:
The EUR/JPY chart suggests a bullish overall momentum. There is potential for a bullish break through the 1st resistance level and a subsequent rise to the 2nd resistance level.
The 1st support is positioned at 156.02 and is considered supportive due to its multi-swing low support characteristics. Additionally, the 2nd support at 155.23 is seen as beneficial because it represents an overlap support.
On the resistance side, the 1st resistance level at 157.95 is notable as it signifies a multi-swing high resistance. Furthermore, the 2nd resistance at 159.91 is considered significant due to its representation of a 127.20% Fibonacci extension.

EUR/GBP:
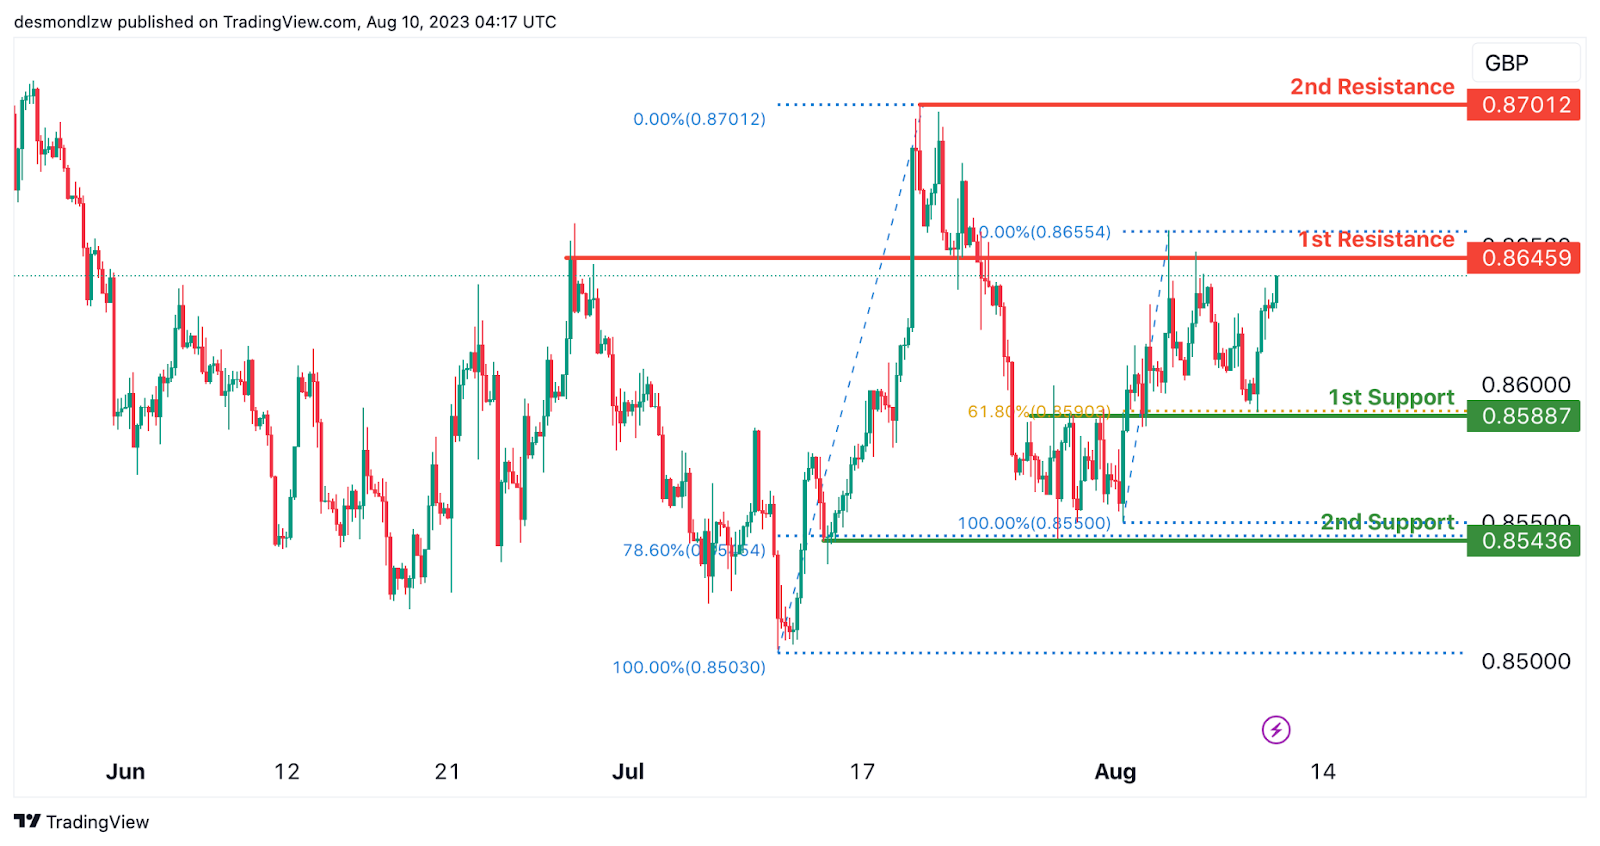
The EUR/GBP chart reflects a bullish overall momentum. There is potential for a bullish continuation towards the 1st resistance level.
The 1st support is positioned at 0.8588 and is considered advantageous due to its pullback support and a 61.80% Fibonacci retracement. Additionally, the 2nd support at 0.8543 is seen as beneficial because it represents a swing low support and a 78.60% Fibonacci retracement.
On the resistance side, the 1st resistance level at 0.8645 is notable as it signifies an overlap resistance. Furthermore, the 2nd resistance at 0.8701 is considered significant due to its swing high resistance characteristics.
GBP/USD:
The GBP/USD chart currently indicates a bullish overall momentum, implying a prevailing upward trend.
Given this bullish sentiment, there exists the potential for the price to sustain a bullish continuation towards the 1st resistance level at 1.2785.
The 1st support level, situated at 1.2698, derives its significance as a multi-swing low support. Additionally, a 2nd support at 1.2651 reinforces the supportive structure.
Conversely, the 1st resistance level at 1.2785 gains prominence as a multi-swing high resistance, potentially impeding further upward movement.
Further upward pressure is suggested by a 2nd resistance at 1.2815, characterized as a pullback resistance.

GBP/JPY:
The GBP/JPY chart indicates a bearish overall momentum. There is a potential for a bearish reaction off the 1st resistance level, leading to a drop towards the 1st support level.
The 1st support is located at 181.89 and is considered good due to its overlap support characteristics. Additionally, the 2nd support at 180.59 is viewed as a valuable level because of its multi-swing low support and a 38.20% Fibonacci retracement.
On the resistance side, the 1st resistance level at 183.13 is considered noteworthy as it represents a multi-swing high resistance. Furthermore, the 2nd resistance at 183.79 is significant due to its multi-swing high resistance characteristics.

USD/CHF:
The USD/CHF chart currently demonstrates a bearish momentum, indicating a prevailing downward trend.
Considering this bearish sentiment, there is a potential for the price to extend its bearish movement towards the 1st support level.
The 1st support, situated at 0.8718, holds significance as it aligns with an overlap support.
Furthermore, a secondary support at 0.8678 reinforces the support structure.
Conversely, the 1st resistance level at 0.8776 is of note due to its identification as a multi-swing high resistance, which could hinder further upward movement.
Additionally, a 2nd resistance at 0.8824 is identified as a pullback resistance, further enhancing the resistance potential.

USD/JPY:
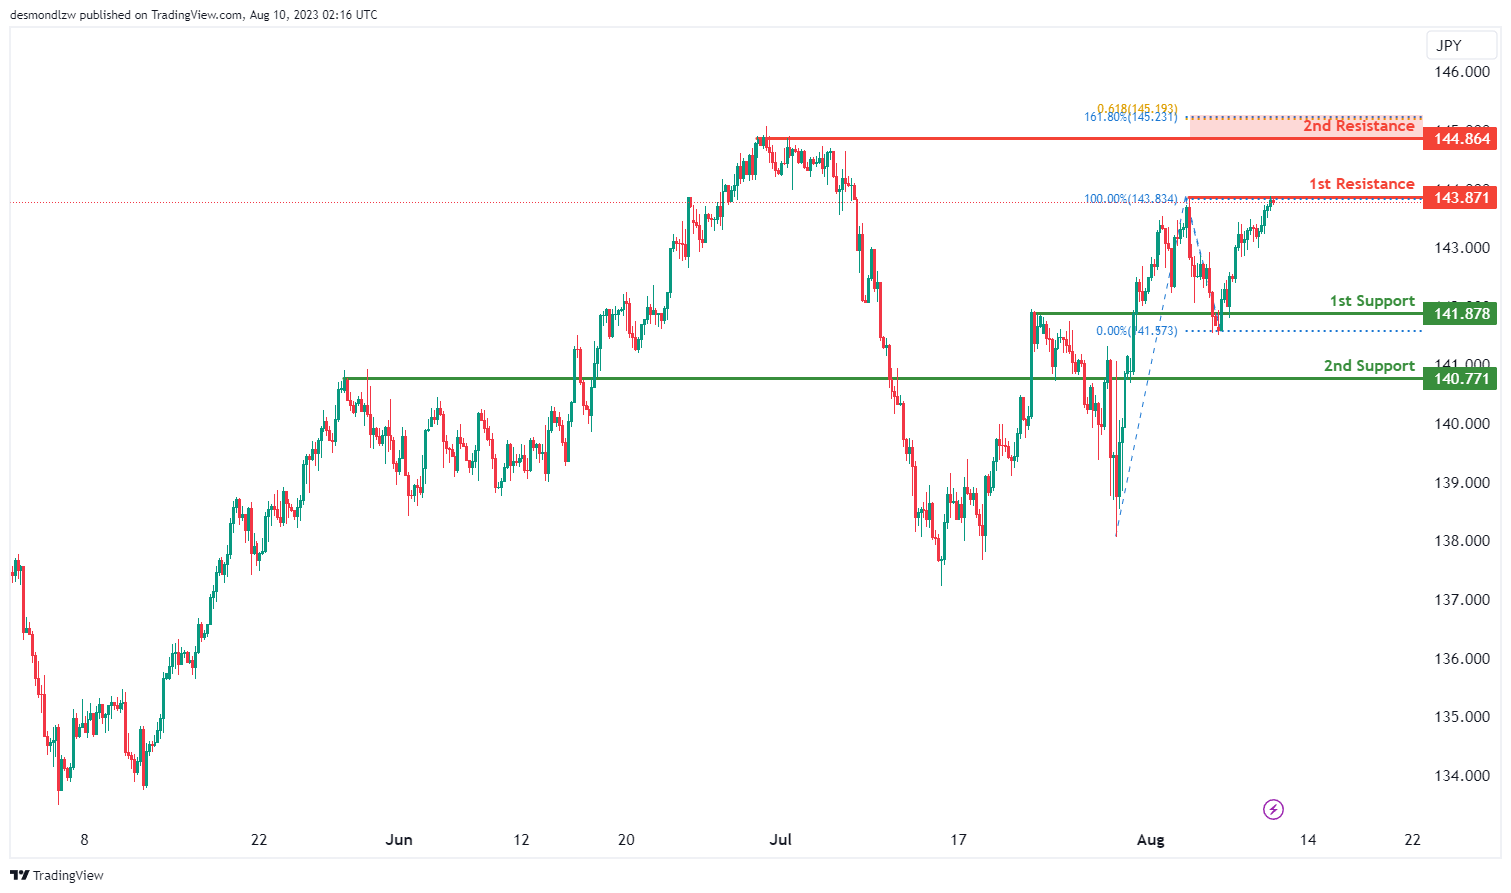
The USD/JPY chart currently reflects a weak bullish momentum with low confidence, suggesting a modest upward trend.
In this context, there is a potential scenario where the price could execute a bullish breakout through the 1st resistance level and ascend towards the 2nd resistance.
The 1st support level, positioned at 141.87, garners significance as an overlap support.
Similarly, a secondary support at 140.77 reinforces the supportive foundation.
Conversely, the 1st resistance level at 143.87 is notable for its characterization as a swing high resistance.
Furthermore, the 2nd resistance level at 144.86 gains prominence due to its identification as a pullback resistance. Notably, the presence of a 161.80% Fibonacci Extension and a 61.80% Fibonacci Projection signifies a confluence of Fibonacci levels, adding strength to its resistance potential.
USD/CAD:
The USD/CAD chart currently depicts a bearish momentum, indicating a potential for the price to possibly extend its bearish movement towards the 1st support level.
The 1st support, positioned at 1.3408, represents an overlap support that aligns with the 23.60% Fibonacci retracement level. Further below, the 2nd support at 1.3374 is an overlap support that aligns with the 38.20% Fibonacci retracement level.
To the upside, the 1st resistance level at 1.3502 is a swing high resistance which could act as a significant barrier should price reach this level. Should price break above this barrier, the 2nd resistance is at 1.3569 which is an overlap resistance that could limit any further upward movement in price.

AUD/USD:
The AUD/USD chart currently reflects a neutral momentum, suggesting an absence of a clear directional bias. In light of this neutrality, there is a potential for the price to fluctuate within the range defined by the 1st resistance and the 1st support levels.
The 1st support level, situated at 0.6503, holds significance as both a swing-low support that aligns with the 61.80% Fibonacci projection level. Further below, the 2nd support at 0.6463 is a swing-low support with added significance due to its alignment with the -27.20% Fibonacci expansion and a 100.00% Fibonacci projection levels, indicating a Fibonacci confluence.
To the upside, the 1st resistance at 0.6558 acts as an overlap resistance that coincides with the 61.80% Fibonacci retracement level. Furthermore, the 2nd resistance level at 0.6605 is identified as an overlap resistance, further reinforcing its potential to hinder any upwards price movements.

NZD/USD
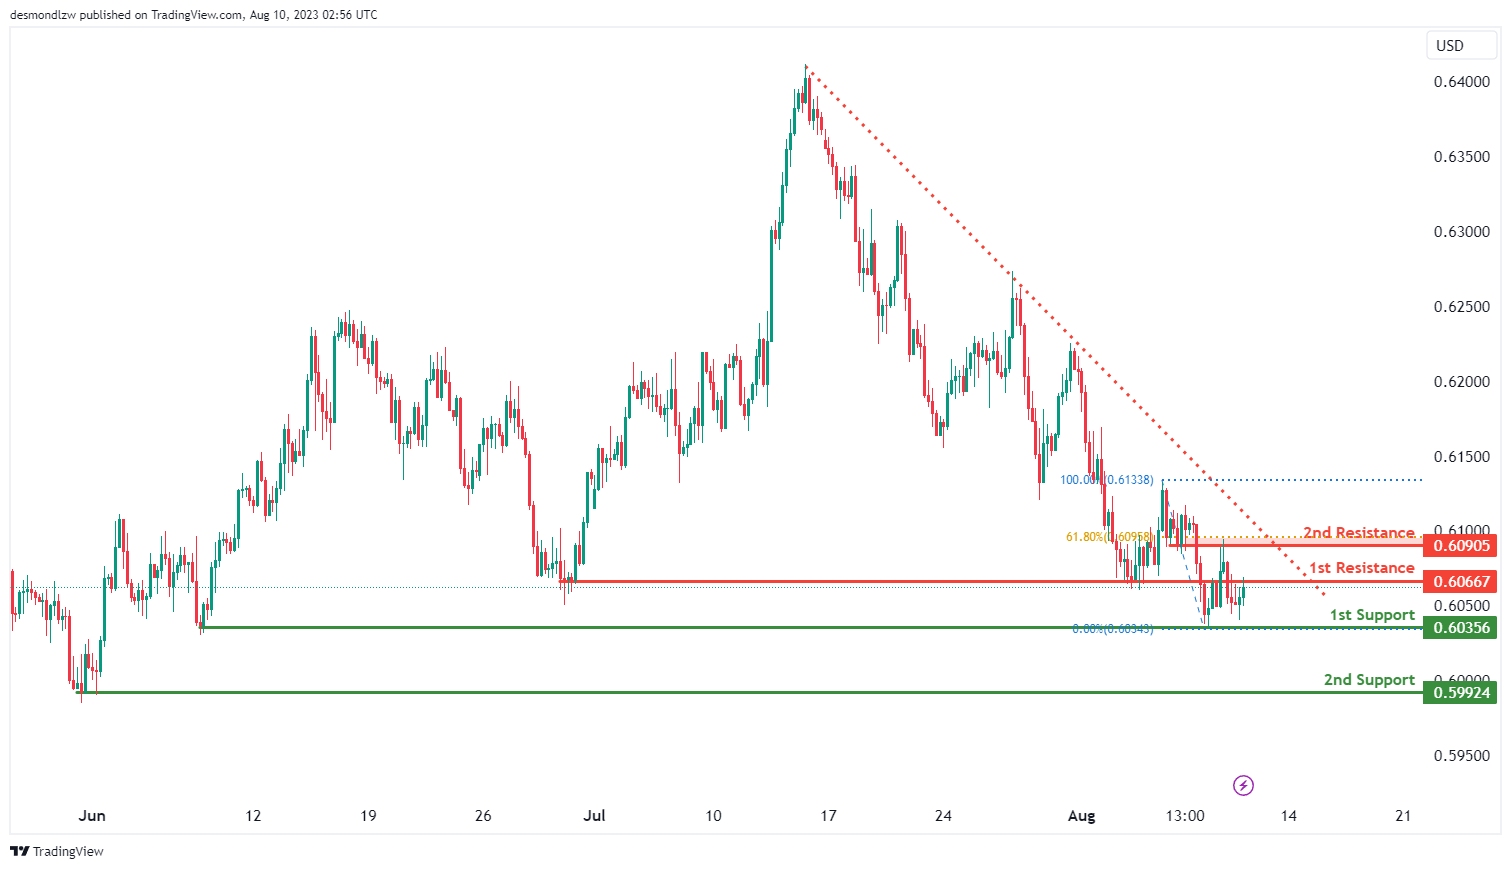
The NZD/USD chart presently indicates a neutral momentum, suggesting a lack of a distinct directional bias. Given this neutrality, it is plausible for the price to potentially exhibit fluctuations within the range defined by the 1st resistance and 1st support levels.
The 1st support level is at 0.6036 and represents an overlap support. The 2nd support level at 0.5992 is also notable, identified as a swing low support.
To the upside, the 1st resistance at 0.6067 is an overlap resistance. Furthermore, the 2nd resistance at 0.6091 is identified as an overlap resistance that aligns with the 61.80% Fibonacci retracement level.
DJ30:
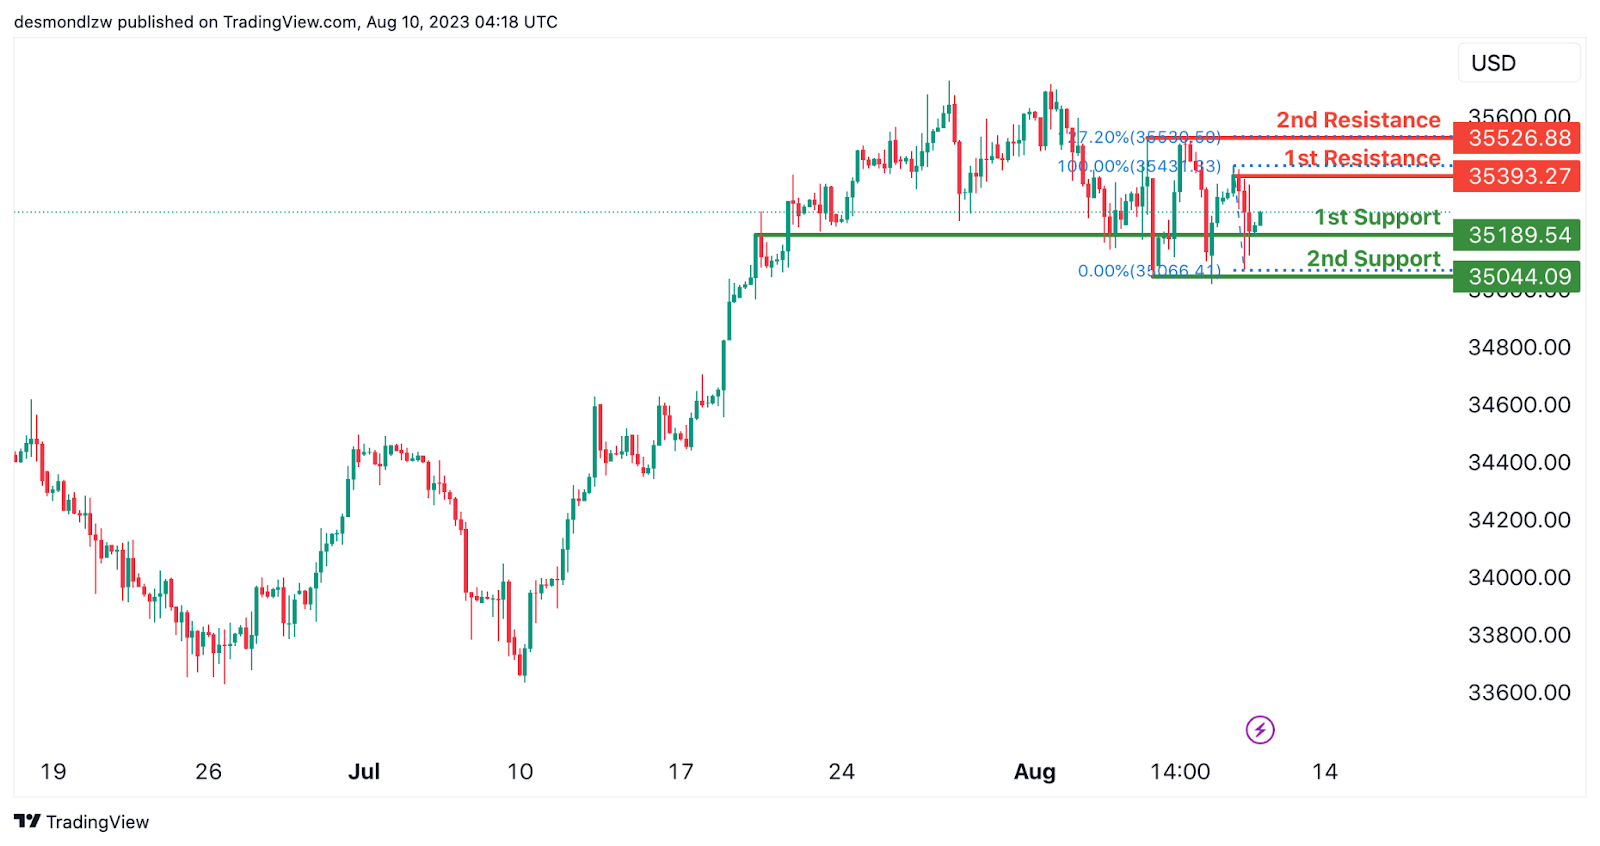
The DJ30 chart displays a bullish overall momentum. There is potential for a bullish continuation towards the 1st resistance level.
The 1st support is positioned at 35189.54 and is considered favorable due to its overlap support characteristics. Additionally, the 2nd support at 35044.09 is seen as a valuable level because of its multi-swing low support properties.
On the resistance side, the 1st resistance level at 35393.27 is notable as it represents a swing high resistance. Furthermore, the 2nd resistance at 35526.88 is considered significant due to its multi-swing high resistance characteristics and a 127.20% Fibonacci extension.
GER30:
The GER30 chart reflects a bullish overall momentum. There is potential for a bullish continuation towards the 1st resistance level.
The 1st support is positioned at 15833.90 and is considered advantageous due to its overlap support and a 50% Fibonacci retracement. Additionally, the 2nd support at 15714.10 is seen as a valuable level because of its swing low support and a 78.60% Fibonacci retracement.
On the resistance side, the 1st resistance level at 16003.03 is notable as it represents a pullback resistance and a 61.80% Fibonacci projection. Furthermore, the 2nd resistance at 16240.68 is considered significant due to its overlap resistance characteristics.

US500
The US500 chart indicates a bullish overall momentum. There is potential for a bullish continuation towards the 1st resistance level.
The 1st support is located at 4474.7 and is considered supportive due to its multi-swing low support characteristics. Additionally, the 2nd support at 4455.5 is seen as beneficial because it represents a pullback support.
On the resistance side, the 1st resistance level at 4511.9 is notable as it signifies a swing high resistance and a 100% Fibonacci projection. Furthermore, the 2nd resistance at 4533.1 is considered significant due to its overlap resistance characteristics.

BTC/USD:
The BTC/USD chart shows a bearish overall momentum. There is a potential for a bearish continuation towards the 1st support level.
The 1st support is positioned at 29277 and is considered advantageous due to its pullback support and a 61.80% Fibonacci retracement. Furthermore, the 2nd support at 28827 is also seen as a valuable level because of its multi-swing low support characteristics.
On the resistance side, the 1st resistance level at 29707 is considered noteworthy as it represents an overlap resistance. Additionally, the 2nd resistance at 30200 is significant due to its swing high resistance and a 50% Fibonacci retracement.

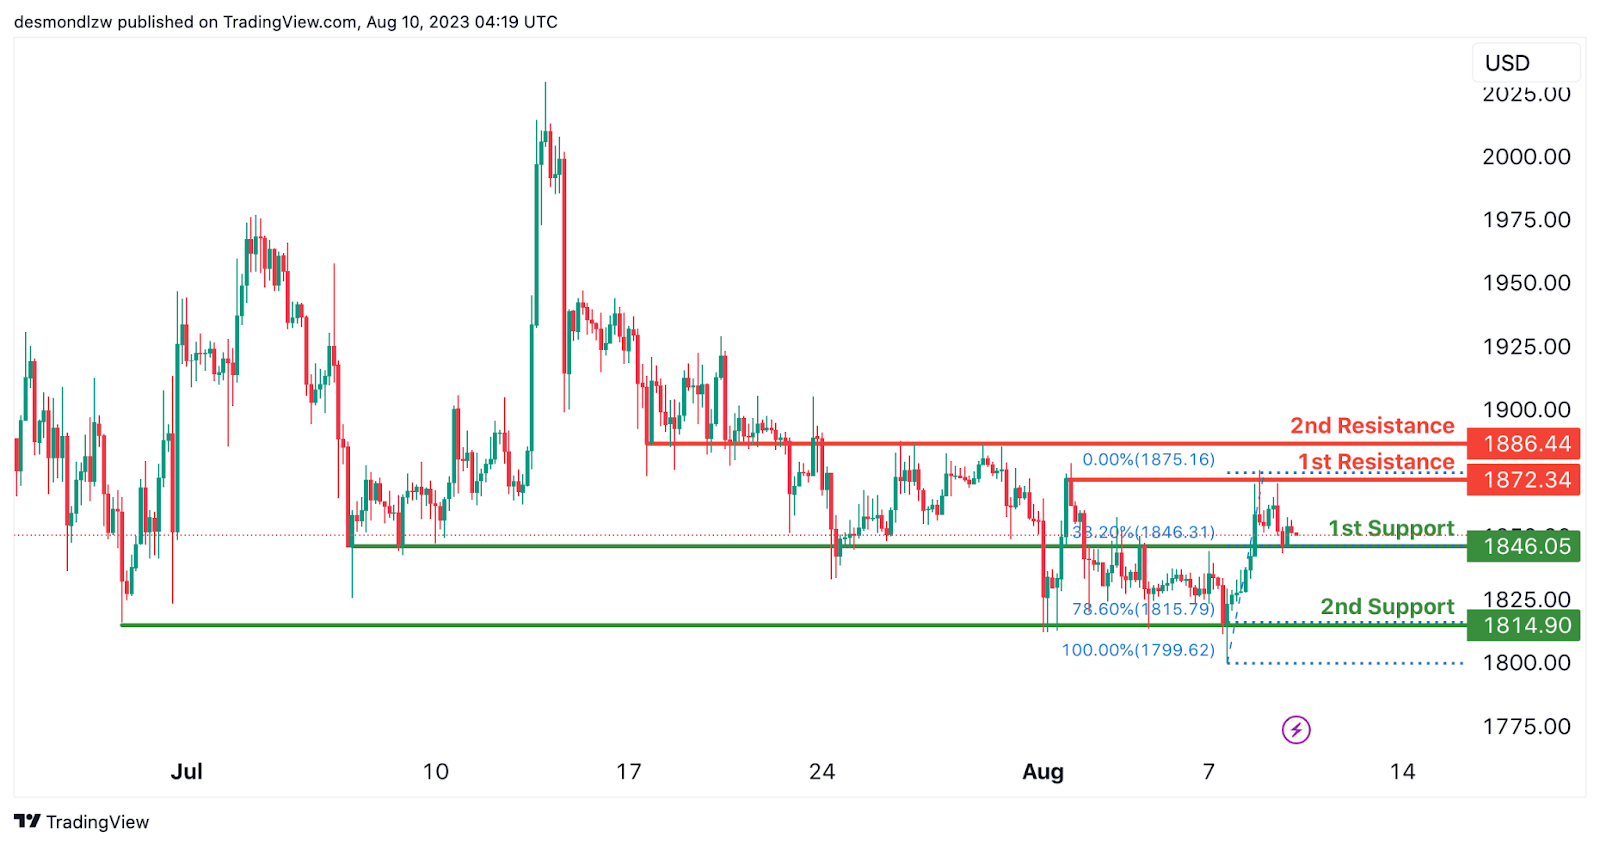
ETH/USD:
The ETH/USD chart indicates a bearish overall momentum. There is a potential for a bearish continuation towards the 1st support level.
The 1st support is located at 1816.05 and is considered favorable due to its overlap support and a 38.20% Fibonacci retracement. Additionally, the 2nd support at 1814.90 is also seen as a valuable level because of its multi-swing low support and a 78.60% Fibonacci retracement.
On the resistance side, the 1st resistance level at 1872.34 is noteworthy as it represents a multi-swing high resistance. Furthermore, the 2nd resistance at 1886.44 is considered significant due to its overlap resistance characteristics.
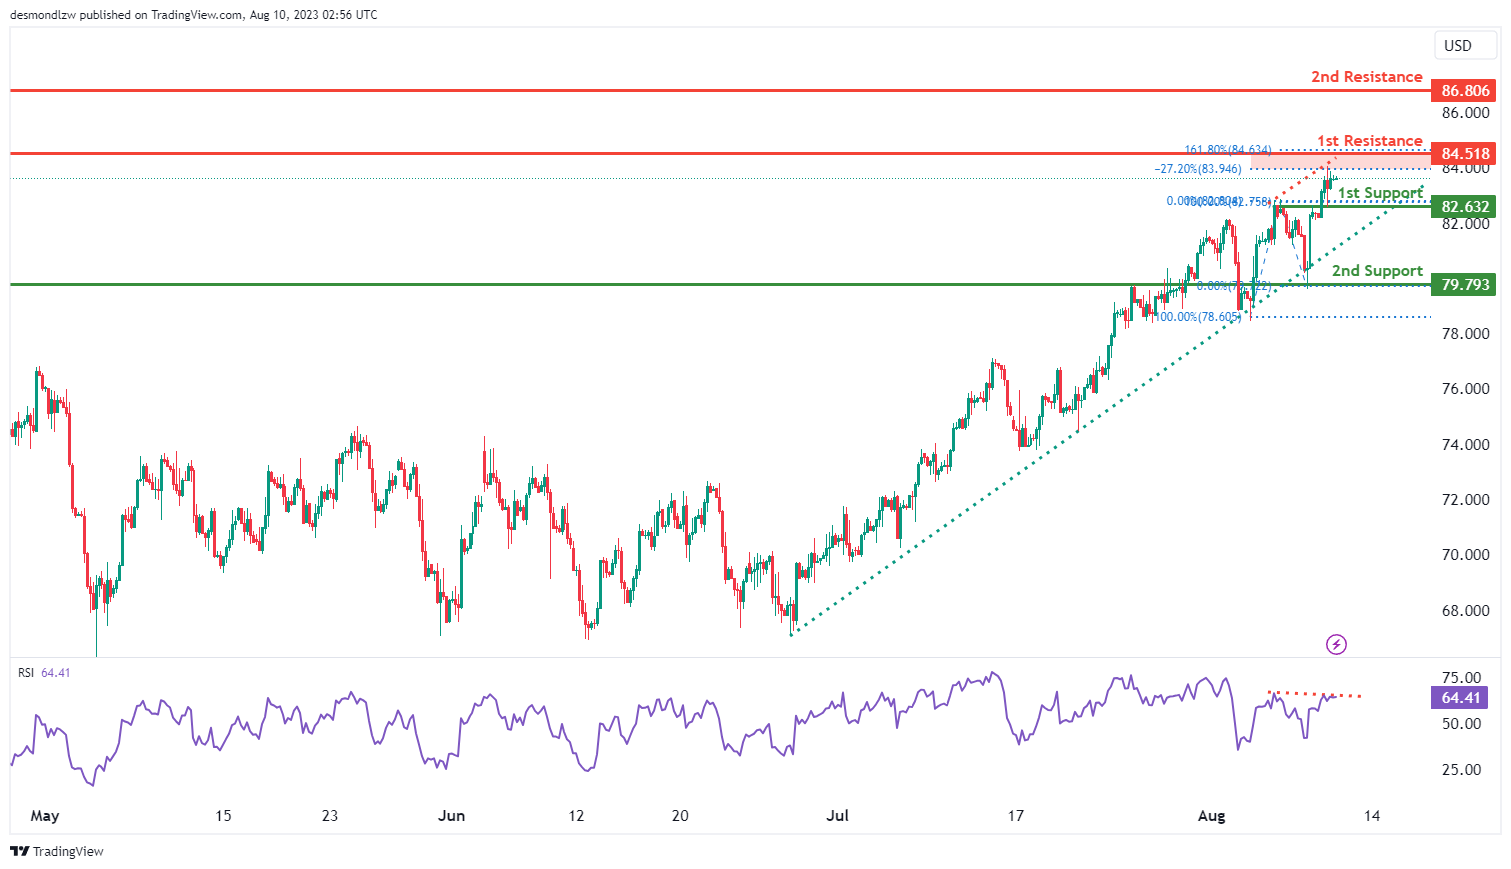
WTI/USD:
The WTI/USD chart currently showcases a bullish momentum, supported by its position above a significant ascending trend line, which signals the potential for further bullish momentum. Given this bullish outlook, there is a possibility for the price to extend its bullish movement towards the 1st resistance level. However, the Relative Strength Index (RSI) is exhibiting a bearish divergence in relation to price, indicating the possibility of an impending reversal.
The 1st support level, situated at 82.63, is recognized as an overlap support while the 2nd support at 79.79 is also identified as an overlap support.
To the upside, the 1st resistance at 84.52 gains importance as an overlap resistance that aligns with the -27.20% Fibonacci expansion and the 161.80% Fibonacci extension levels, signifying a Fibonacci confluence. In addition, the 2nd resistance level at 86.81 is identified as an overlap resistance.
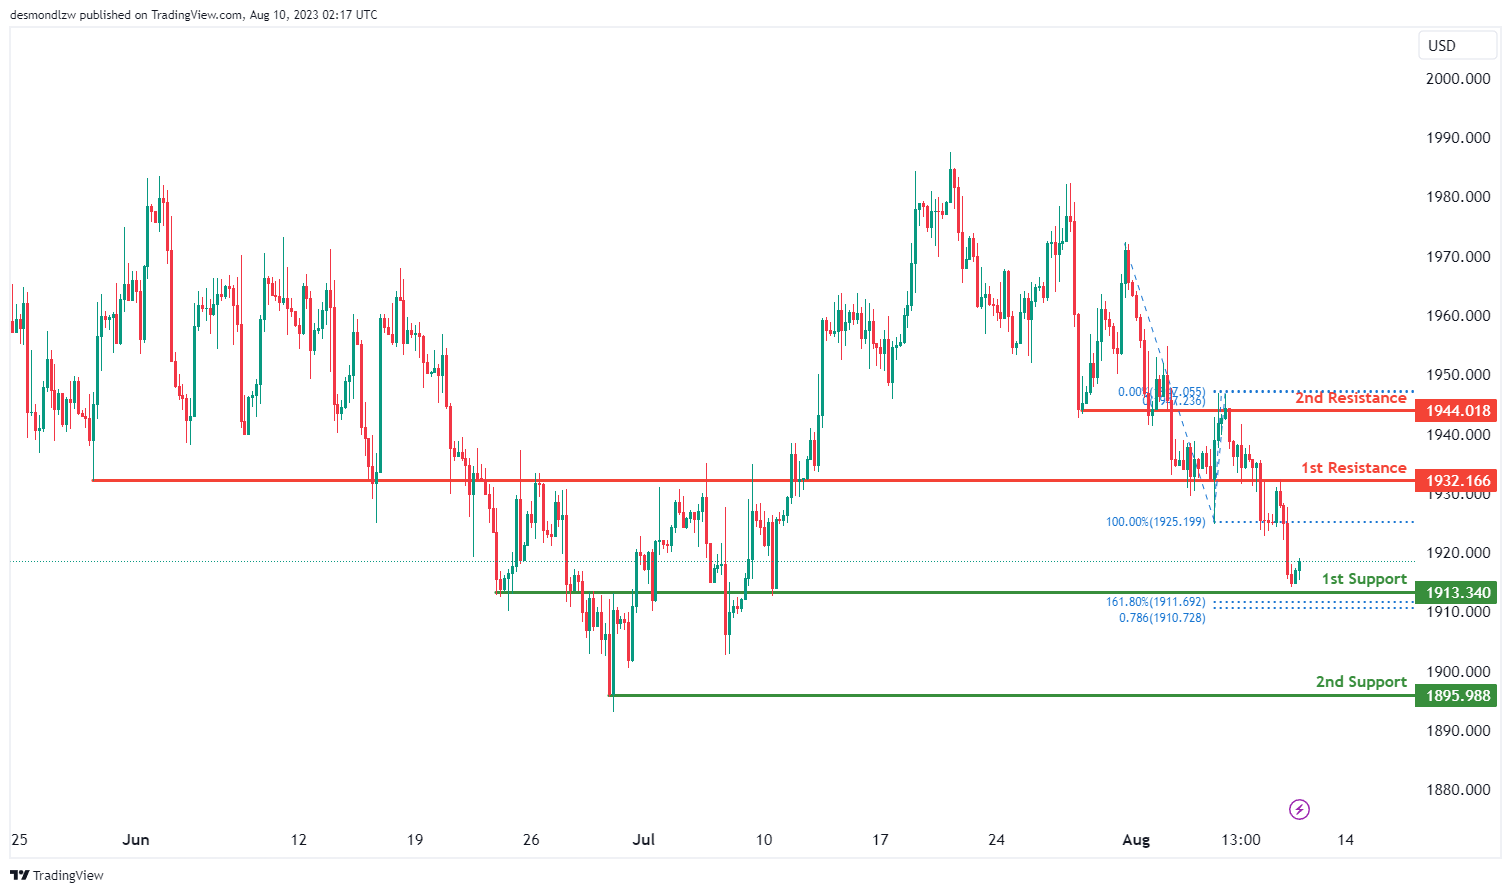
XAU/USD (GOLD):
The XAU/USD chart presently portrays a bullish momentum, indicating a prevailing upward trend.
Within this context, there exists the potential for a bullish continuation towards the 1st resistance level.
The 1st support level, situated at 1913.34, is underscored by its status as an overlap support, notably converging with a 161.80% Fibonacci Extension and a 78.60% Fibonacci Projection, indicative of Fibonacci confluence.
A secondary support at 1895.98 enhances the support structure, identified as a swing low support.
Conversely, the 1st resistance level at 1932.16 is of significance as an overlap resistance.
Furthermore, the presence of a 2nd resistance level at 1944.01 as an overlap resistance adds to its prominence in influencing potential price movement.
The accuracy, completeness and timeliness of the information contained on this site cannot be guaranteed. IC Markets does not warranty, guarantee or make any representations, or assume any liability regarding financial results based on the use of the information in the site.
News, views, opinions, recommendations and other information obtained from sources outside of www.icmarkets.com, used in this site are believed to be reliable, but we cannot guarantee their accuracy or completeness. All such information is subject to change at any time without notice. IC Markets assumes no responsibility for the content of any linked site.
The fact that such links may exist does not indicate approval or endorsement of any material contained on any linked site. IC Markets is not liable for any harm caused by the transmission, through accessing the services or information on this site, of a computer virus, or other computer code or programming device that might be used to access, delete, damage, disable, disrupt or otherwise impede in any manner, the operation of the site or of any user’s software, hardware, data or property.


