
DXY:
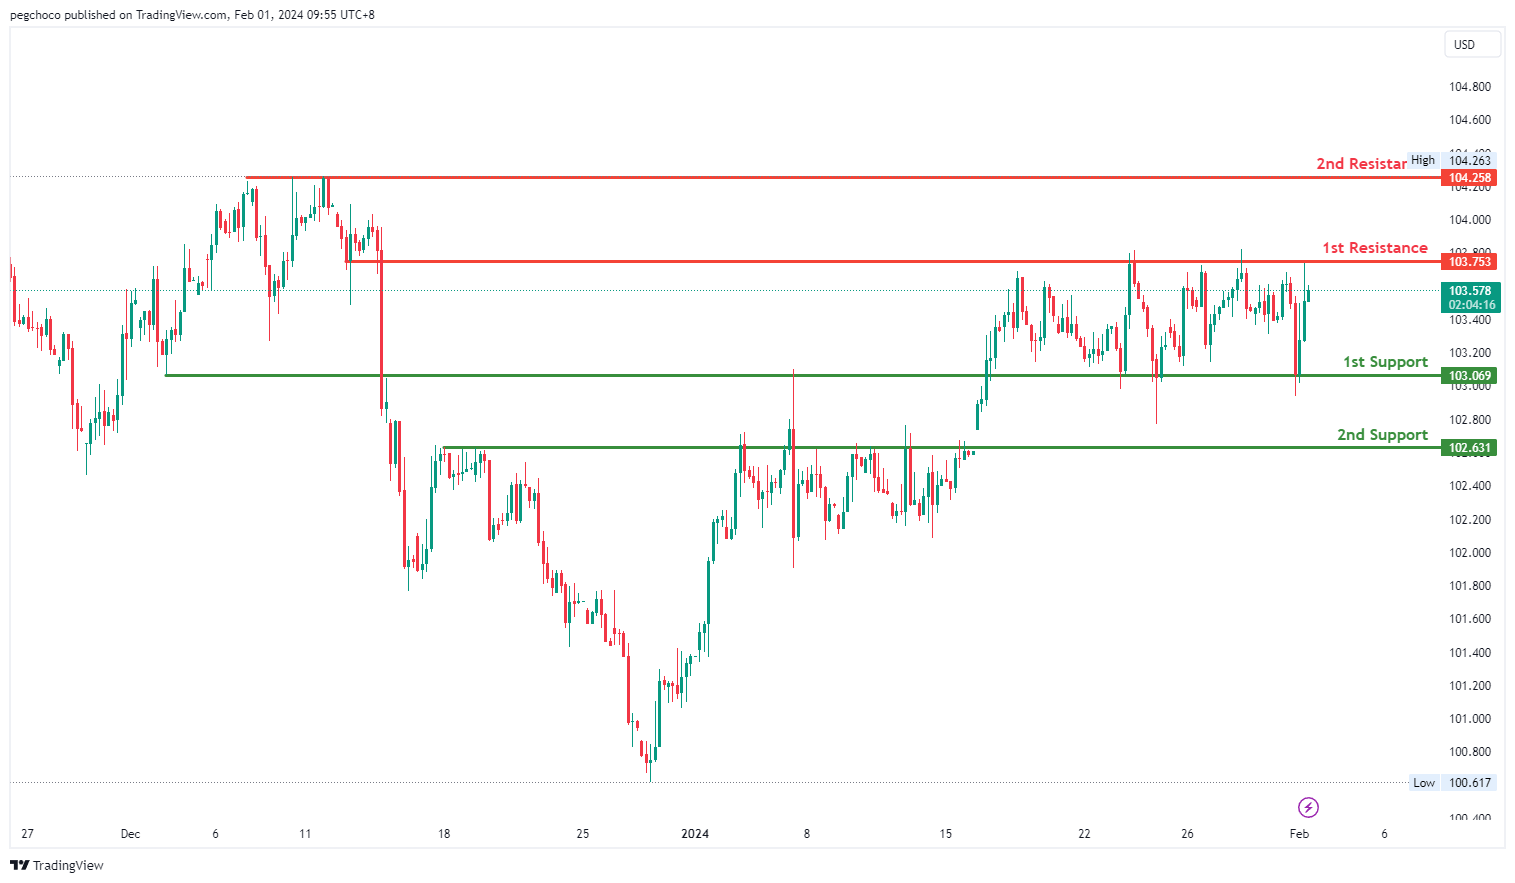
The DXY chart currently exhibits a neutral overall momentum, indicating a lack of a clear trend direction. The price could potentially fluctuate between the 1st resistance and 1st support levels.
The 1st support level at 103.06 is identified as an overlap support, suggesting that it has historical significance and could act as a support level where buying interest may emerge.
Additionally, there is a 2nd support level at 102.63, categorized as a pullback support, further emphasizing its potential importance as a support zone.
On the resistance side, the 1st resistance level at 103.75 is categorized as an overlap resistance, indicating a historical point where the price has encountered resistance.
The 2nd resistance level at 104.25 is identified as a multi-swing high resistance, suggesting that it represents another historical level where the price has faced resistance.
EUR/USD:
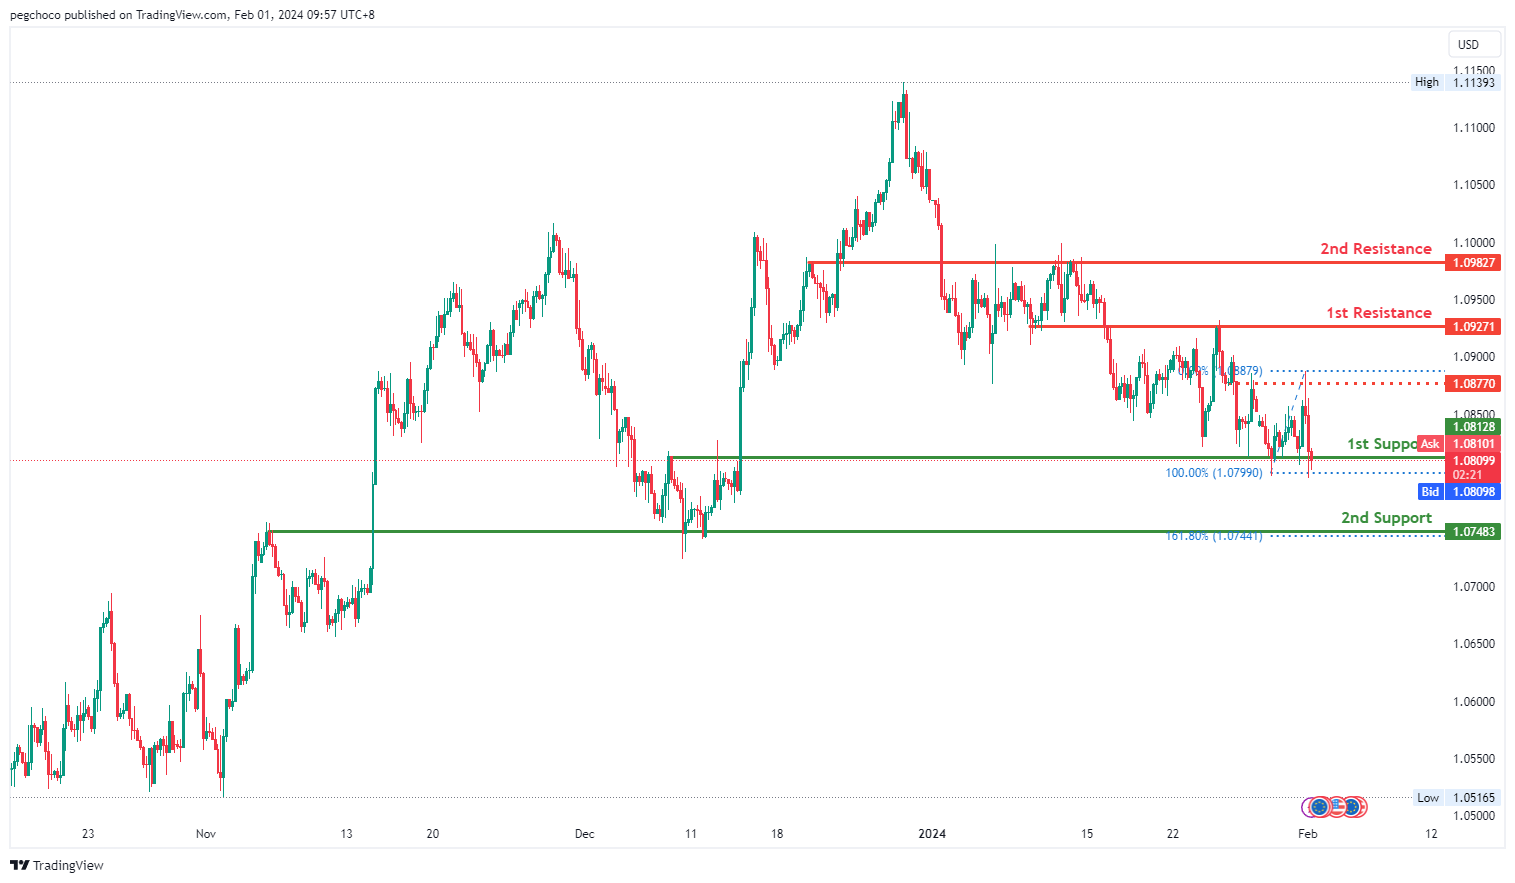
The EUR/USD chart currently exhibits a bearish overall momentum, indicating a downward trend. The price could potentially make a bearish break off the 1st support level and drop towards the 2nd support level.
The 1st support level at 1.0812 is identified as an overlap support, suggesting that it has historical significance and could potentially act as a strong support level where buying interest may emerge.
There is also a 2nd support level at 1.0748, which is categorized as an overlap support and is reinforced by the presence of the 161.80% Fibonacci Extension. This further emphasizes its importance as a potential support zone.
On the resistance side, the 1st resistance level at 1.0927 is categorized as an overlap resistance, indicating that it represents a historical point where the price has encountered resistance.
The 2nd resistance level at 1.0982 is also identified as an overlap resistance, suggesting that it is another historical level where the price has faced resistance.
Additionally, there is an intermediate resistance level at 1.0877, which is also an overlap resistance.
EUR/JPY:
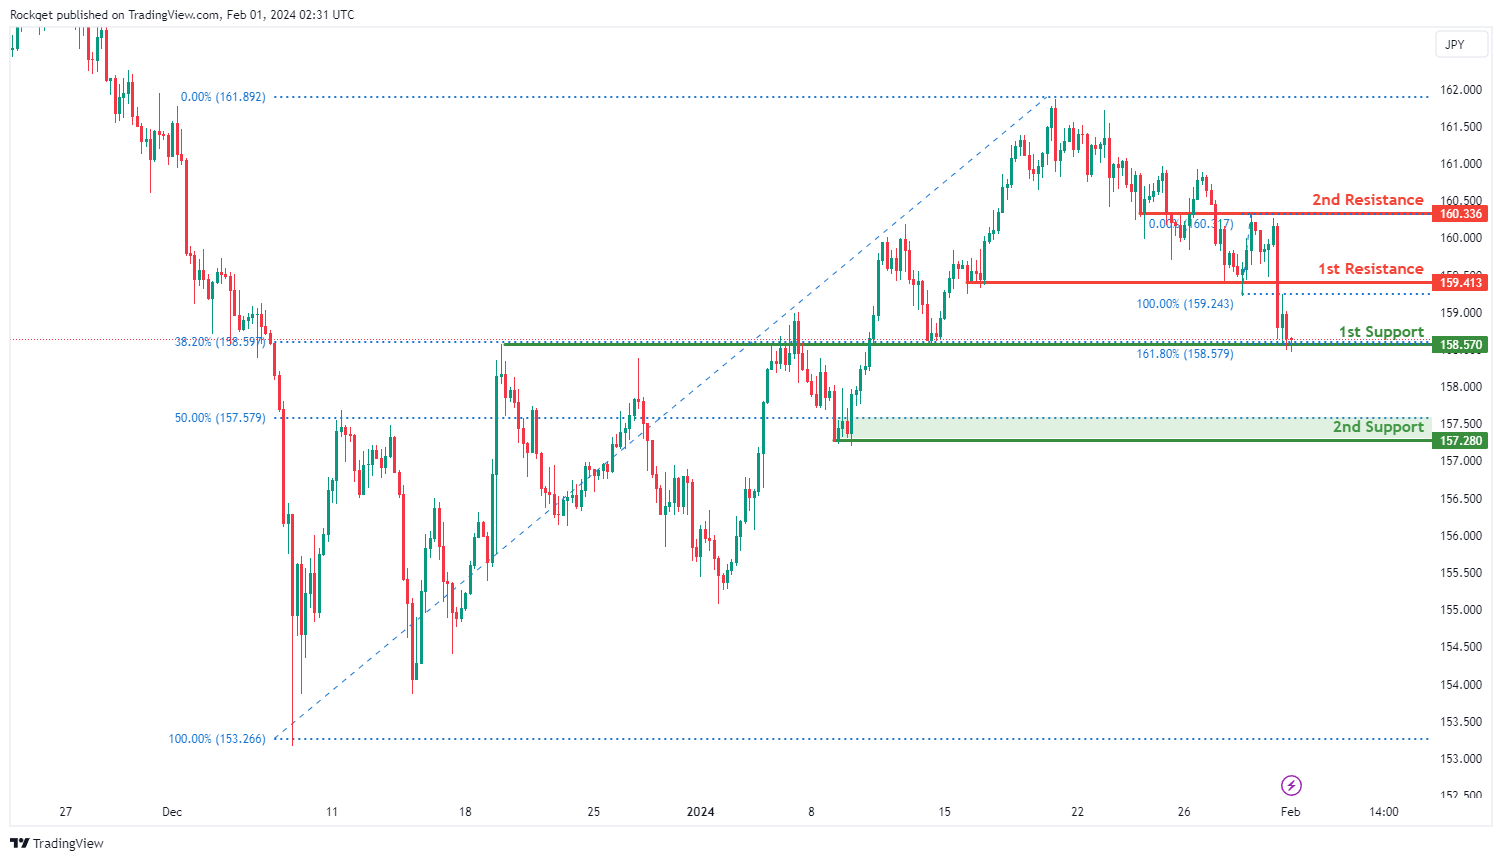
The EUR/JPY chart currently exhibits a bullish overall momentum, suggesting an upward trend. Despite this bullish sentiment, there is a potential short-term scenario indicating a drop to the 1st support before a subsequent bounce, leading to a rise towards the 1st resistance.
The 1st support at 158.570 is considered favorable for several reasons. Firstly, it is identified as an overlap support, indicating a historical level where buying interest has previously emerged. Additionally, this support level aligns with the 161.80% Fibonacci Extension and the 38.20% Fibonacci Retracement, adding confluence to its significance.
The 2nd support at 157.280 is recognized as a swing low support and coincides with the 50% Fibonacci Retracement, providing additional strength to the potential support zone.
On the resistance side, the 1st resistance at 159.413 is noteworthy for being a pullback resistance, indicating a level where selling interest might emerge.
Furthermore, the 2nd resistance at 160.336 is identified as an overlap resistance, adding significance to this potential resistance level.
EUR/GBP:
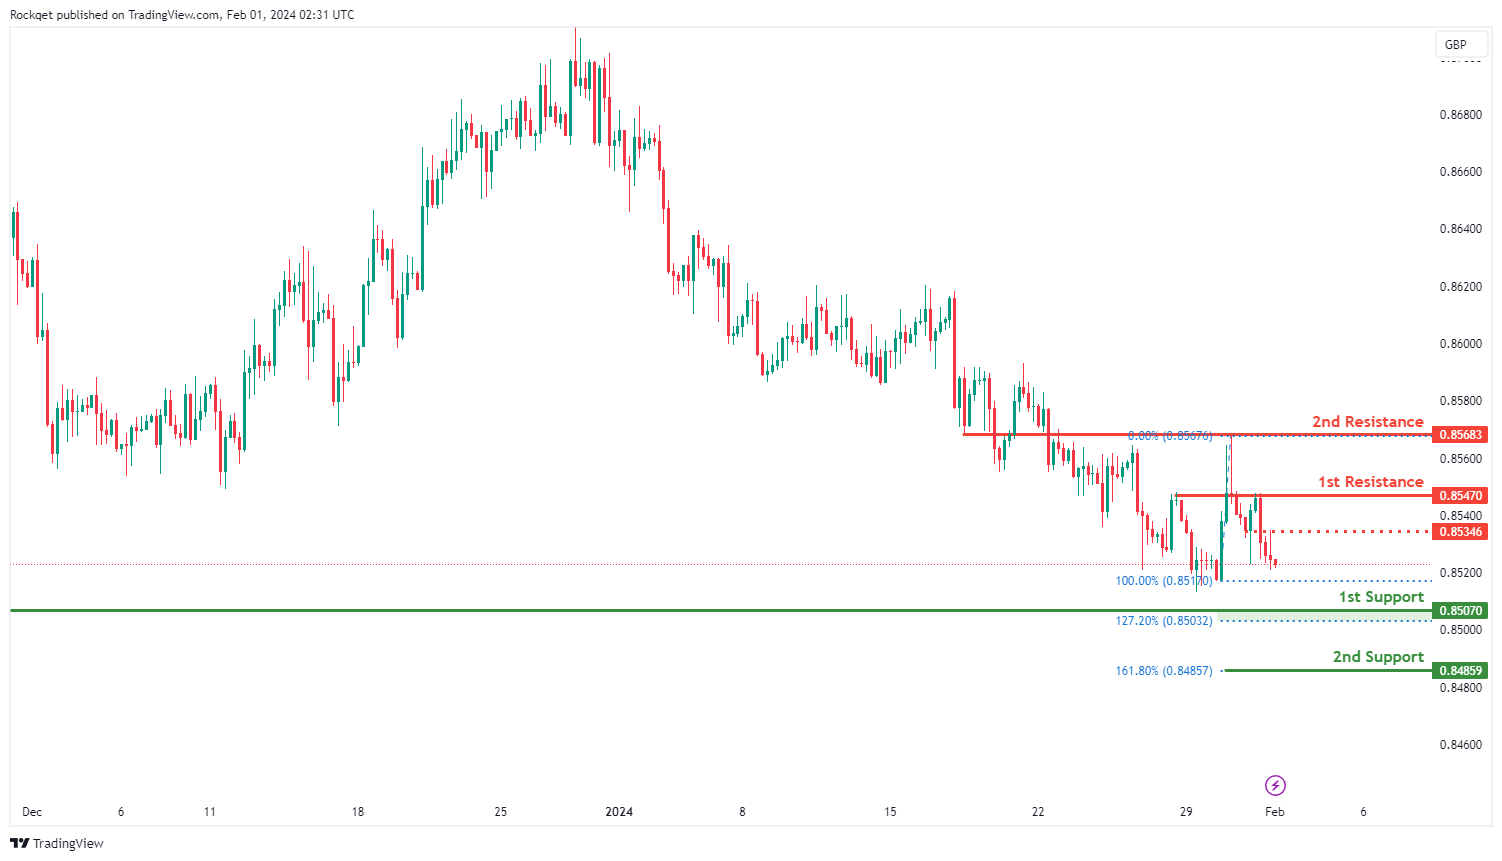
The EUR/GBP chart currently exhibits a bearish overall momentum, indicating a prevailing downward trend.
The 1st support at 0.85070 is considered favorable for several reasons. Firstly, it is identified as a swing low support, denoting a historical level where buying interest has previously emerged. Additionally, this support level aligns with the 127.20% Fibonacci Extension, providing additional strength to the potential support zone.
The 2nd support at 0.84859 is also notable, representing the 161.80% Fibonacci Extension, adding further confluence to the support area.
On the resistance side, the 1st resistance at 0.85470 is significant as it is identified as a pullback resistance, suggesting a level where selling interest may emerge.
Furthermore, the 2nd resistance at 0.85683 is recognized as an overlap resistance, contributing to the overall resistance zone. The intermediate resistance at 0.85346 is also considered noteworthy, being an overlap resistance.
GBP/USD:
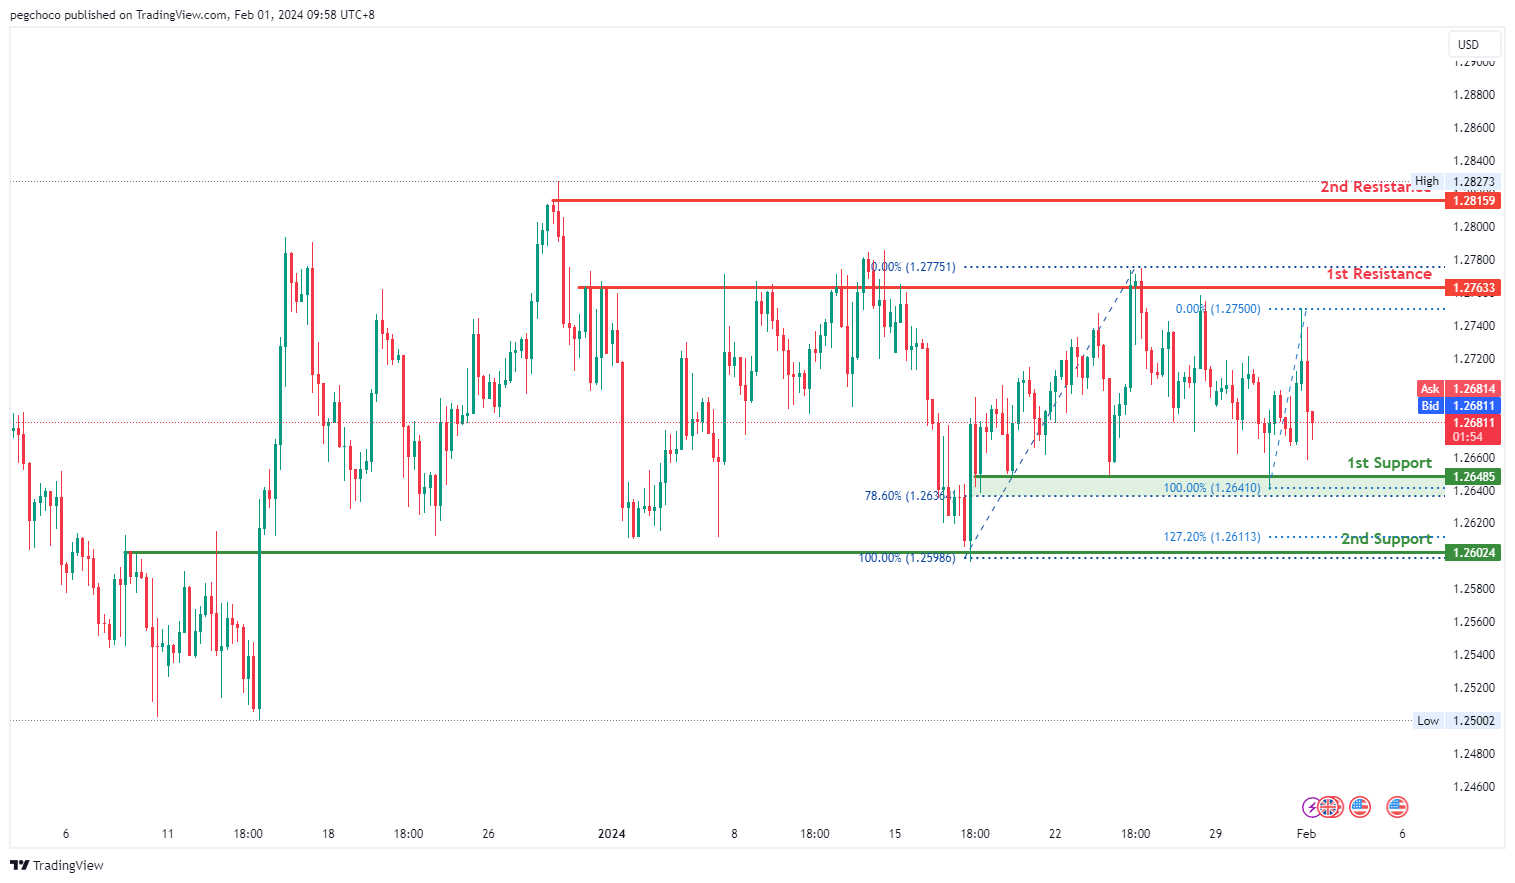
The GBP/USD chart currently exhibits a neutral overall momentum, suggesting a lack of a clear trend direction. Price could potentially fluctuate between the 1st resistance and 1st support levels.
The 1st support level at 1.2648 is identified as a multi-swing low support, and it is reinforced by the presence of the 78.60% Fibonacci Retracement. This suggests that it has historical significance and could potentially act as a strong support level where buying interest may emerge.
There is also a 2nd support level at 1.2601, categorized as an overlap support and associated with the 127.20% Fibonacci Extension, further emphasizing its importance as a potential support zone.
On the resistance side, the 1st resistance level at 1.2763 is identified as a multi-swing high resistance, indicating that it represents a historical point where the price has encountered resistance.
The 2nd resistance level at 1.2815 is categorized as a swing high resistance, suggesting that it is another historical level where the price has faced resistance.
GBP/JPY:
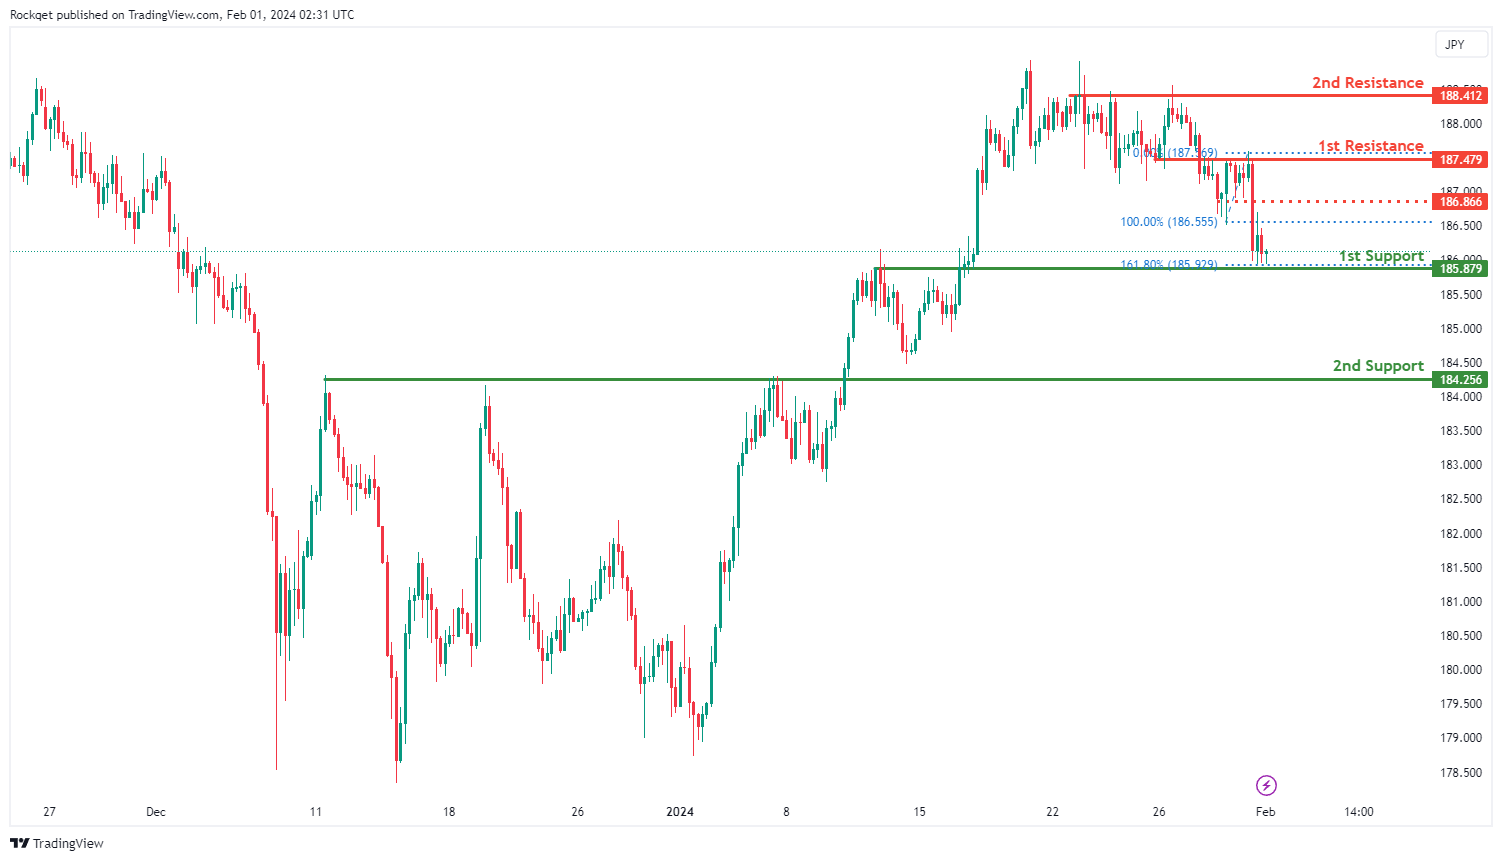
The GBP/JPY chart currently indicates a bullish overall momentum, suggesting a potential short-term drop to the 1st support level before bouncing back and rising towards the 1st resistance.
The 1st support at 185.879 is considered significant for several reasons. Firstly, it is identified as an overlap support, indicating a historical level where buying interest has previously emerged. Additionally, this support level aligns with the 161.80% Fibonacci Extension, adding confluence to its significance.
The 2nd support at 184.256 is recognized as a pullback support, providing additional strength to the potential support zone.
On the resistance side, the 1st resistance at 187.479 is considered notable as it is identified as an overlap resistance, suggesting a level where selling interest may emerge.
Furthermore, the 2nd resistance at 188.412 is recognized as a pullback resistance, contributing to the overall resistance zone. The intermediate resistance at 186.87 is also considered noteworthy, being a pullback resistance.
USD/CHF:
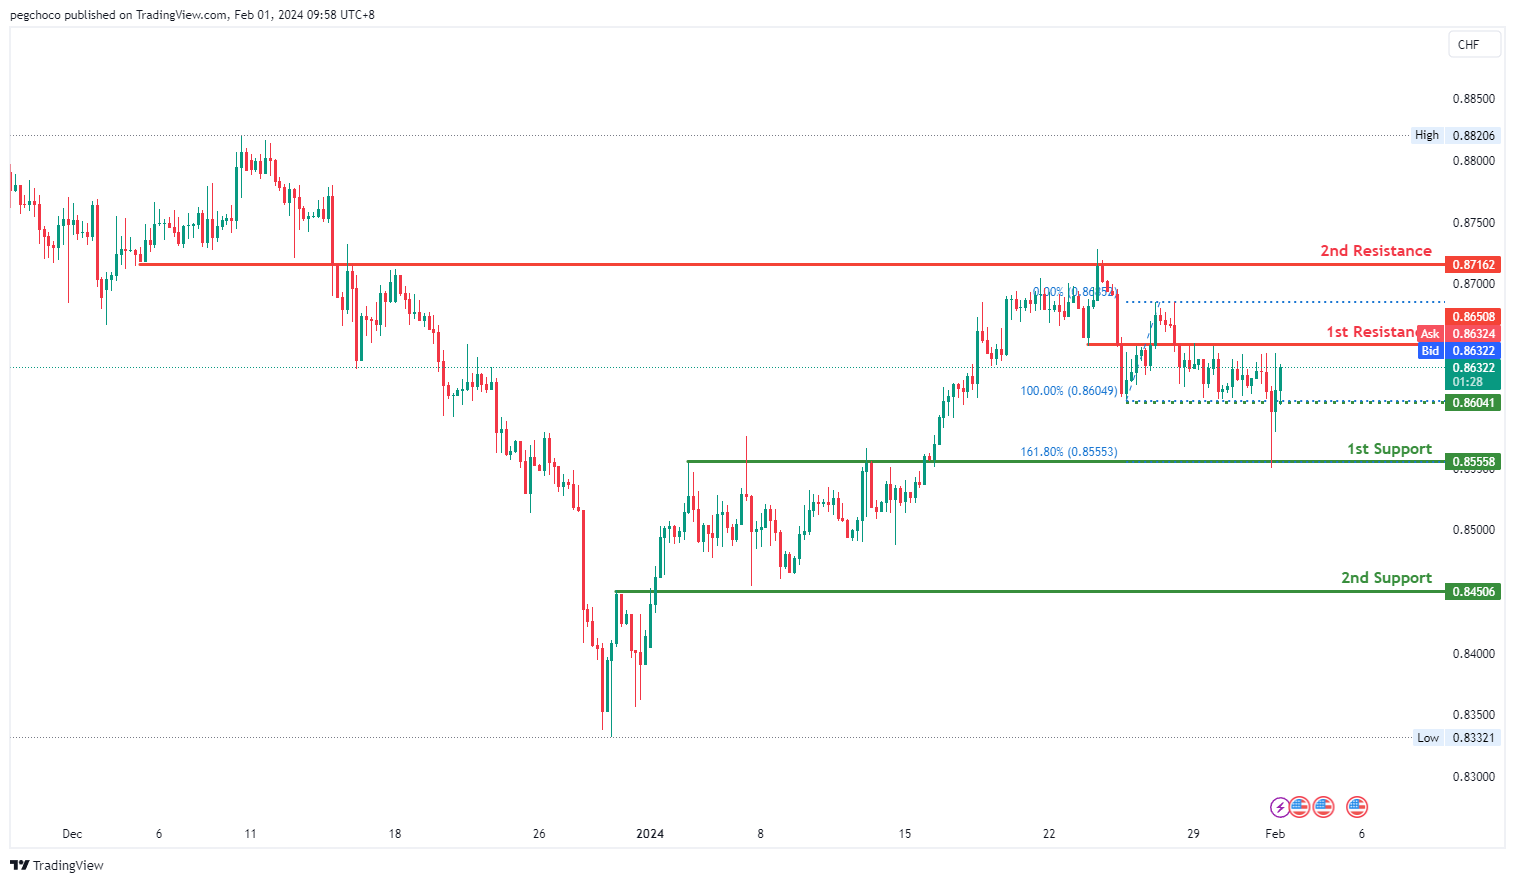
The USD/CHF chart currently exhibits a bearish overall momentum, indicating a downward trend. Price could potentially experience a bearish reaction off the 1st resistance level and drop towards the 1st support level.
The 1st support level at 0.8555 is identified as an overlap support, and it is reinforced by the presence of the 161.80% Fibonacci Extension. This suggests that it has historical significance and could potentially act as a strong support level where buying interest may emerge.
There is also a 2nd support level at 0.8450, categorized as a pullback support, further emphasizing its importance as a potential support zone.
On the resistance side, the 1st resistance level at 0.8650 is identified as an overlap resistance, indicating that it represents a historical point where the price has encountered resistance.
The 2nd resistance level at 0.8716 is also categorized as an overlap resistance, suggesting that it is another historical level where the price has faced resistance.
Additionally, there is an intermediate support level at 0.8604, categorized as a pullback support, which could also play a role in providing support if the price drops.
USD/JPY:
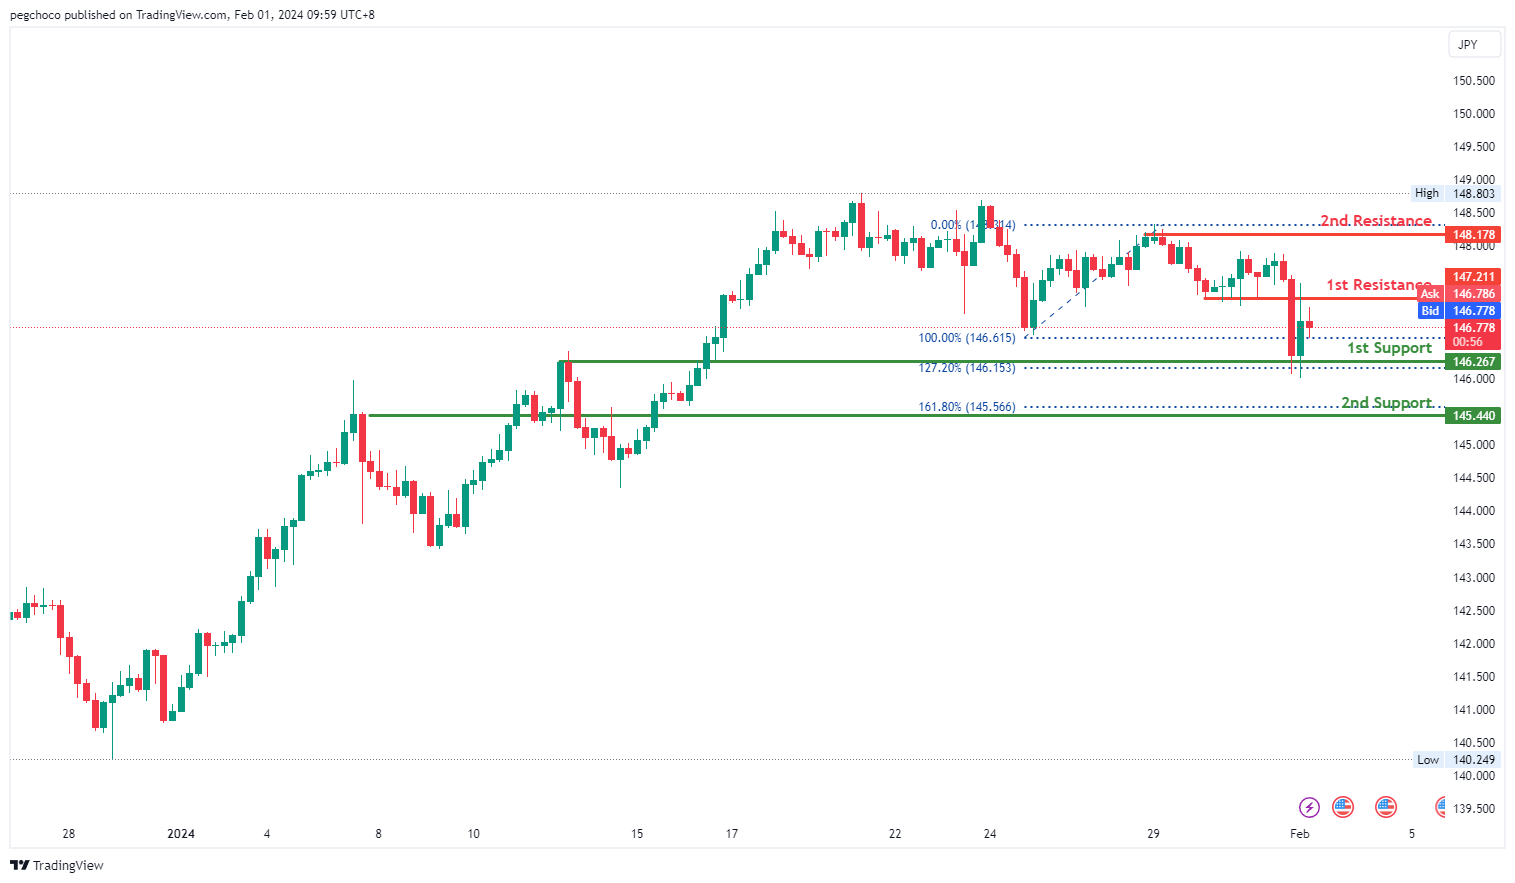
The USD/JPY chart currently exhibits a bearish overall momentum, indicating a downward trend. Price could potentially experience a bearish reaction off the 1st resistance level and drop to the 1st support level.
The 1st support level at 146.26 is identified as an overlap support, and it is reinforced by the presence of the 127.20% Fibonacci Extension. This suggests that it has historical significance and could potentially act as a strong support level where buying interest may emerge.
There is also a 2nd support level at 145.44, categorized as a pullback support, further emphasizing its importance as a potential support zone.
On the resistance side, the 1st resistance level at 147.21 is identified as an overlap resistance, indicating that it represents a historical point where the price has encountered resistance.
The 2nd resistance level at 148.17 is categorized as a multi-swing high resistance, suggesting that it is another historical level where the price has faced resistance.
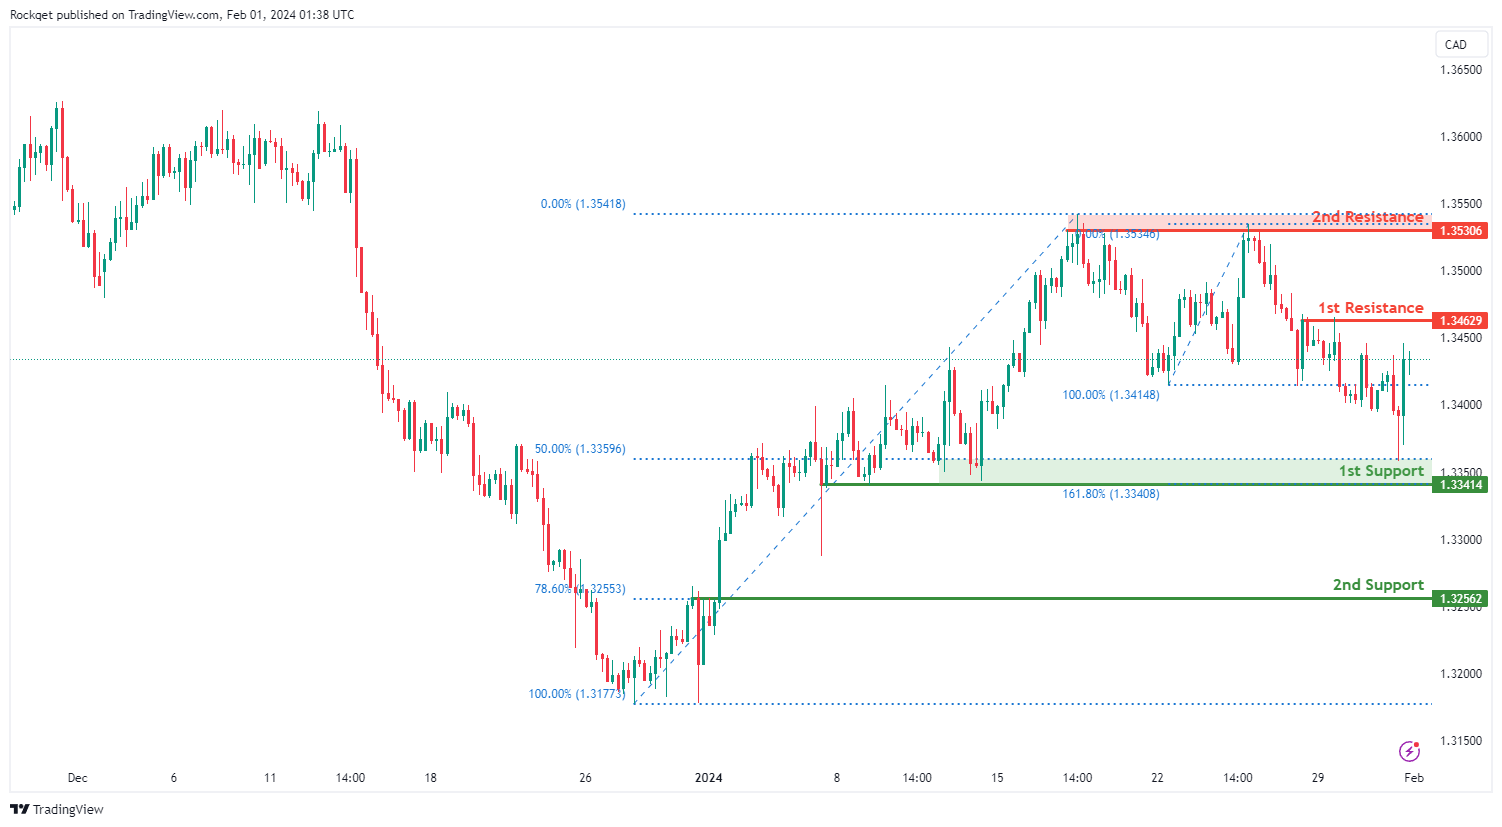
USD/CAD:
The USD/CAD chart currently exhibits an overall bearish momentum. In this context, there is a potential scenario for price to make a bearish continuation towards the 1st support level.
The 1st support level at 1.3341 is identified as a pullback support that aligns close to the 50.00% Fibonacci Retracement level. Further below, the 2nd support level at 1.3256 is also marked as a pullback support that aligns with the 78.60% Fibonacci Retracement level, further emphasizing its importance as a potential support zone.
On the resistance side, the 1st resistance level at 1.3462 is identified as a pullback resistance. Higher up, the 2nd resistance level at 1.3530 is noted as a multi-swing-high resistance, further highlighting its importance as a potential resistance point.
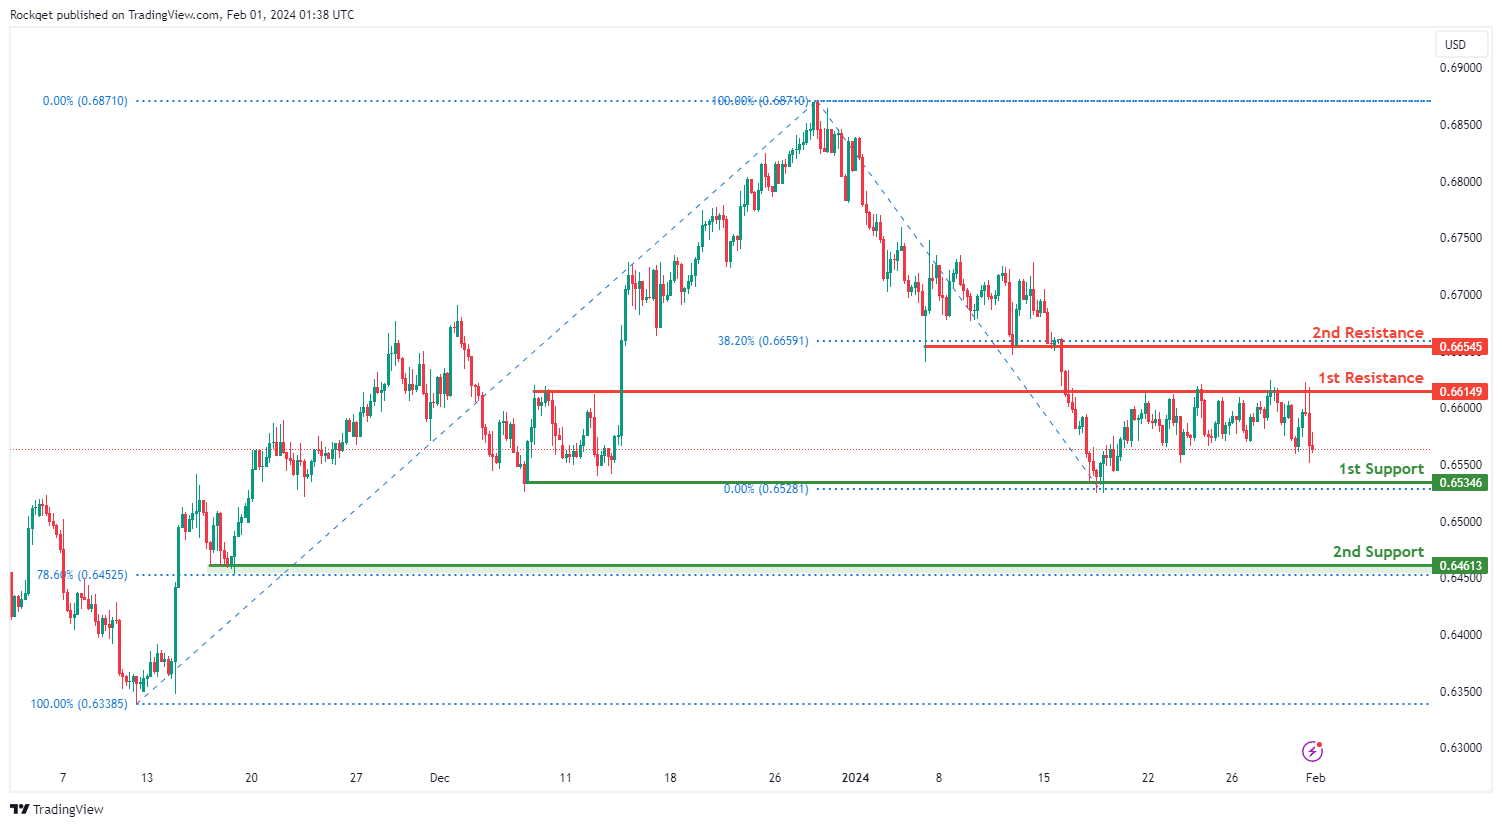
AUD/USD:
The AUD/USD chart currently exhibits a neutral bias. In this context, there is a potential scenario for price to fluctuate between the 1st resistance and 1st support.
The 1st resistance level at 0.6614 is identified as a pullback resistance. Higher up, the 2nd resistance level at 0.6654 is also marked as a pullback resistance that aligns with the 38.20% Fibonacci Retracement level, further highlighting its importance as a potential resistance point.
On the support side, the 1st support level at 0.6534 is identified as a pullback support. Further below, the 2nd support level at 0.6461 is also noted as a pullback support that aligns close to the 78.60% Fibonacci Retracement level, further emphasizing its importance as a potential support zone.
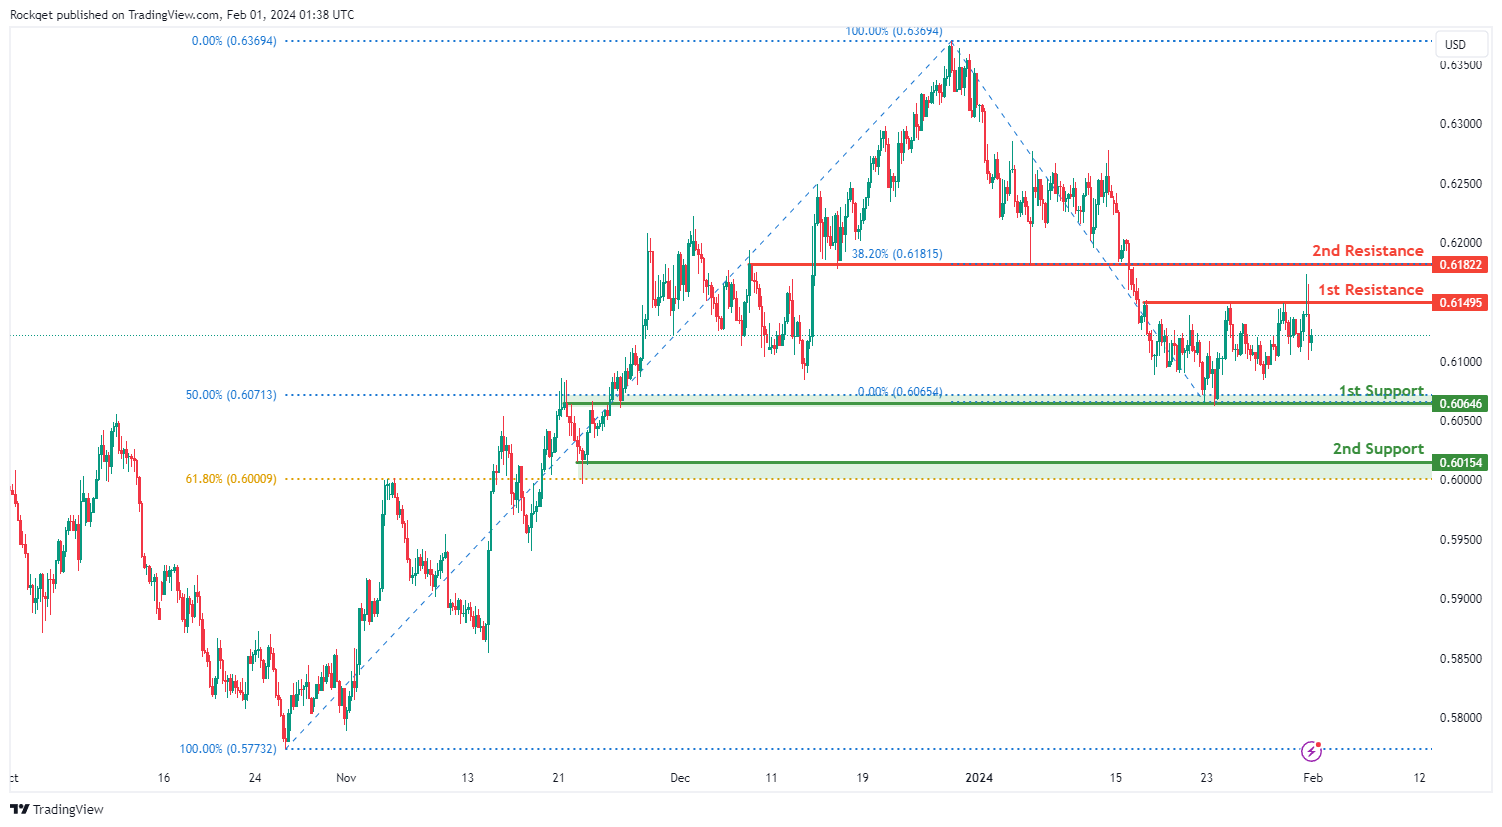
NZD/USD
The NZD/USD chart currently exhibits a neutral bias. In this context, there is a potential scenario for price to fluctuate between the 1st resistance and 1st support.
The 1st resistance level at 0.6149 is identified as a pullback resistance. Higher up, the 2nd resistance level at 0.6182 is marked as an overlap resistance that aligns with the 38.20% Fibonacci Retracement level, further highlighting its importance as a potential resistance point.
On the support side, the 1st support level at 0.6064 is identified as an overlap support that aligns with the 50.00% Fibonacci Retracement level. Further below, the 2nd support level at 0.6015 is noted as a pullback support that aligns close to the 61.80% Fibonacci Retracement level, further emphasizing its importance as a potential support zone.
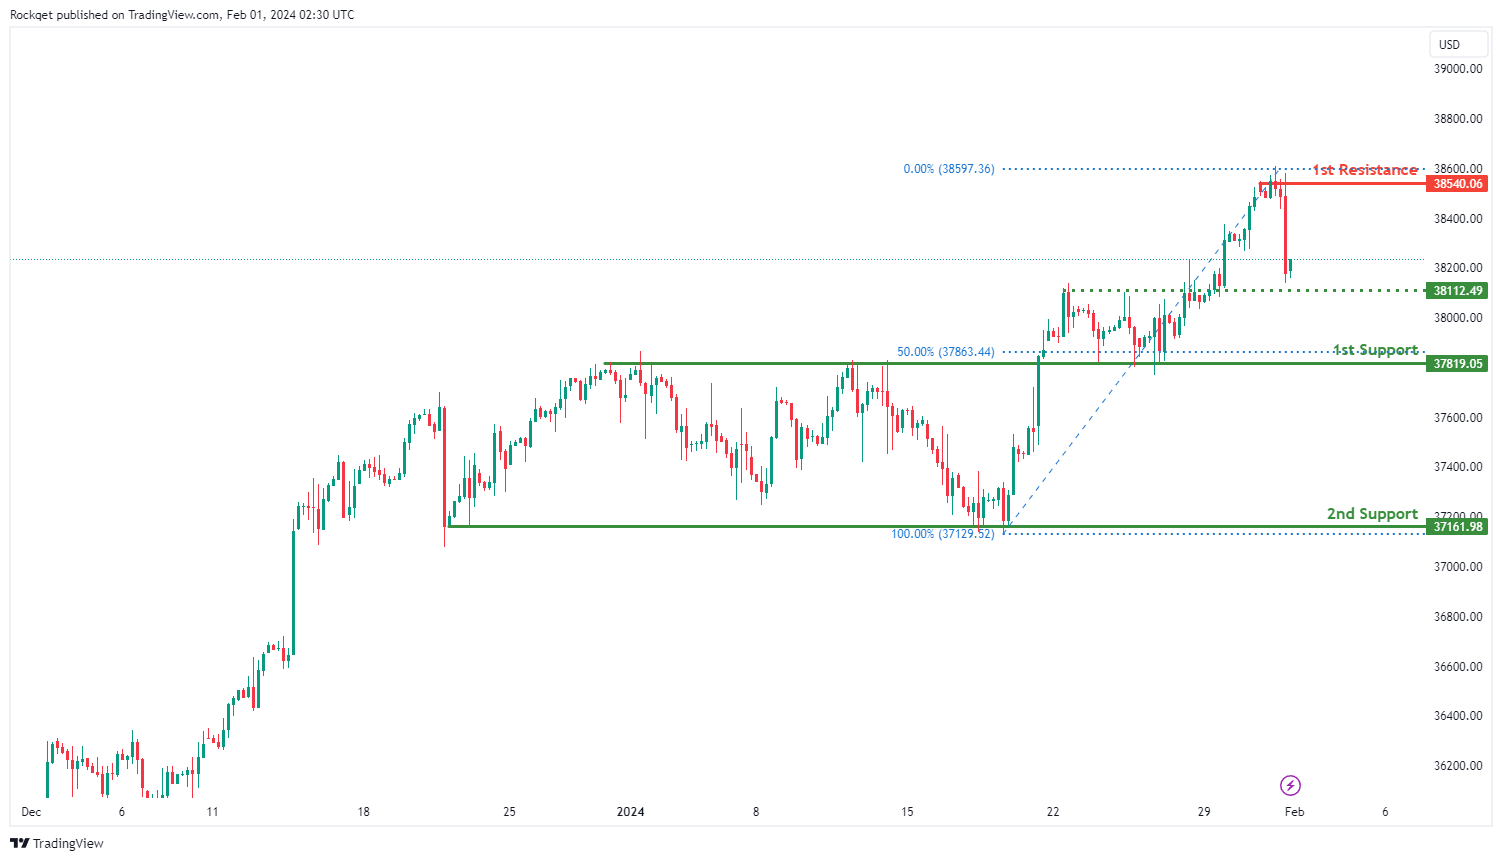
DJ30:
The DJ30 (Dow Jones Industrial Average) chart currently exhibits a bearish overall momentum, indicating a potential continuation of the downward trend. Several factors contribute to this bearish momentum, suggesting the possibility of further price decline.
The 1st support at 37819.05 is considered significant for multiple reasons. Firstly, it is identified as an overlap support, indicating a historical level where buying interest has previously emerged. Additionally, this support level aligns with the 50% Fibonacci Retracement, adding confluence to its significance.
The 2nd support at 37161.98 is recognized as a pullback support, providing additional strength to the potential support zone.
On the resistance side, the 1st resistance at 38540.06 is considered notable as it is identified as a swing high resistance. This level may act as a barrier to the bearish momentum. The intermediate support at 38112.49 is also recognized as an overlap support, adding further relevance to the support zone.
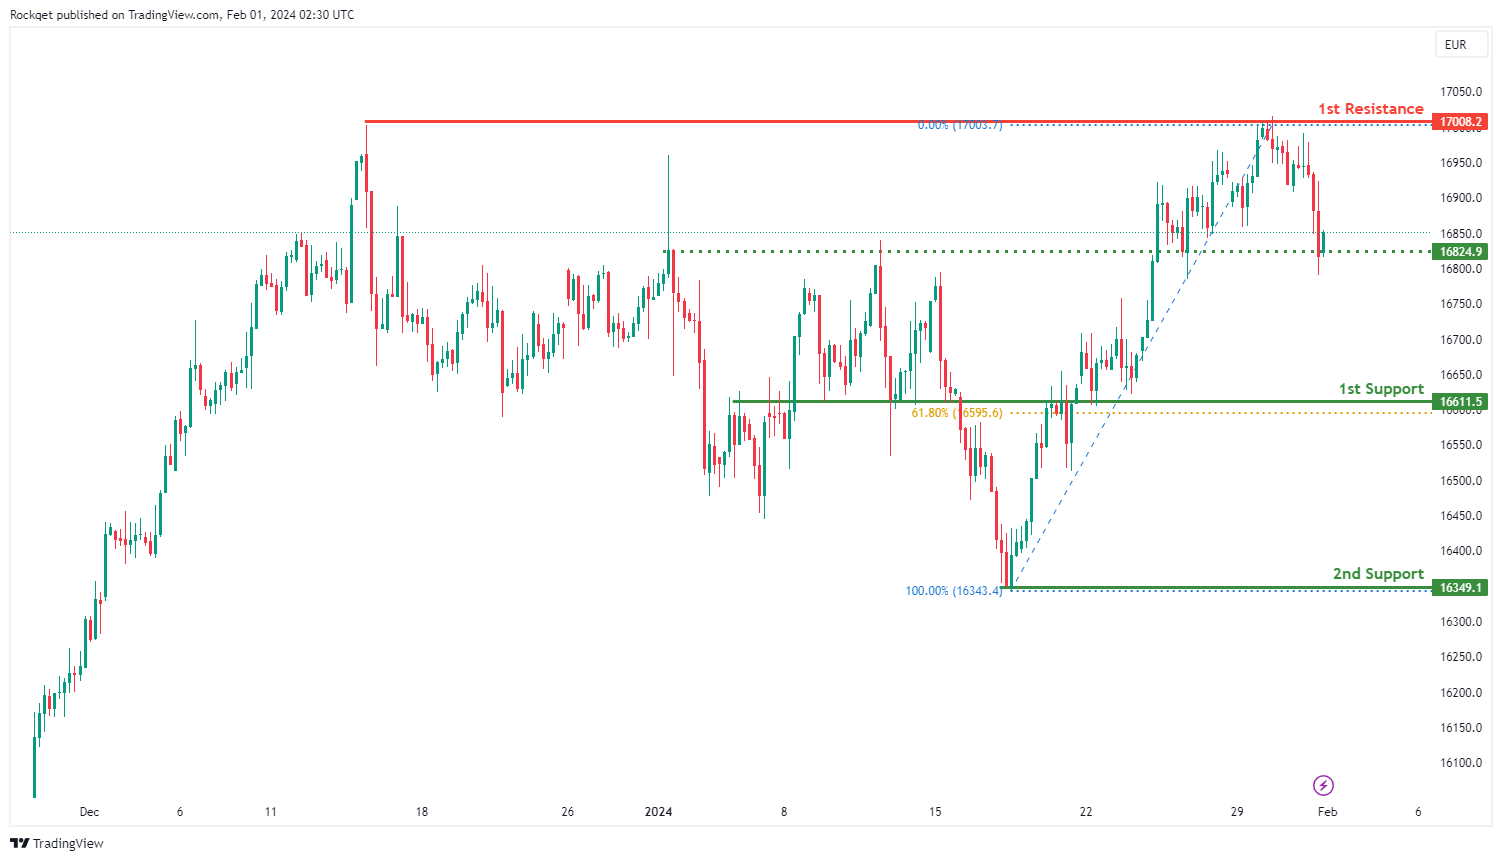
GER40:
The GER40 chart currently maintains a bearish overall momentum, with several factors contributing to the downward trend. The price is displaying indications that support a potential bearish continuation.
The 1st support at 16611.5 holds significance for various reasons. Firstly, it is identified as an overlap support, denoting a historical level where buying interest has previously been observed. Additionally, this support level aligns with the 61.80% Fibonacci Retracement, adding to its significance.
The 2nd support at 16349.1 is recognized as a swing low support, further strengthening the potential support zone.
On the resistance side, the 1st resistance at 17008.2 is considered noteworthy as it is identified as a multi-swing high resistance. This level may act as a barrier to the bearish momentum. The intermediate support at 16824.9 is also recognized as an overlap support, providing additional relevance to the potential support zone.
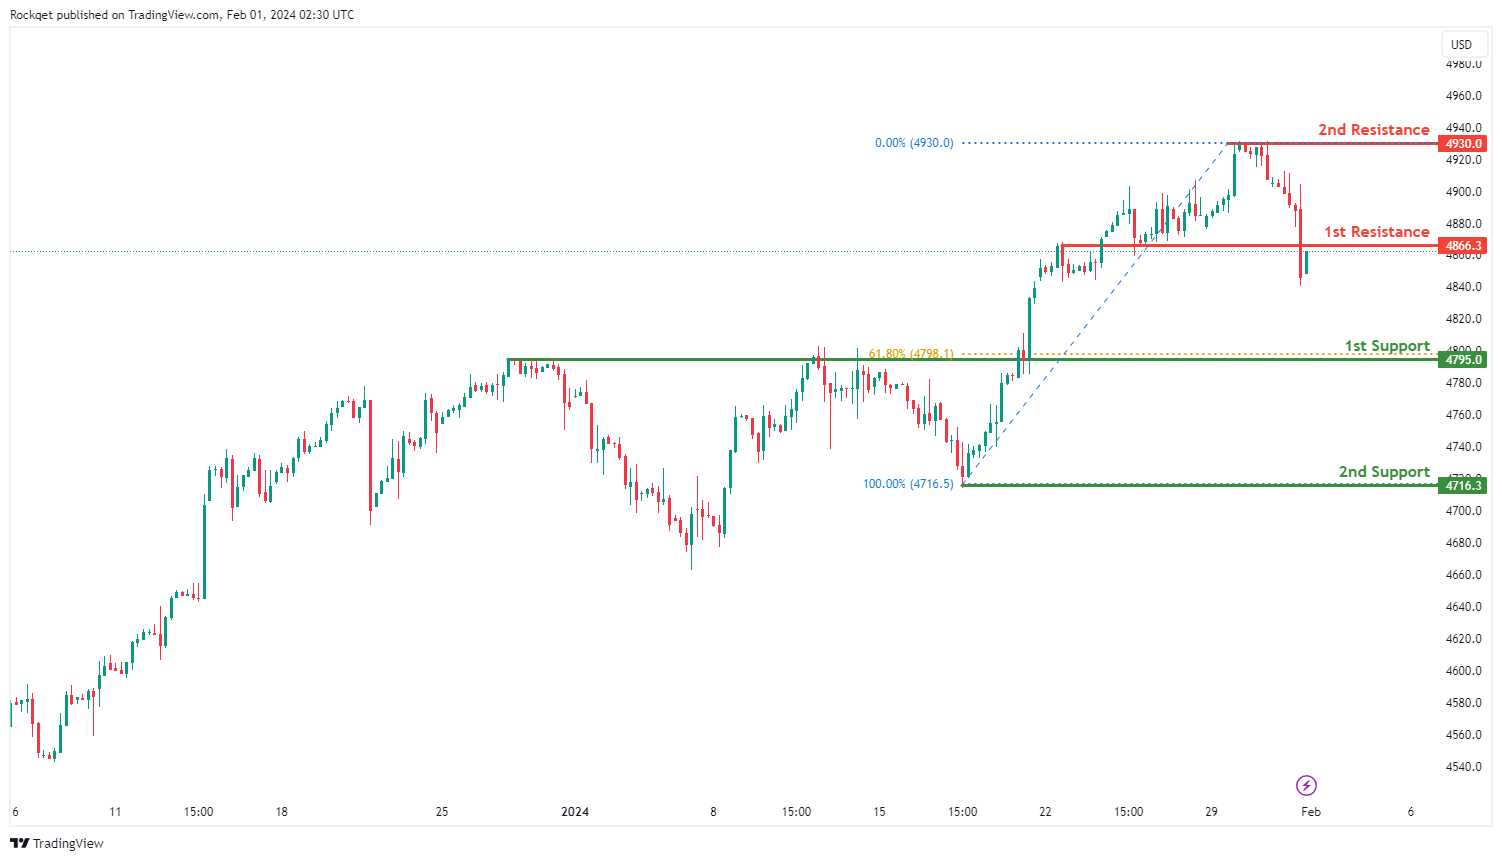
US500:
The US500 chart currently indicates a bearish overall momentum, suggesting a potential continuation of the downward trend. Several factors contribute to this bearish sentiment, signalling the possibility of further price depreciation.
The 1st support at 4795.0 is considered significant for multiple reasons. Firstly, it is identified as an overlap support, denoting a historical level where buying interest has previously emerged. Additionally, this support level aligns with the 61.80% Fibonacci Retracement, adding confluence to its importance.
The 2nd support at 4716.3 is recognized as a swing low support, providing additional strength to the potential support zone.
On the resistance side, the 1st resistance at 4866.3 is highlighted as an overlap resistance, which may act as a barrier to bearish momentum. The 2nd resistance at 4930.0 is identified as a swing high resistance, further reinforcing the potential resistance zone.
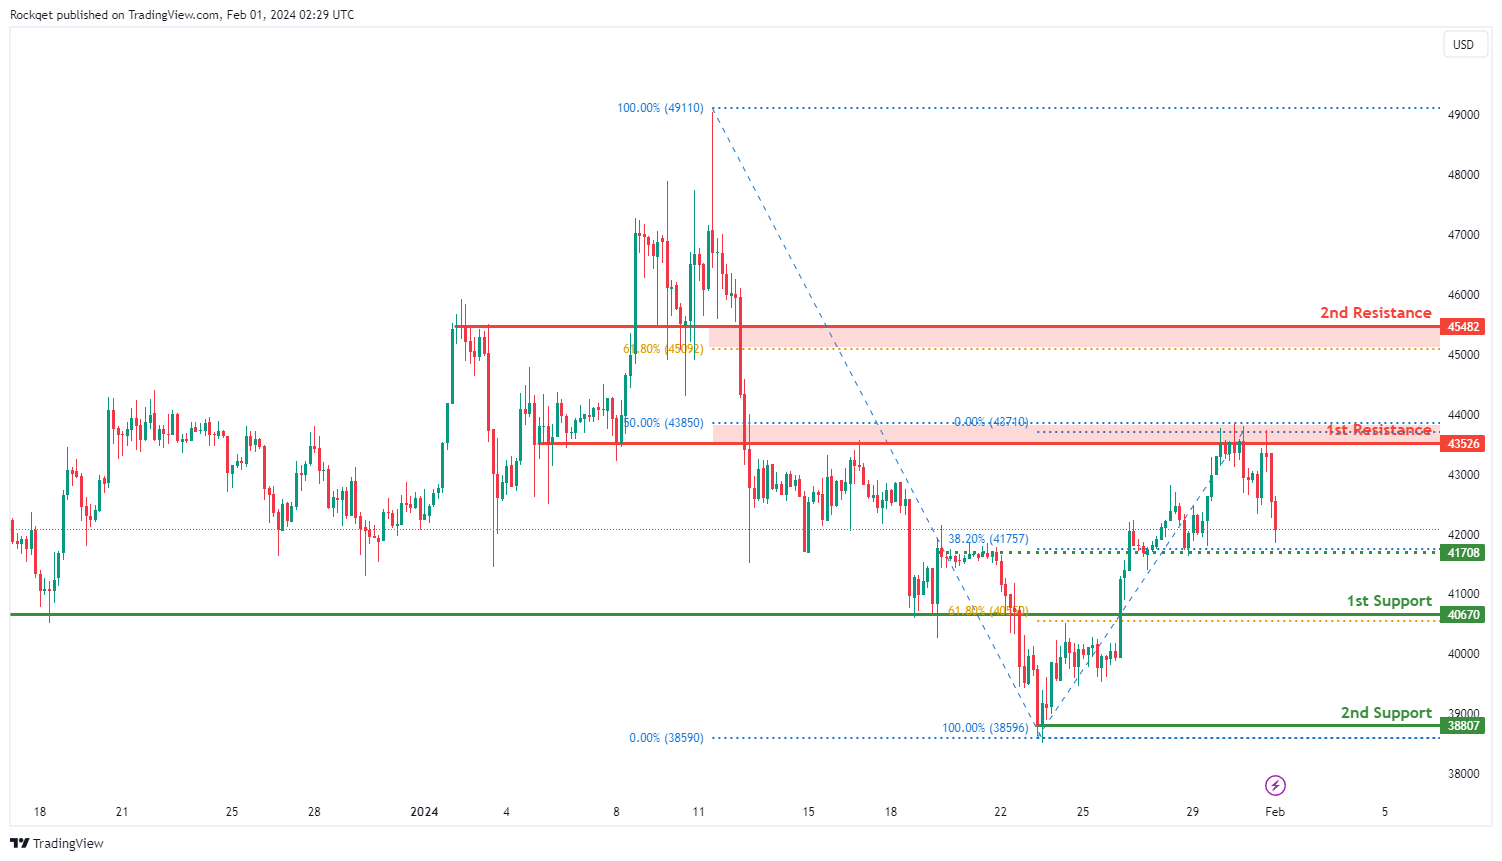
BTC/USD:
The BTC/USD chart currently displays a bearish overall momentum, indicating a potential continuation of the downward trend. Several factors contribute to this bearish sentiment, suggesting the possibility of a bearish reaction off the 1st resistance and a subsequent drop to the 1st support.
The 1st support at 40670 is deemed significant for several reasons. Firstly, it is identified as an overlap support, signifying a historical level where buying interest has previously emerged. Additionally, this support level aligns with the 61.80% Fibonacci Retracement, adding confluence to its importance.
The 2nd support at 38807 is recognized as a swing low support, providing additional strength to the potential support zone. Additionally, the intermediate support at 41708 is noted as an overlap support and aligns with the 38.20% Fibonacci Retracement.
On the resistance side, the 1st resistance at 43526 is highlighted as an overlap resistance, which may act as a barrier to the bearish momentum. The 2nd resistance at 45482 is identified as a swing high resistance, further reinforcing the potential resistance zone.
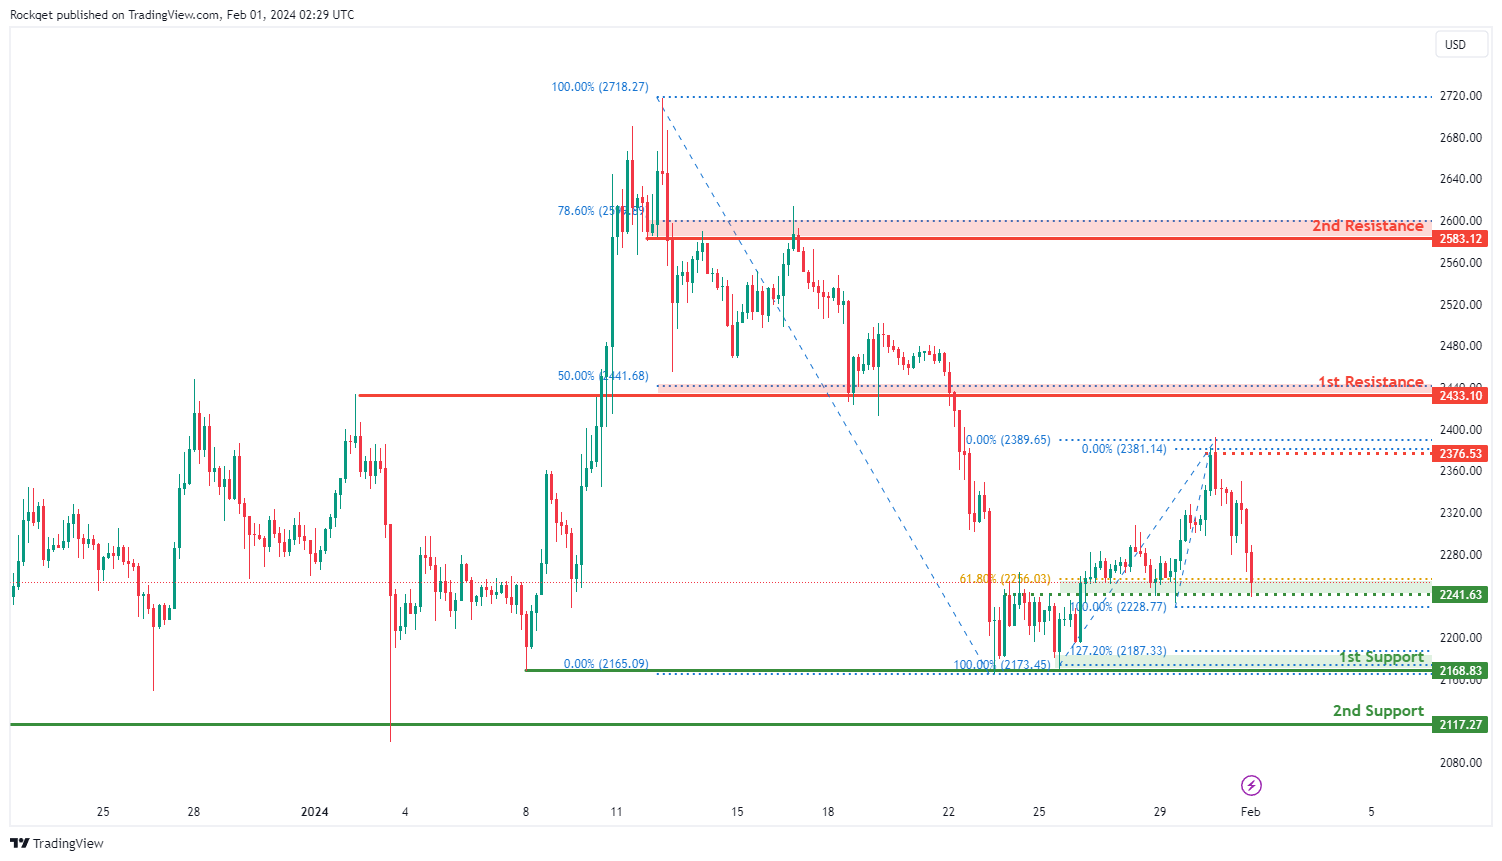
ETH/USD:
The ETH/USD chart currently exhibits a bearish overall momentum, signalling a prevailing downward trend. The analysis suggests that the price could potentially experience a bearish continuation towards the 1st support level.
The 1st support at 2168.83 holds significance for several reasons. Firstly, it is identified as an overlap support, denoting a historical level where buying interest has previously emerged. Additionally, this support level aligns with the 127.20% Fibonacci Extension, adding confluence and strength to its importance.
The 2nd support at 2117.27 is recognized as a multi-swing low support, providing additional reinforcement to the potential support zone. Furthermore, the intermediate support at 2376.53 is noted as an overlap support and aligns with the 61.80% Fibonacci Retracement.
On the resistance side, the 1st resistance at 2433.10 is highlighted as an overlap resistance, potentially acting as a barrier to the bearish momentum.
The 2nd resistance at 2583.12 is identified as an overlap resistance and coincides with the 78.60% Fibonacci Retracement, further strengthening the potential resistance zone. Additionally the immediate resistance at 2376.53 is identified as swing-high resistance further reinforcing the resistance zone.
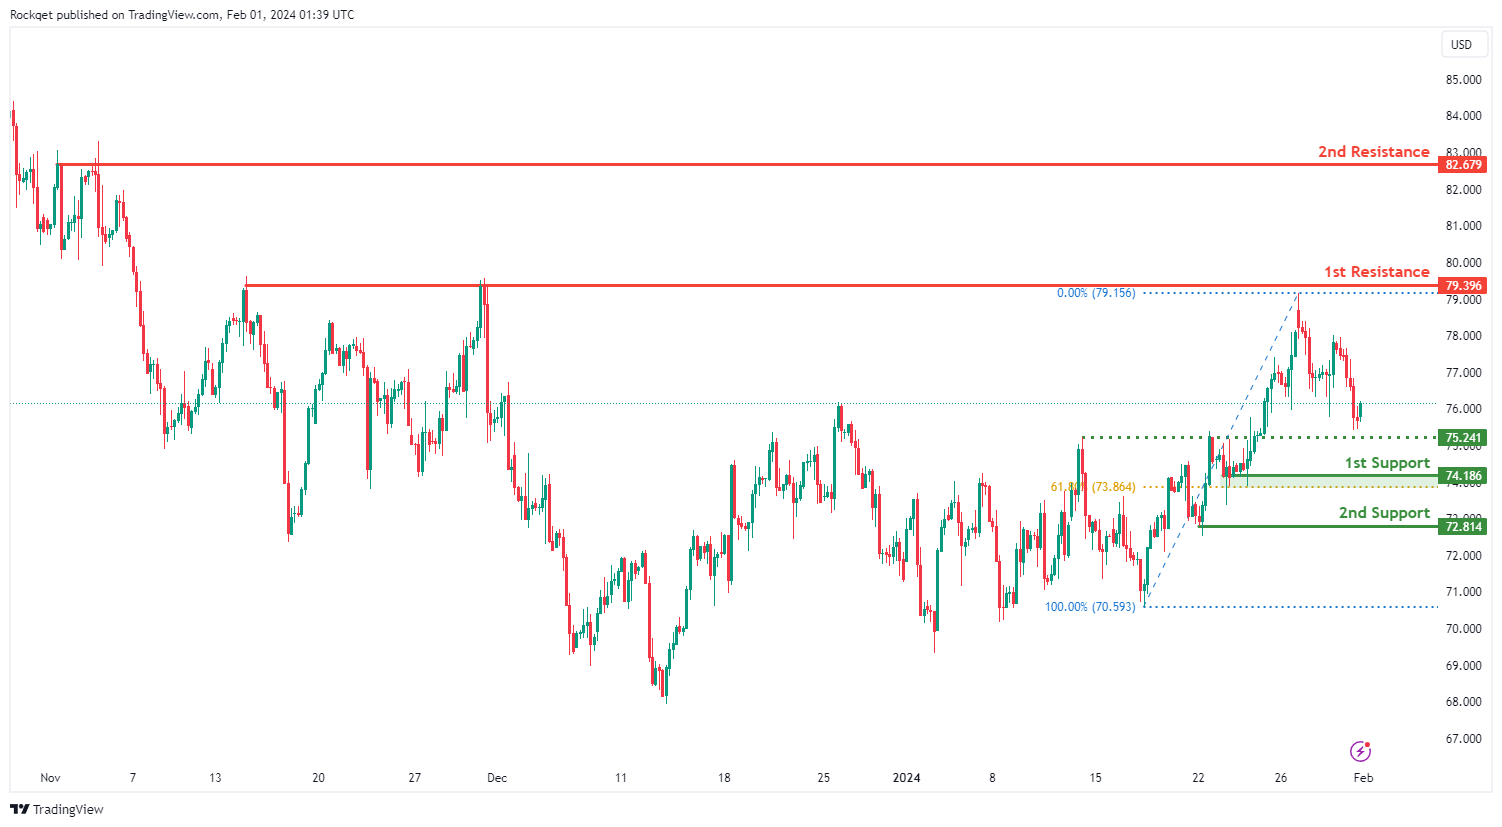
WTI/USD:
The WTI (West Texas Intermediate) chart currently exhibits a weak bullish momentum. In this context, there is a potential scenario for price to make a bullish rise towards the 1st resistance.
The 1st resistance level at 79.39 is identified as a multi-swing-high resistance. Higher up, the 2nd resistance level at 82.67 is noted as a pullback resistance, further highlighting its importance as a potential resistance point.
On the support side, the intermediate support level at 75.24 is identified as a pullback support while the 1st support level at 74.18 is also noted as a pullback support that aligns close to the 61.80% Fibonacci Retracement level. Further below, the 2nd support level at 72.81 is also marked as a pullback support, reinforcing its significance as a key support level.
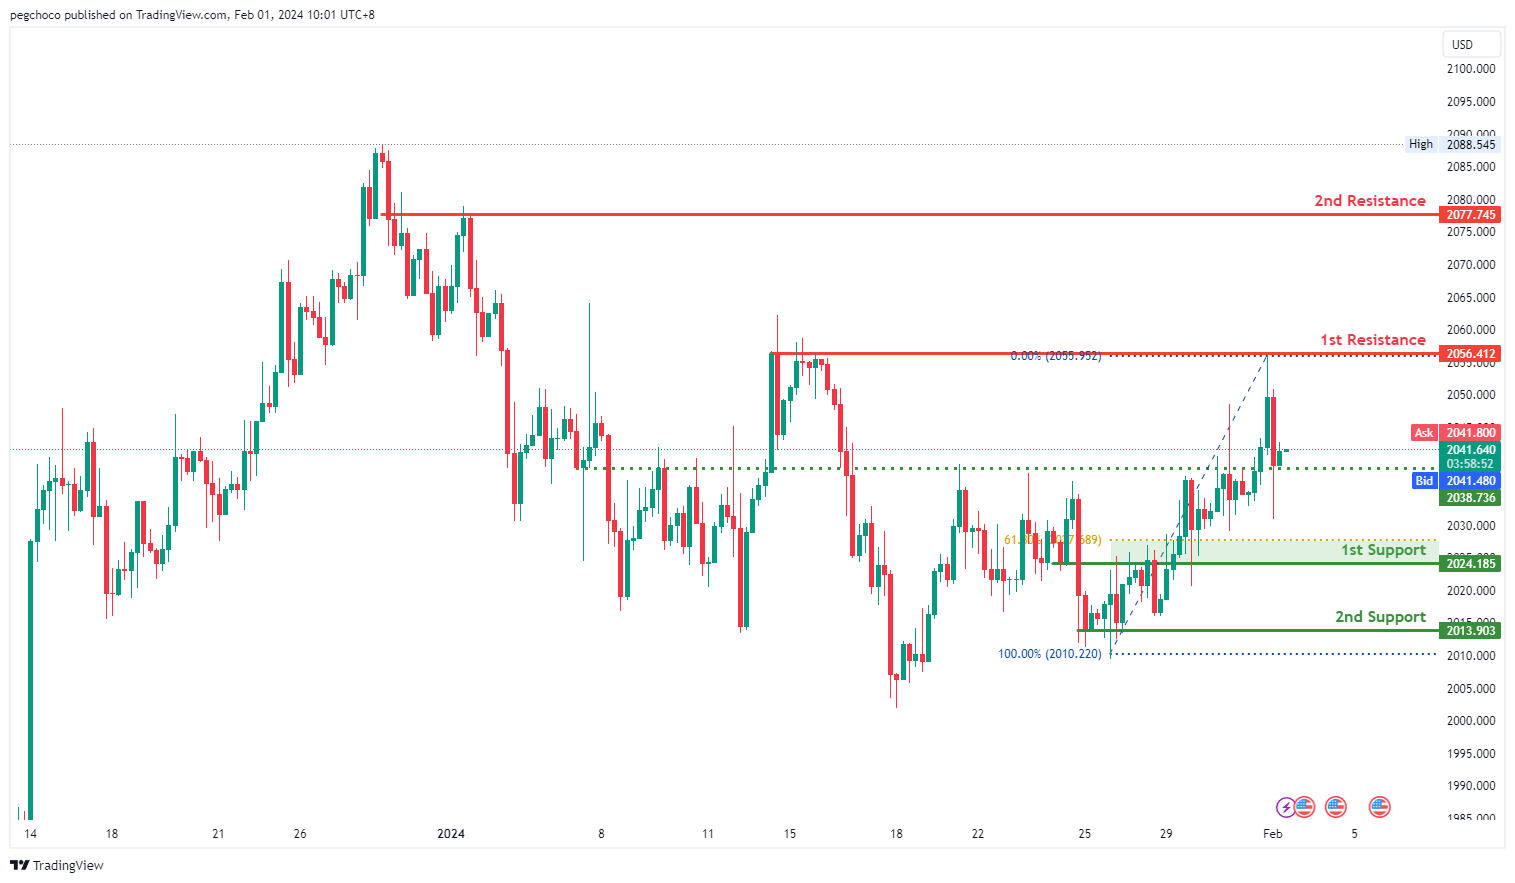
XAU/USD (GOLD):
The XAU/USD chart currently exhibits a bullish overall momentum, indicating an upward trend. Price could potentially experience a short-term drop to the 1st support level before bouncing from there and rising to the 1st resistance level.
The 1st support level at 2024.18 is identified as an overlap support, and it is reinforced by the presence of the 61.80% Fibonacci Retracement. This suggests that it has historical significance and could potentially act as a strong support level where buying interest may emerge.
There is also a 2nd support level at 2013.90, described as a multi-swing low support, further emphasizing its importance as a potential support zone.
On the resistance side, the 1st resistance level at 2056.41 is categorized as a multi-swing high resistance, indicating that it is a historical level where the price has faced resistance.
The 2nd resistance level at 2077.74 is also identified as a multi-swing high resistance, reinforcing the significance of this level as a potential barrier for price movement.
The accuracy, completeness and timeliness of the information contained on this site cannot be guaranteed. IC Markets does not warranty, guarantee or make any representations, or assume any liability regarding financial results based on the use of the information in the site.
News, views, opinions, recommendations and other information obtained from sources outside of www.icmarkets.com, used in this site are believed to be reliable, but we cannot guarantee their accuracy or completeness. All such information is subject to change at any time without notice. IC Markets assumes no responsibility for the content of any linked site.
The fact that such links may exist does not indicate approval or endorsement of any material contained on any linked site. IC Markets is not liable for any harm caused by the transmission, through accessing the services or information on this site, of a computer virus, or other computer code or programming device that might be used to access, delete, damage, disable, disrupt or otherwise impede in any manner, the operation of the site or of any user’s software, hardware, data or property.


