Updated July 2020
Support and resistance, or market structure, is considered a foundation for most trading strategies.
Several methods exist to identify support and resistance levels. One approach, however, calls for attention: the Quasimodo pattern, or QM. The QM is a straightforward configuration, offering both bullish and bearish scenarios.
As demonstrated in figure A, you will note the QM consists of five legs.
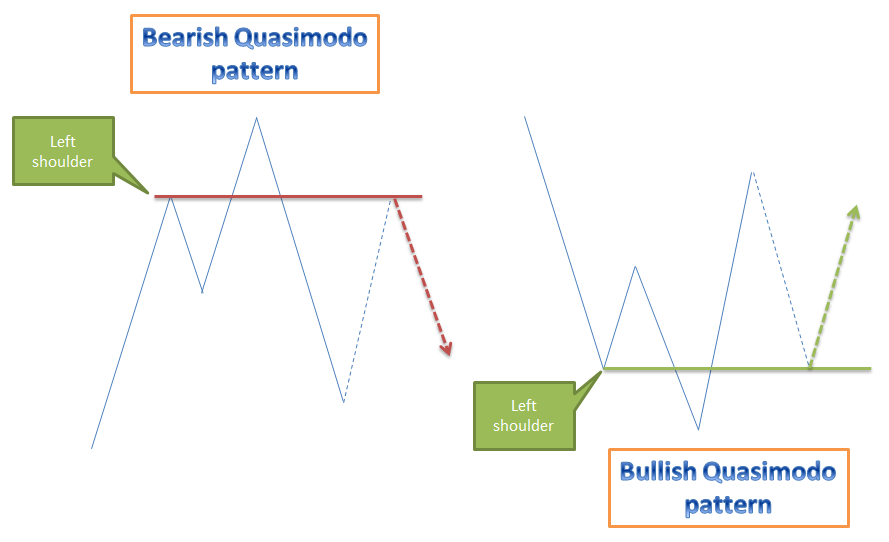
Figure A
Figure B illustrates a bearish QM on the hourly chart of EUR/CAD:
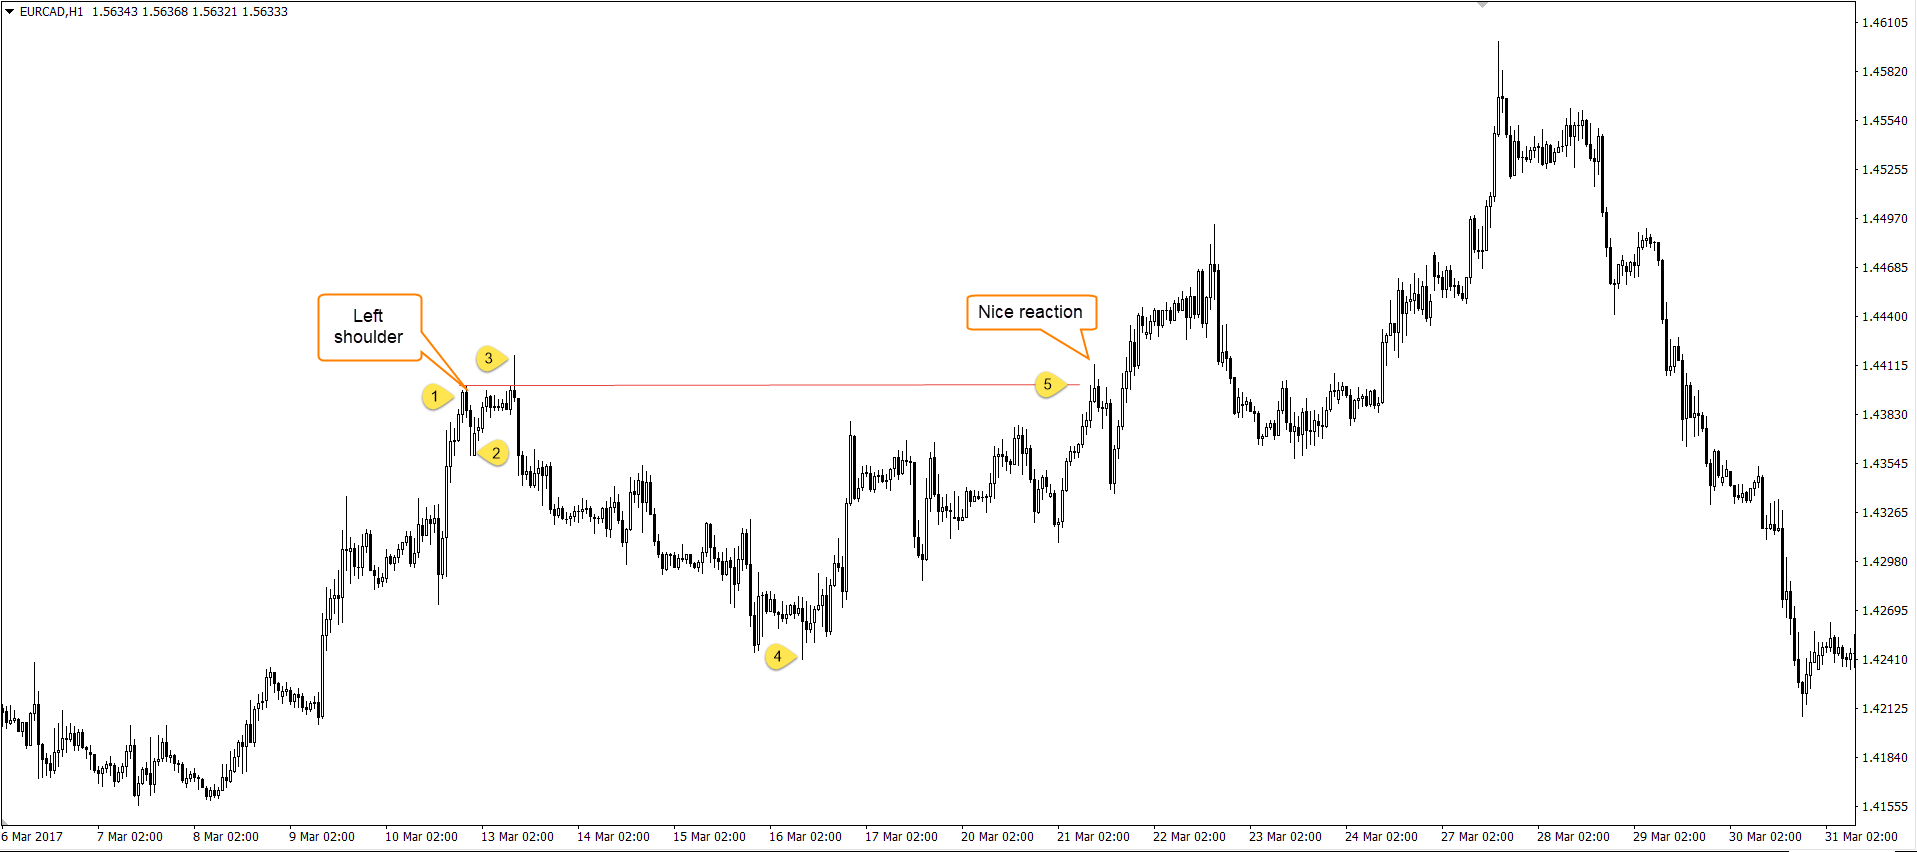
Figure B
Layout and Psychology
To understand the pattern’s structure and undercurrents, focus will be on the bearish QM resistance formation (figure C). The principles for a bullish QM support pattern are the same, only with orders reversed.
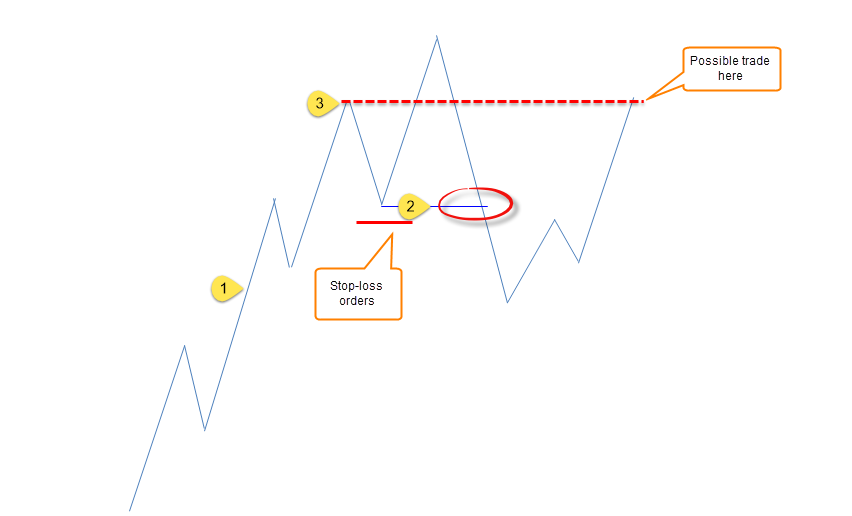
Figure C
Point 1:
At this stage, the market is hopeful, forming higher highs and higher lows. This attracts breakout traders, trend traders and contrarian traders.
Breakout traders look to buy the breaks of previous highs, trend traders aim to time dips (placing stops beneath previous higher lows) and contrarians attempt to fade action from areas of resistance.
Remember, though, trends are fractal. Although the structure of a trend is essentially the same, irrespective of the timeframe, a trend on a M5 chart may display a strong up move, but on the H4 chart this is likely to be nothing more than a blip in a potentially down trending market. It’s all fractal.
Point 2:
It is at point 2 the market pulls back and forms a bottom, a higher low.
This movement places breakout traders, who bought the break of the previous high, at breakeven, with most likely liquidating positions. Additionally, the push lower fills protective stop-loss orders from trend traders positioned too close to the action.
Point 3:
Trend traders who entered on the dip at point 2, with protective stop-loss orders tucked under the newly formed higher low, will have likely reduced risk to breakeven after crossing above point 3 and forming a higher high.
Price follows through to print a top and once again dips lower. While in decline, trend traders will look to buy into the move. It is only once we crush the previous higher low and flush out both trend and breakout traders (red circle) do we know a bearish Quasimodo formation is in play. Traders can then pencil in the left shoulder from point 3 (the red dotted line). This is the level traders look to sell short.
Confirmation
Without question, the QM pattern has proven to be one of the more superior ways of locating support and resistance levels.
Yet, trading this pattern alongside additional analysis can add weight to the level. This is where confirmation techniques shine.
The following confirmation techniques are simple and have stood the test of time, crucial to successful trading.
Candlestick Confirmation
Japanese candlestick patterns are popular forms of confirmation. Traders can employ candlestick signals as a means of validating a QM level. Figure D displays a common bearish inside candle pattern confirming bearish intent off a QM resistance level on EUR/GBP’s M30 chart.
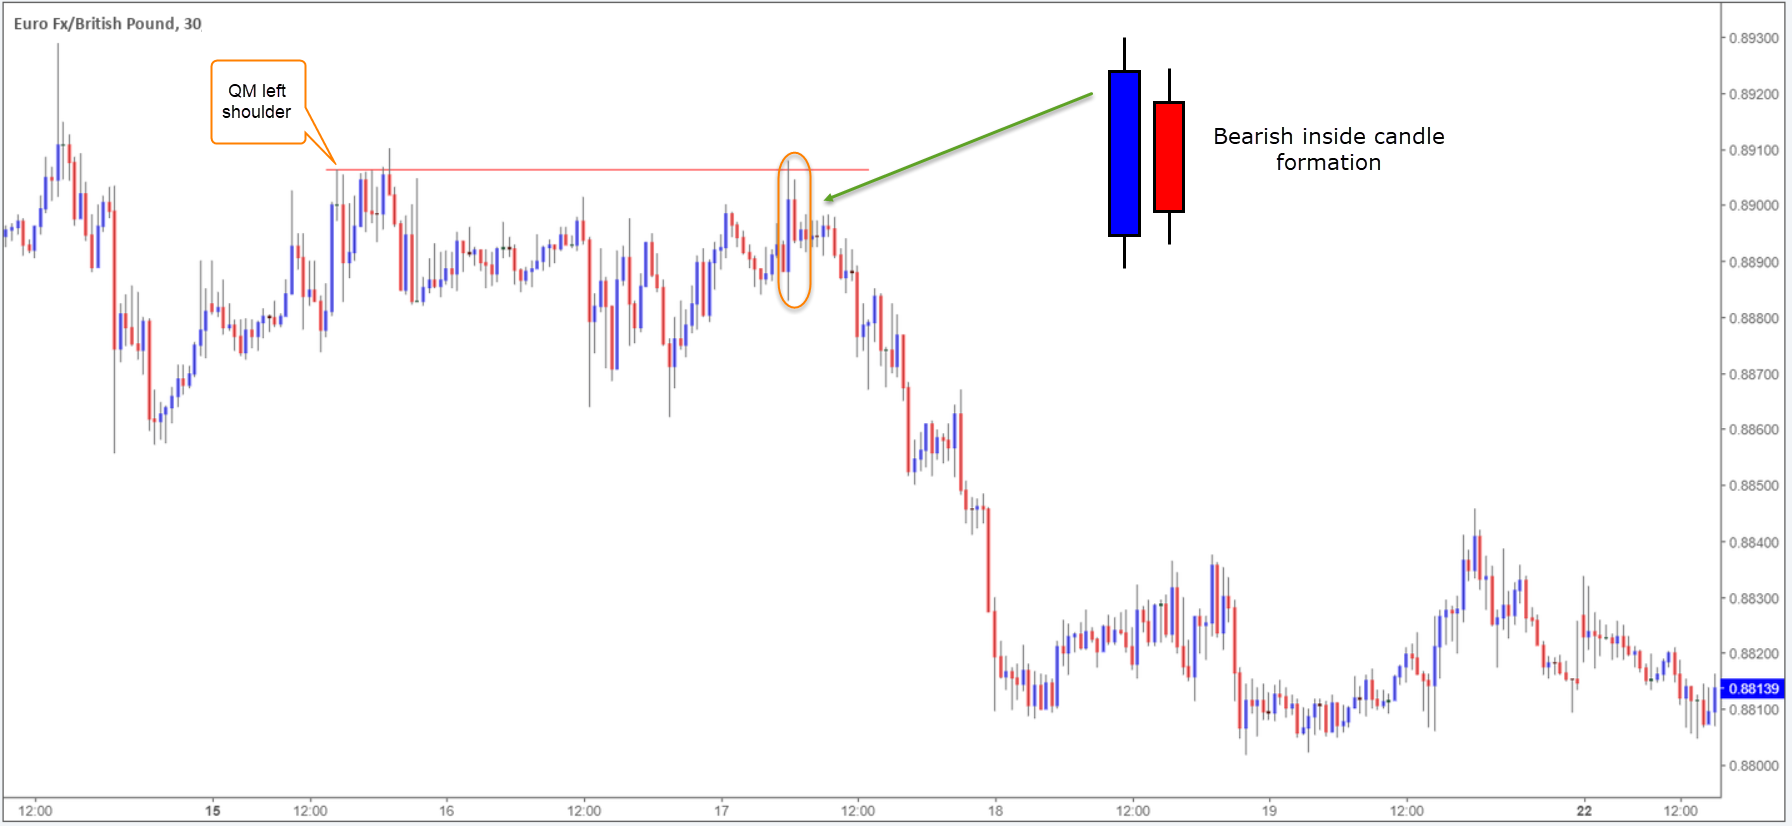
Figure D
Technical Confirmation
Technical confirmation employs additional technical tools, and is somewhat more involved than an individual candlestick signal. Put simply, traders believe when their selected tools align with base structure (the QM), the odds of a reaction increases.
As an example (figure E – the EUR/GBP’s H4 chart), when the following structures converge at a QM level, the area often provides at least a bounce:
- Fibonacci structure.
- Trend lines.
- RSI divergence – oversold/overbought.
- Trend direction.
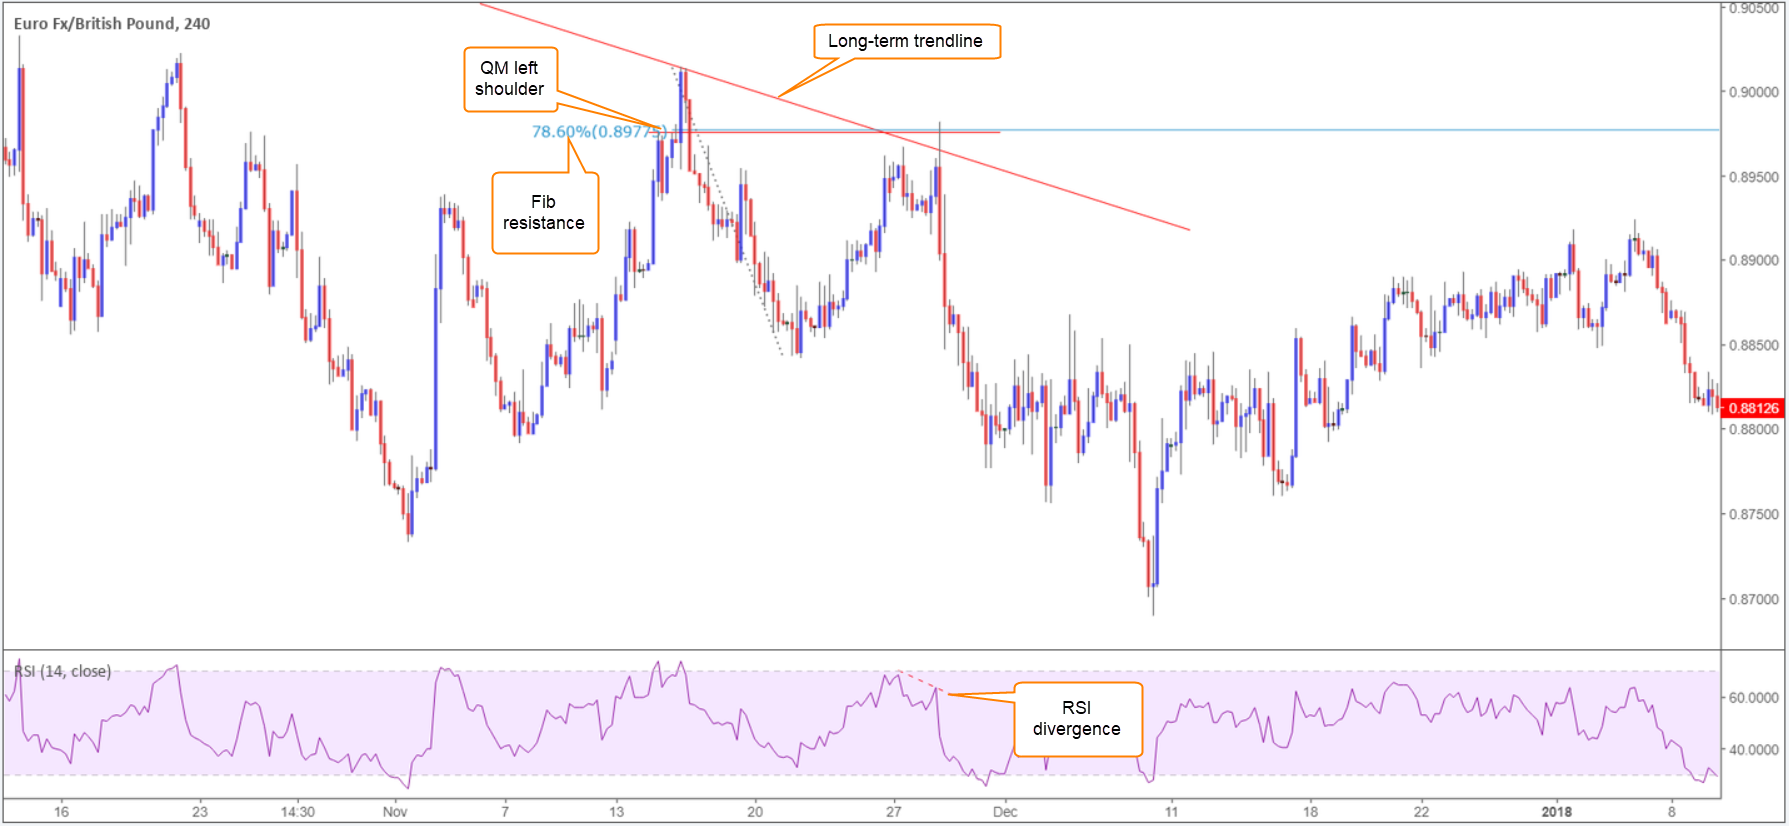
Figure E
The Approach
Another method of confirmation can be found in the approach.
By approach, it means identifying patterns formed in the direction of the QM level.
A popular pattern in this category is the AB=CD configuration, covered here.
Once you understand the mechanics behind the AB=CD formation, you’ll begin seeing setups similar to Figure F: an AB=CD pattern on gold’s H1 chart that fuses with a bearish QM level.
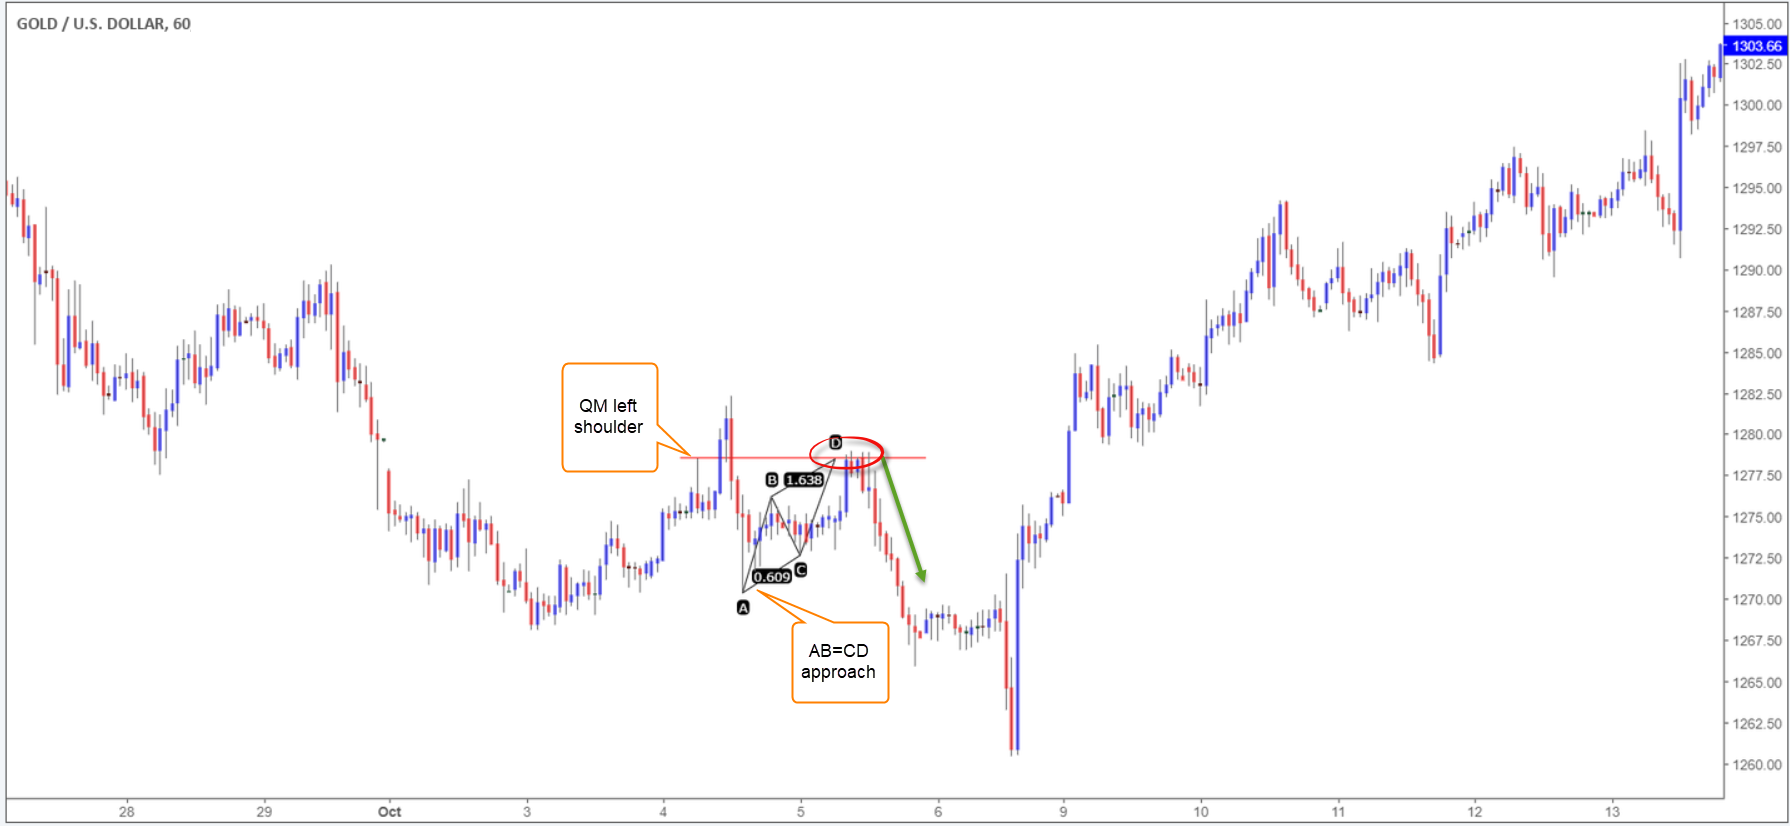
Figure F
When looking for additional confirmation at the QM base, remember the more reasons to trade a level, the more likely it’ll hold. Do not be afraid to experiment.
Stop-Loss Placement
Two concrete methods are available concerning stop-loss placement when trading QM levels.
The first approach is considered somewhat aggressive, but if you manage it right the risk/reward ratio can be incredible.
Figure G is such an example. As pictured on CAD/CHF’s H1 chart, the kink (or demand) surrounding the QM level is significant. You can, therefore, position stops beneath this kink and enter long at the QM level. The stop, in this case, would’ve been limited to only a few pips, and even with the small move seen off the level, a comfortable risk/reward ratio would be achieved.
Traders will need to keep in mind there will be times when the kink is not visible on the traded timeframe. In that case, you’ll have to drill down to the lower timeframes to locate it.
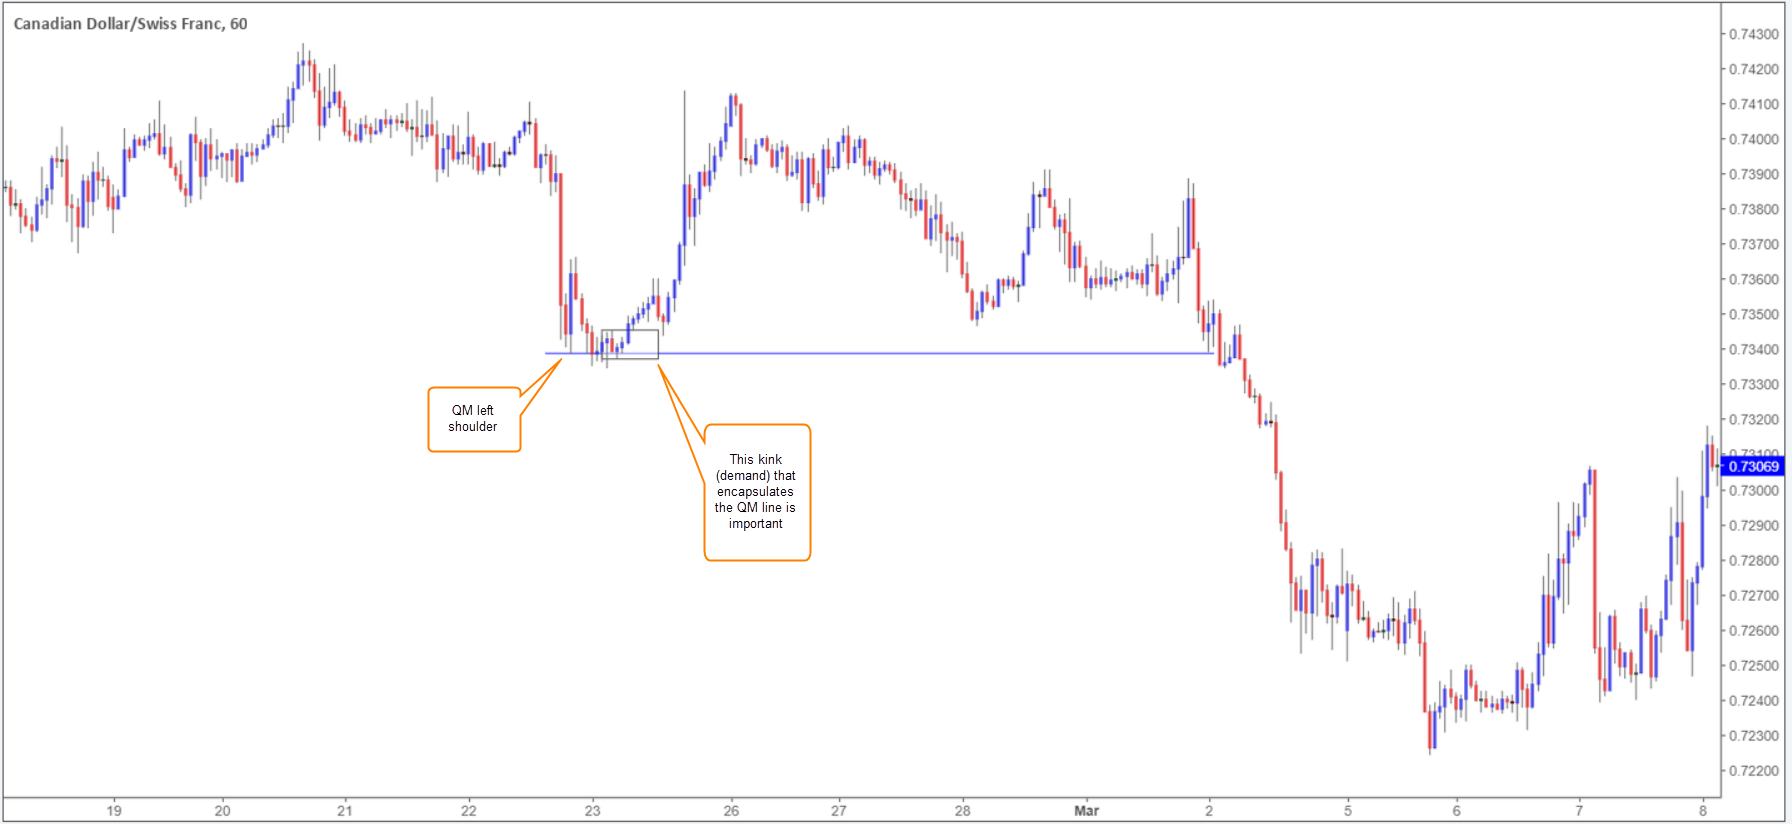
Figure G
The alternative to the above is a more conservative approach.
Point 1 in figure H (CAD/CHF’s H1 chart) has you position the stop beyond the QM head. The trade example would have still likely been profitable, depending on trade management.
Point two is more involved. Rather than positioning the stop beyond the QM head, some traders opt to place it outside the next available supply/demand area. This helps evade fakeouts. Given the size of the surrounding demand in figure H, the stop-loss distance is enormous. Not all surrounding supply/demand zones are quite as big as this one.
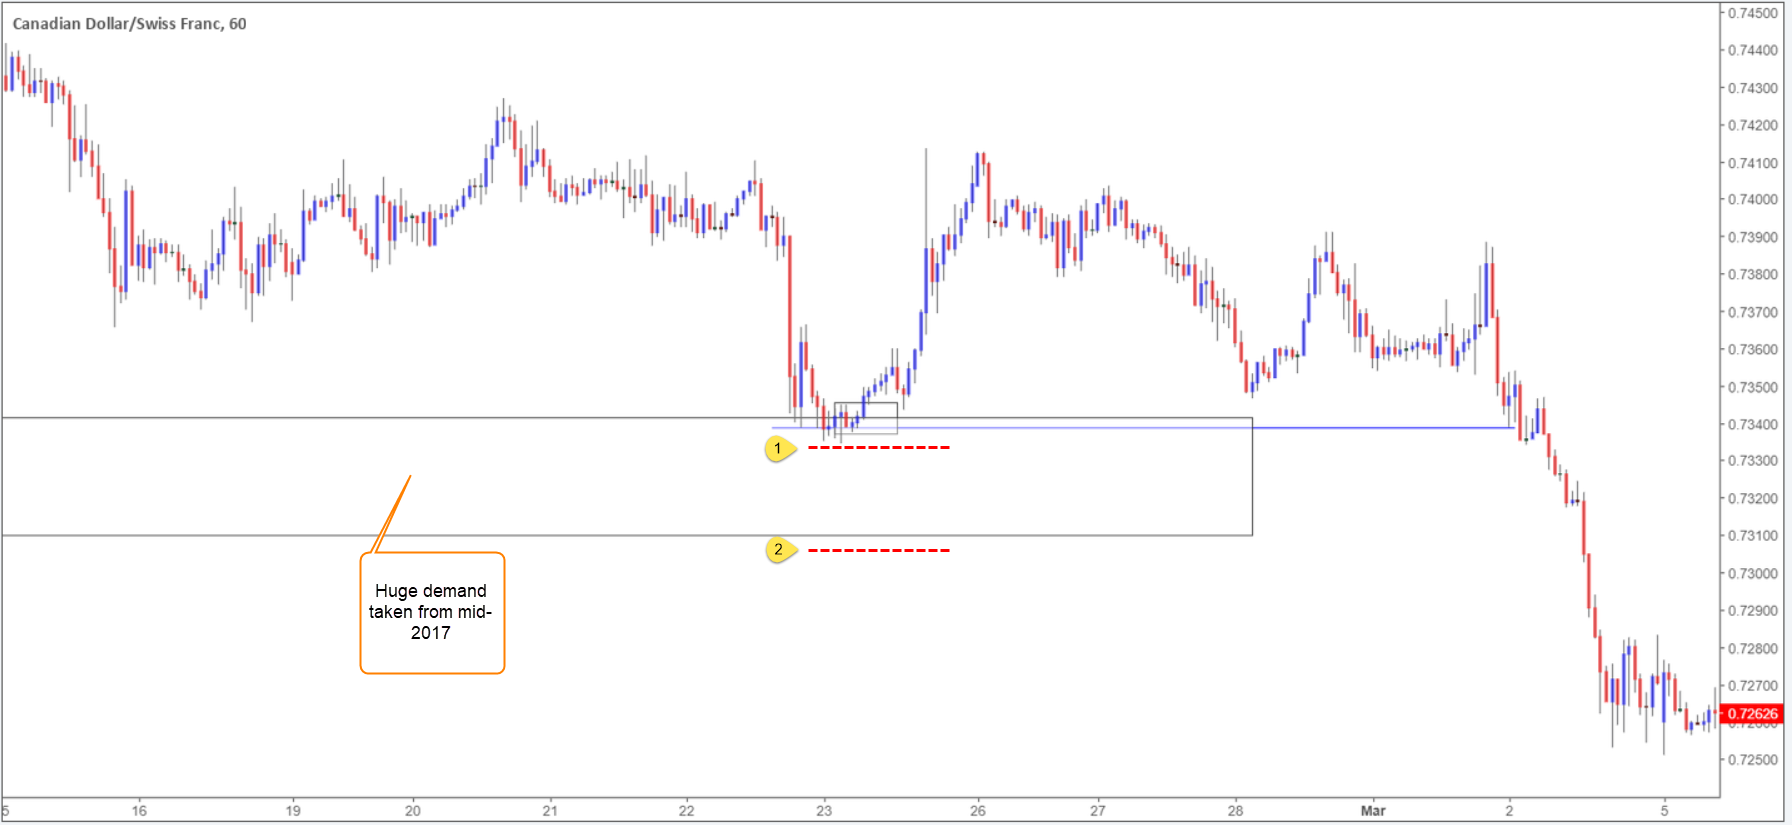
Figure H
Moving Forward
By this point, you should have sufficient knowledge to begin testing QM levels on a demo account.
Once confident using simulated funds, you may consider switching things up to a small live account. With IC Markets, simply sign up here, deposit a minimum of $200 and you’re good to go.
The accuracy, completeness and timeliness of the information contained on this site cannot be guaranteed. IC Markets does not warranty, guarantee or make any representations, or assume any liability regarding financial results based on the use of the information in the site.
News, views, opinions, recommendations and other information obtained from sources outside of www.icmarkets.com.au, used in this site are believed to be reliable, but we cannot guarantee their accuracy or completeness. All such information is subject to change at any time without notice. IC Markets assumes no responsibility for the content of any linked site.
The fact that such links may exist does not indicate approval or endorsement of any material contained on any linked site. IC Markets is not liable for any harm caused by the transmission, through accessing the services or information on this site, of a computer virus, or other computer code or programming device that might be used to access, delete, damage, disable, disrupt or otherwise impede in any manner, the operation of the site or of any user’s software, hardware, data or property.