Updated June 2020
While it’s true all trading strategies shoulder losing setups, some losses can be avoided.
Experienced traders are conscious of what’s ahead on the economic calendar. Newer traders, though, often expose positions to unnecessary risk around news time.
Price Action – News
Economic news releases can drastically affect price movement.
Depending if market expectations are met, price action may fluctuate rapidly as a result of news, causing spreads to widen (the difference between bid/ask prices is called spread – it represents the main part of a broker’s service costs). It is important to remember spreads are usually variable, and will adjust as liquidity providers change their pricing.
Traders might also want to note increased volatility, often triggered by news, may involve periods of illiquidity, making it difficult to enter/exit at desired prices due to spreads widening.
Economic Calendar Data
One of the most popular retail foreign exchange economic calendars can be found on Forex Factory (Figure A).
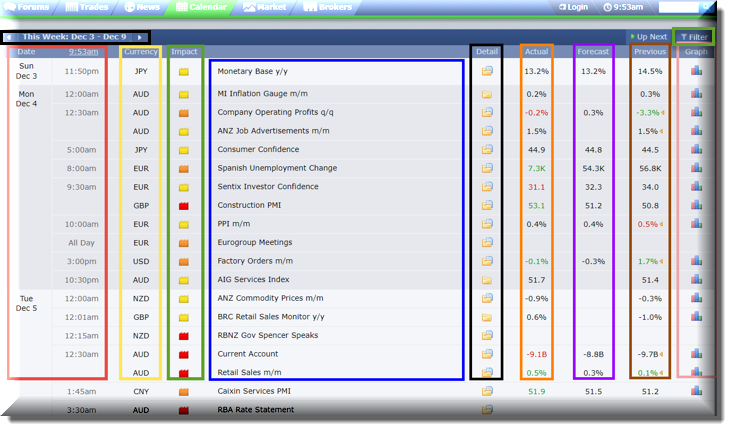
(FIGURE A)
- The first data point highlights Date and Time of news events (red). Something you may wish to consider altering here is the time zone. Setting it to your country’s time zone, or a time zone of the session you trade, avoids unnecessary confusion. You can do this by clicking on the clock tab located at the top right-hand corner of the calendar.
- The next column (yellow) highlights the Currency, informing traders which currency the news event is likely to affect. For example, at 9.30am UK Construction PMI takes centre stage (figure A) and shows GBP as a possibly affected currency. For that reason, traders know to keep an eye on GBP-related currency pairs during this time.
- Next is Impact (green). This identifies the expected volatility of a specific news release. The yellow tab anticipates a low impact; the orange tab indicates a potential medium impact while the red tab is significant, demonstrating volatile movement may be on the cards.
- Sliding across (blue) you’ll find the title of the event. Examples (figure A) include Australian Company Operating Profits q/q at 12.30am on Monday and Spanish Unemployment later on at 8am – both considered medium-impacting events.
- The next section, Detail, displays vital information (black). By clicking on the file tab, you’re presented with a variety of particulars: news source, release measures and usual effect on the currency. It also permits a view of historic values/forecasts and any related stories.
- The following column (orange) demonstrates the Actual figure – the outcome of the release. This, obviously, is not available until the release date/time.
- The subsequent area covers Forecast (purple), a consensus figure among economists. Both forecast and actual columns are noteworthy. If the actual value falls outside of the consensus range, price action can swing rapidly. An example is US non-farm payrolls employment change, a major market-moving event published each month. Imagine economists forecast a 100K print though actual numbers came in lower than expected (marked red [better-than-expected figures will be marked green]), this could generate a broad USD selloff.
- Next is Previous (brown). Here you’ll find what the previous actual figure was. However, do remain aware values in this section can be revised, viewed by hovering your cursor above the small yellow triangles printed to the right of the value.
- The next section displays a Graph (pink). Clicking on this tab brings up a histogram of actual vs. forecast figures from previous dates.
Traders are also able to view historical data, accessible by clicking on the date tab shown at the top left-hand corner of the calendar (black). There’s also a handy filter function situated above the Graph column, giving traders the ability to narrow down their selection (green).
In Closing
With a greater understanding of the economic calendar’s features, getting caught unaware should be a thing of the past.
To ensure you’re always one step ahead, it’s advised to note market-moving events before your trading day begins.
The accuracy, completeness and timeliness of the information contained on this site cannot be guaranteed. IC Markets does not warranty, guarantee or make any representations, or assume any liability regarding financial results based on the use of the information in the site.
News, views, opinions, recommendations and other information obtained from sources outside of www.icmarkets.com.au, used in this site are believed to be reliable, but we cannot guarantee their accuracy or completeness. All such information is subject to change at any time without notice. IC Markets assumes no responsibility for the content of any linked site.
The fact that such links may exist does not indicate approval or endorsement of any material contained on any linked site. IC Markets is not liable for any harm caused by the transmission, through accessing the services or information on this site, of a computer virus, or other computer code or programming device that might be used to access, delete, damage, disable, disrupt or otherwise impede in any manner, the operation of the site or of any user’s software, hardware, data or property.